Ebook Cardiac resynchronization therapy: Part 2
Bạn đang xem bản rút gọn của tài liệu. Xem và tải ngay bản đầy đủ của tài liệu tại đây (8.24 MB, 161 trang )
9781841846378-Ch12
6/14/07
10:08 AM
Page 165
12
Optimization of the interventricular (V–V)
interval during cardiac resynchronization
therapy
S Serge Barold, Arzu Ilercil, Stéphane Garrigue, and Bengt Herweg
Programmability of the interventricular interval • Pathophysiologic basis for programming
the V–V interval • Clinical studies of V–V interval programming • General considerations
• Effect of V–V timing on the ECG of biventricular pacemakers • Automatic device-based
optimization of the V–V delay
PROGRAMMABILITY OF THE
INTERVENTRICULAR INTERVAL
PATHOPHYSIOLOGIC BASIS FOR PROGRAMMING
THE V–V INTERVAL
The methods for atrioventricular (AV) optimization in patients receiving cardiac resynchronization therapy (CRT) are almost universally used
for programming the optimal interventricular
(V–V) delay.1–6 Conventional M-mode echocardiography for the measurement of left ventricular
(LV) dyssynchrony using septal-to-posterior
wall motion delay may be unreliable
and poorly reproducible.7 Determination of the
extent of residual LV dyssynchrony after
V–V programming requires more sophisticated
echocardiographic techniques such as tissue
Doppler techniques (peak velocity time
difference, delayed longitudinal contraction
score, etc.), three-dimensional (3D) echocardiography, and automatic endocardial border
detection.8–12
Contemporary biventricular devices permit
programming of the V–V interval usually in
steps from +80 ms (LV first) to −80 ms (right ventricle (RV) first) to optimize LV hemodynamics.
This design was the result of cogent pathophysiologic considerations that simultaneous activation of the two ventricles for CRT was illogical.13
Perego et al13 advanced arguments that the best
mechanical efficiency in CRT is not necessarily
achieved by simultaneous pacing of the two ventricles (hence the importance of programmability
of the V–V interval) (Figure 12.1):
1.
2.
3.
4.
In normal hearts, activation of the two ventricles does not occur simultaneously, i.e.,
epicardial RV depolarization starts a few milliseconds earlier than LV depolarisation.14,15
In CRT, epicardial LV pacing delays transmission of activation that is normally supposed to
reach the subendocardial conduction system
before it spreads to the remaining ventricle.
In advanced cardiomyopathy, RV-to-LV
interactions can be different from those in
normal hearts.
Myocardial disease is associated with different locations and sizes of scars, and heterogeneity of conduction disturbances. The
baseline ventricular conduction defect differs considerably from case to case, especially in patients with a QRS duration
>150 ms.16 Theoretically, slow conduction in
9781841846378-Ch12
6/14/07
10:08 AM
Page 166
166 CARDIAC RESYNCHRONIZATION THERAPY
possibly with right bundle branch activation
alter QRS configuration and hemodynamics.
LVp
LVp
Delayed
conduction
Delayed
conduction
Time
Normal
conduction
RVp
SIMULTANEOUS
PACING
Normal
conduction
RVp
Programmable
V–V delay
SEQUENTIAL
PACING
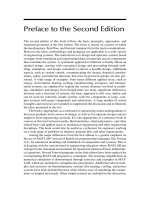
Figure 12.1 Diagrammatic representation of left ventricular
(LV) conduction delay interfering with synchronous activation
of the two ventricles at the broken horizontal line.
Programmability of the interventricular (V–V) interval permits
pre-activation of the LV to compensate for the LV conduction
delay. In this way, both ventricles are activated synchronously
at the broken horizontal line. LVp, LV pacing event; RVp, right
ventricular pacing event.
5.
6.
the presence of scar tissue in ischemic cardiomyopathy would necessitate more LV
pre-excitation. Conduction delay may be
caused not only by isolated left bundle
branch block (LBBB), but also by more global
anisotropic disturbances of the conduction
system and/or myocardial scars, latency of
LV stimulation, and delayed global depolarization.17–20 Despite similar QRS morphology,
congestive heart failure (CHF) patients with
LBBB, and LV dyssynchrony exhibit different
locations and patterns of dyssynchrony.21
The ventricular leads (particularly the LV
leads) are placed in quite different anatomic
positions, depending on the operator’s
choice and coronary sinus anatomy, producing paced ventricular activation patterns
that differ from patient to patient. V–V
programmability may compensate for less
than optimal LV lead position by tailoring
ventricular timing to correct for individual
heterogeneous ventricular activation patterns commonly found in patients with LV
dysfunction and CHF.
The presence and varying degree of fusion
with the spontaneous QRS complex and
On the basis of the above arguments, it is
therefore not surprising that V–V programmability in the reported studies has shown a heterogeneous response, with great variability of the
optimal V–V delay from patient to patient, so
that adjustment of the V–V delay, like the
AV delay, must be individualized (Figures 12.1
and 12.2). In addition, assessment of the role of
V–V programmability is compounded by the
varied cut-off QRS duration for inclusion in the
various studies, the different testing procedures
to determine the optimum V–V delay, and
whether AV delay optimization was performed
before testing the V–V response.
CLINICAL STUDIES OF V–V INTERVAL
PROGRAMMING
Although V-V programmability produces a
rather limited improvement in stroke volume,
the response is important in patients with a less
than desirable response to CRT. It is presently
unknown whether AV and/or V–V interval
optimization can actually decrease the percentage of non-responders to CRT.
Sogaard et al21 performed one of the first studies evaluating the role of V–V delay in CRT
patients, and convincingly demonstrated that the
site and degree of mechanical asynchrony can
vary from patient to patient and are influenced by
the underlying etiology of disease, whether
ischemic or non-ischemic. They defined a new
parameter that they called the extent of delayed
LV longitudinal contraction (DLC) (Figure 12.3).
This is calculated using tissue Doppler imaging
(TDI) coupled with strain rate analysis. A segment
was considered to have DLC if the strain rate
analysis demonstrated motion reflecting true contraction and if the end of the segmental contraction occurred after aortic valve closure. Sogaard
et al21 found that the extent of myocardium with
DLC predicted improvement of LV systolic performance and reversion of LV remodeling during
short- and long-term CRT. Their observations
indicated that DLC represented mechanical
LV asynchrony and thus a contractile reserve,
which could be recruited by CRT (Figure 12.3).
9781841846378-Ch12
6/14/07
10:08 AM
Page 167
OPTIMIZATION OF THE INTERVENTRICULAR INTERVAL DURING CRT 167
0.785 × (diameterLVOT)2 × VTILVOT = SV
V–V −80 ms
delay
−40 ms
Simultaneous
RV pre-excitation
+40 ms
+80 ms
LV pre-excitation
LVOT
VTI
V–V time corresponding to greatest stroke volume
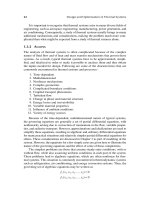
Figure 12.2 Interventricular V–V interval delay using left ventricular outflow tract (LVOT) measurements of blood flow velocities
for estimation of stroke volume (SV). SV is exponentially related to the LVOT diameter and directly to the velocity–time integral
(VTI) of the LVOT. Variation of the V–V interval affects the SV, as evidenced by varying VTI measurements that can serve as surrogate markers for resynchronization. The optimal V–V interval in this example is derived from pacing the right ventricle (RV)
40 ms before the left ventricle (LV). The optimal AV delay becomes equal to optimal AS-LVP minus the 40 ms V–V interval.
LVP, monochamber LV pacing. (Reproduced from Gassis S, Leon AR. Cardiac resynchronization therapy: strategies for device
programming, troubleshooting and follow-up. J Interv Card Electrophysiol 2005;13:209–22.)
However, the location of myocardium displaying DLC is variable in patients with heart failure
and ventricular conduction disturbances. It was
hypothesized that individually tailored preactivation of myocardium displaying DLCs could
further improve the overall response to CRT.
Sogaard et al,21 using Doppler imaging techniques, studied 21 patients with LBBB, QRS >
130 ms, and New York Heart Association
(NYHA) functional class III or IV heart failure,
specifically before and after CRT (Figure 12.4).
Post-implantation studies were performed during
simultaneous CRT and at 12, 20, 40, 60, and 80 ms
V–V delay intervals, with either LV or RV preexcitation. The study population consisted of
11 patients with ischemic cardiomyopathy and
9 patients with idiopathic dilated cardiomyopathy.
As noted in prior studies, DLC in patients with
idiopathic dilated cardiomyopathy was identified in the lateral and posterior LV walls. In contrast, ischemic cardiomyopathy exhibited DLC
more frequently in the septal and inferior walls.
Echocardiographic parameters improved during
sequential CRT, with LV pre-activation being
superior in 9 patients and RV pre-activation
being superior in 11 patients (Figure 12.4).
Compared with simultaneous CRT, tailored
sequential CRT reduced the extent of segments
with DLC in the base from 23 ± 13% to 11 ± 7%
(p<0.05). The LV ejection fraction (LVEF)
increased from 29.7 ± 5% to 33.9 ± 6% (p<0.01).
After 3 months of sequential CRT the LVEF
improved further from 33.6 ± 6% to 38.6 ± 7%
(p<0.01). Sogaard et al21 observed that despite
9781841846378-Ch12
6/14/07
10:09 AM
Page 168
168 CARDIAC RESYNCHRONIZATION THERAPY
Aortic valve closure:
early diastole starts
DLC
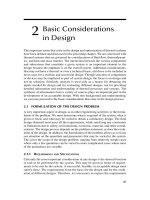
Figure 12.3 Tissue Doppler imaging showing left ventricular (LV) dyssynchrony. Apical long-axis view in a patient with a dilated
cardiomyopathy and left bundle branch block. One Doppler sample (yellow) is positioned at base of the septal LV wall,
and another (green) is at the base of the lateral wall. In each of the two points, strain rate analysis is carried out in a range of
10 mm around the cursor center. The first vertical line (right) shows the onset of negative strain rate (yellow curve), indicating
active contraction in systole. The second vertical line indicates cessation of septal systole, where the strain rate (yellow curve)
becomes positive. The third vertical line (red) represents aortic valve closure: note the still-negative strain rate in the lateral wall
(green curve); this phenomenon persists, indicating active shortening in early diastole until the strain rate becomes positive
(i.e., delayed longitudinal contraction, (DLC). (Reproduced from Garrigue S. Optimization of cardiac resynchronisation therapy:
the role of echocardiography in atrioventricular, interventricular and intraventricular delay optimisation. In: Yu CM, Hayes DL,
Auricchio A, (eds.) Cardiac Resynchronization Therapy. Malden, MA, Blackwell-Futura, 2006:310–28. With permission from
Blackwell Publishing.)
comparable LBBB patterns, the location of DLC
differed between the two groups of patients.
Additionally, the diastolic filling time increased
even without any AV delay optimization.
Finally, they concluded that the location of DLC
predicted the optimal sequential CRT as posterior lateral wall DLC was associated with
optimal sequential CRT via LV pre-activation,
while septal and inferior wall-DLC was associated with optimal sequential CRT via RV preactivation. The optimal V–V delay ranged
between 12 and 20 ms.
InSync III study
The InSync III clinical study was a landmark
large-scale investigation that firmly established
the importance of V–V timing in CRT patients. It
used a multicenter, prospective, non-randomized
design to evaluate the clinical effectiveness of
sequential biventricular CRT.22 All patients
(359 with sequential devices and 216 with simultaneous CRT devices) underwent reassessment
of quality of life, follow-up 6-minute hall walk
test, and estimation of NYHA functional class
before hospital discharge and at 1, 3, and 6 months
after implant. At follow-up, optimization of the
AV and V–V stimulation intervals was carried
out. Echo Doppler interrogation first determined
the optimal AV interval that maximized transmitral filling using the Ritter method. The
right atrium (RA) to LV interval was kept constant at the optimal setting while varying the
LV−RV interval in random sequence −80 ms (RV
first) to +80 ms (LV first) to identify the V–V
offset producing the greatest LV stroke volume.
The Doppler-derived stroke volume at each V–V
setting was determined by LV outflow tract
9781841846378-Ch12
6/14/07
10:09 AM
Page 169
OPTIMIZATION OF THE INTERVENTRICULAR INTERVAL DURING CRT 169
(a)
Non-IHD systolic performance at baseline
(b)
Non-IHD baseline delayed longitudinal contraction
(c)
Non-IHD systolic performance during CRT (simultaneous)
(d)
Non-IHD systolic performance during CRT (LV preactivated by 20 ms)
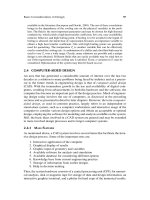
Figure 12.4 Effect of sequential biventricular pacing. (a) Transthoracic tissue tracking echocardiographic images in apical
four-chamber view in systole in a patient with idiopathic dilated cardiomyopathy before implantation of a CRT device. Most of
the lateral wall, the posterior wall, and distal parts of the anterior wall are gray, indicating lack of systolic motion toward the
apex (white arrows). Color-coded scaling on the left side of each image indicates regional motion amplitude. Mechanical
function of the interventricular septum and inferior walls is abnormal, with greater motion amplitude in segments adjacent
to the apex (green arrows). (b) Extent of myocardium (colored segments) with delayed longitudinal contraction (DLC) in diastole
(mitral valve open) shown in the lateral wall. Note that the remaining part of the left ventricle (LV) is gray, indicating no motion
(the rest of the LV entered the relaxation phase). (c) The same patient with simultaneous CRT, resulting in contraction of a
larger proportion of the lateral wall. In addition, each segment shows improved systolic shortening as judged from color coding.
Moreover, abnormal distribution of myocardial motion in the interventricular septum has been normalized. (d) Impact of
sequential CRT with the LV activated by 20 ms before the right ventricle (RV). Compared with simultaneous CRT, sequential
CRT yields further improvement in the overall proportion of contracting myocardium in the lateral wall. In addition, each
segment shows further improvement in systolic shortening amplitude. (Adapted from Sogaard P et al. Circulation 2002;
106:2078–84.21)
9781841846378-Ch12
6/14/07
10:09 AM
Page 170
170 CARDIAC RESYNCHRONIZATION THERAPY
(a)
p<0.0001
70
Meters walked in 6 min
40
30
20
p<0.0001
10
0
M-Control
0
M-CRT
InSync III
10
5
LV40
LV20
LV4
RV20 RV40
Programmed V–V delay
RV80
Figure 12.6 Optimal V–V timing settings in the InSync III trial
(simultaneous vs sequential biventricular pacing) at prehospital discharge and at 3 and 6 months. LV80, LV lead preexcitation 80 ms, etc.; RV20, RV lead pre-excitation 20 ms,
etc. Diagonally lined bars , pre-hospital discharge; black bars ,
3 months; white bars , 6 months. (Reproduced with permission
from Leon AR et al. J Am Coll Cardiol 2005;46:2298–304.22)
p<0.0001
−5
Change in score
15
LV80
50
−10
p = 0.1126
−10
−15
−20
−25
M-Control
M-CRT
InSync III
M-CRT (N = 215)
InSync III (N = 359)
(c)
60
Percentage of patients
20
0
60
(b)
25
Percentage of patients
(LVOT) VTI multiplied by the LVOT crosssectional area. The improvement in stroke
volume was defined as the difference between
the stroke volume at the optimal V–V setting
and that at the nominal, or simultaneous, V–V
setting (Figure 12.5).
50
40
30
20
10
0
M-Control (N = 203)
Figure 12.5 InSync III study comparing simultaneous biventricular pacing with sequential biventricular pacing: changes in
6-minute hall walk (a), quality-of-life score (b), and changes in
NYHA functional class (c) after 6 months. In (c): black bars,
improved у2; diagonally lined bars, improved; white bars, no
change; dotted bars , worsened. M, Multicenter InSync
Randomized Clinical Evaluation (MIRACLE); M-CRT, MIRACLE
Cardiac Resynchronization Therapy trial. (Reprinted from J Am
Coll Cardiol. Vol 46. Leon AR, Abraham WT, Brozena S, et al;
Insync III Clinical Study Investigators. Cardiac resynchronization
with sequential biventricular pacing for the treatment of moderateto-severe heart failure. Pages 2298–304. (2005). With permission from the American College of Cardiology Foundation.22)
Figure 12.6 illustrates the distribution of the
optimal LV–RV settings in the InSync III study
prior to hospital discharge and at 3 and 6 months
of follow-up. More than 75% of patients at each
assessment had an optimal LV–RV setting
between −40 ms and +40 ms.22 The majority of
patients had an optimal V–V setting delivering
LV stimulation first (55%, 54%, and 58% at hospital discharge and 3- and 6-month visits,
respectively). The proportion of patients with a
simultaneous optimal V–V setting remained
fairly stable over time (23%, 20%, and 19% at
hospital discharge and 3- and 6-month visits,
respectively). The proportion of patients with an
optimal V–V setting delivering RV stimulation
first also remained consistent at the three followup visits (23%, 26%, and 23%, respectively)
(Figure 12.6). Individual patient changes during
follow-up were not performed. Increased stroke
volume was found in 81% of the V–V patients at
6 months. Stroke volume improved (optimal vs
simultaneous V–V setting) by 8.6% (median percentage) prior to hospital discharge, by 8.4% at
3 months, and by 7.3% at 6 months. Sixty-four
patients (17%) prior to hospital discharge,
49 patients (14%) at 3 months, and 49 patients
(14%) at 6 months experienced an improvement
in stroke volume of 20% or more during sequential pacing. Patients with a history of myocardial
infarction were identified as experiencing
statistically significant more improvement in
9781841846378-Ch12
6/14/07
10:09 AM
Page 171
OPTIMIZATION OF THE INTERVENTRICULAR INTERVAL DURING CRT 171
stroke volume (p = 0.03) during optimal V–V
programming versus the nominal V–V setting.
The improvement in stroke volume at the optimal V–V interval continued throughout all
follow-up intervals (prior to hospital discharge
and at 3 and 6 months). This suggests that the
ability to vary V–V timing compensated for
infarct-related conduction block. Increase in
stroke volume in NYHA functional class IV
patients with an optimized V–V setting was not
statistically significant (p = 0.1344), yet it was
consistent across all follow-up intervals (prior to
hospital discharge, and at 3 and 6 months).
There was no significant difference in the
effect of optimized sequential and simultaneous
CRT on NYHA functional class or quality-of-life
score and functional capacity.22 However, the
V–V group experienced a greater improvement
in 6-minute hall walk from baseline to 6 months
compared with the simultaneous CRT group
(p = 0.0015). There was no correlation between
improvement in stroke volume and improved
exercise capacity.
Overview of small-scale studies
Table 12.1 outlines data from studies involving a
relatively small number of patients, as well as
the large InSync III trial.2, 22–31 The overall results
of the smaller studies are basically similar to
those of the larger InSync III study.
GENERAL CONSIDERATIONS
The optimal V–V delay should decrease LV dyssynchrony and provide a more homogeneous
LV activation with faster LV emptying and
improved and longer diastolic filling. V–V programmability may increase LVEF and other
indices of LV function, and may also reduce
mitral regurgitation in some patients,30 but overall improvement is only moderate. V–V programming may be particularly helpful in
compensating for less than optimal LV lead
position, by tailoring ventricular timing to correct for individual heterogeneous ventricular
activation patterns. The benefit of V–V programming is additive to AV delay optimization.
The optimal V–V delay cannot be identified
clinically in the majority of patients (Table 12.1).
The range of optimal V–V delays is relatively
narrow and most commonly involves LV
pre-excitation by 20 ms. LV pre-excitation is
required in most patients. RV pre-excitation
should be used cautiously, because advancing
RV activation may cause a decline in LV function.
Consequently, RV pre-excitation should be reserved
for patients with dyssynchrony in the septal and
inferior segments, provided there is hemodynamic proof of benefit.21 Patients with ischemic
cardiomyopathy (with slower-conducting scars)
may require more pre-excitation than those
with idiopathic dilated cardiomyopathy.24 V–V
programming is of particular benefit in patients
with a previous myocardial infarction.22
V–V programming in patients with
permanent atrial fibrillation
Most of the studies listed in Table 12.1 excluded
patients with atrial fibrillation. The study by van
Gelder et al24 suggests that V–V programming is
also beneficial in CRT patients with atrial fibrillation and continual biventricular pacing, but
further work is required to confirm these
results.23
Order of AV and V–V programming
The order in which CRT systems are hemodynamically optimized is important. Ideally, the
optimal left-sided AV delay should be determined before each V–V setting. This may be
accomplished by determining the optimal AV
delay from the time of sensing in the RA to the
LV stimulus (AS–LV delay) during monochamber LV pacing. This AV delay remains optimized
if the RV is not pre-excited, simply because
the LV is activated at the end of the programmed
AV delay. RV pre-excitation should be used
cautiously, because it may impair the optimal
AV delay by delaying the left-sided AV
delay. With RV pre-excitation, the optimal
AV delay becomes equal to the optimal AS–LV
delay minus the programmed V–V interval32
(Figure 12.2). The timing of the AV delay in
Guidant devices is RV-based. Consequently, the
programmed AV delay for LV pre-excitation is
equal to the optimal AV delay plus the V–V
interval.
9781841846378-Ch12
6/14/07
10:09 AM
Page 172
172 CARDIAC RESYNCHRONIZATION THERAPY
Table 12.1 Studies of sequential biventricular pacing
Ref
Year
No. of pts
QRS (ms)
Parameter
Resultsa
21
13
23
2002
2003
2004
20
12
9 AF
TDI and 3D echocardiography
Invasive dP/dtmax
Invasive dP/dtmax
LV1 9, RV1, 11 pts
LV1 9, BiV0 3 pts
BiV0 > RV1, LV1 minimal
effect
24
2004
53:41 SR,
12 AF
>130
у150
152 ± 44
(7 LBBB,
1 RBBB,
1 normal)
>150
Invasive LV dP/dtmax
25
2004
34
Echo Doppler determination
of stroke volume
26
2005
22
у130 (у180
in PM
dependent pts)
>130
LV1 44 (84%), BiV0 6, and
RV1 3 pts. Mean V–V
interval was greater for
ischemic than idiopathic
cardiomyopathy
LV1 62%
2
27
28
2005
2005
2005
27
21
19
>120
>130
у150
29
22
2005
2005
20
207 BiV0, 359
sequential
у130
у130
30
31
2006
2006
23
86
>120
>150
Invasive LV dP/dtmax
Sequential pacing 41% pts,
with only 1 RV1 pt. Others
BiV0 equivalent
Radionuclide angiography (LVEF)
Echocardiography MPI
Echo Doppler determination
of cardiac output
LVOT VTI
Echo Doppler determination
of stroke volume
LV1 45%, BiV0 33%, RV1 22%
LV1 48%, RV1 48%, BiV0 4%
LV1 best in most pts, RV1
best in 2 pts
LV1 12, RV1 5, BiV0 3 pts
At 6 months:
LV1 58%, BiV0 19%,
RV1 23%,
LV1 60, BiV0 22%, RV1 18%
LV1 36%, RV1 35%, BiV0 29%
Aortic VTI
Echo Doppler determination
of stroke volume
3D, 3-dimensional; AF, atrial fibrillation; BiV0, simultaneous biventricular pacing; LBBB, left bundle branch block; LV, left ventricle; LV1, LV
pre-activation; LVEF, LV ejection fraction; LVOT, LV outflow tract; MPI, myocardial performance index. PM, pacemaker; pts, patients; RBBB, right
bundle branch block; RV, right ventricle; RV1, RV pre-activation; SR, sinus rhythm; TDI, tissue Doppler imaging; VTI, velocity–time integral.
a
The results indicate the distribution of the optimal V–V delay according to its corresponding pacing mode: LV1 , RV1, and BiV0 in terms of
the number of patients or percentage. All patients were in sinus rhythm unless indicated otherwise (AF).
Long-term stability of the optimal
V–V interval and clinical response
The optimal V–V delay may change with
the passage of time, and individual changes
cannot be accurately predicted. Detailed, regular
re-evaluations and reprogramming of optimal
parameters seem appropriate.
Boriani et al31 reported disappointing results
at the 6-month follow-up after V–V optimization. They selected patients at random and compared the results of CRT with simultaneous
biventricular pacing (n = 23) versus V–V optimized devices (n = 72) after a follow-up of
6 months. There were no differences in symptoms, quality of life, or functional capacity
between the two groups. These results are difficult to explain, but they may be related to the
selection of sicker patients (QRS у150 ms), the
lack of AV optimization after programming the
V–V interval, a change in the optimal V–V interval after 6 months, or progression of disease. In
this respect, O’Donnell et al33 studied 40 recipients of CRT devices. Optimized V–V delays
were determined according to echocardiographic criteria. There was a trend toward
reduction in the LV predominance of the optimal
9781841846378-Ch12
6/14/07
10:09 AM
Page 173
OPTIMIZATION OF THE INTERVENTRICULAR INTERVAL DURING CRT 173
V–V delay during follow-up. The mean optimal
V–V delay at implantation was 22 ms (range −12
to +32 ms) with the LV activated first, versus
12 ms (range −16 to +32 ms) at 9 months. These
observations are partially supported by the data
of Mortensen et al,25 who found that the optimal
V–V interval changed in 56% of CRT patients at
the 3-month follow-up.
V–V interval optimization on exercise
A recent study assessed the impact of sequential
biventricular
pacing
during
exercise.30
Simultaneous biventricular pacing was optimal
during exercise in only about 25% of patients
(Figure 12.7). Most of the improvement was
observed with short V–V delays, ranging from
12 to 20 ms. Optimized sequential biventricular
pacing offered substantial additional benefit
when considering the aortic VTI and mitral
regurgitation. Differences between resting and
exercise optimization were observed in more
than half of the patients. With future technological advances, separate automatic programming
between resting and exercise for V–V delay may
become possible by means of sensors or other
ways to control hemodynamics at rest and with
activity. Recent data from the same group suggest that the degree of LV dyssynchrony varies
with exercise and may diminish in some
patients.
Percentage of patients
30
25
Simultaneous
20
RV20
RV12
LV12
15
10
LV20
LV40
5
EFFECT OF V–V TIMING ON THE ECG OF
BIVENTRICULAR PACEMAKERS
The electrocardiographic (ECG) consequences of
temporally different RV and LV activation with
programmable V–V timing in the latest biventricular devices have not yet been studied in
detail. In the absence of anodal stimulation,
increasing the V–V interval gradually to 80 ms
(LV first) will progressively increase the duration of the paced QRS complex and alter its morphology, with a larger R wave in lead V1,
indicating more dominant LV depolarization.34
The varying QRS configuration in lead V1 with
different V–V intervals has not been correlated
with the hemodynamic response. Consequently,
at this, juncture it is unwise to attempt programming the optimal V–V interval according to the
height of the paced R wave in lead V1.
Anodal stimulation
RV anodal stimulation during biventricular
pacing interferes with a programmed V–V delay
(often programmed with the LV preceding the
RV) aimed at optimizing cardiac resynchronization. This interference occurs because RV anodal
capture causes simultaneous RV and LV activation (the V–V interval becomes zero). In the presence of anodal stimulation, the ECG morphology
and its duration will not change if the device
is programmed with V–V intervals of 80, 60,
and 40 ms (LV before RV). The delayed RV
cathodal output (80, 60, and 40 ms) then falls
in the myocardial refractory period initiated by
the preceding anodal stimulation. At V–V intervals р 20 ms, the paced QRS may change because
the short LV–RV interval prevents propagation
of activation from the site of RV anodal capture
in time to render the cathodal site refractory.34
Thus, the cathode also captures the RV and
contributes to RV depolarization, which then
takes place from two sites: RV anode and RV
cathode.34
0
Rest
Exercise
Figure 12.7 Optimal V–V delay at rest and during exercise.
RV20, RV lead pre-excitation 20 ms, etc.; LV12, LV lead preexcitation 12 ms, etc. (Reproduced from Bordachar P et al.
Am J Cardiol 2006;97:1622–5.30)
AUTOMATIC DEVICE-BASED OPTIMIZATION
OF THE V–V DELAY
St Jude Medical have recently introduced a
method whereby the programmer itself can
9781841846378-Ch12
6/14/07
10:10 AM
Page 174
174 CARDIAC RESYNCHRONIZATION THERAPY
60
y = 0.9841x + 1.4614
50
Max aortic VTI
r = 97.69%
40
30
20
10
n = 61 patients
0
0
10
20
30
40
50
60
Aortic VTI at IEGM VV (cm)
Figure 12.8 Comparison of the aortic velocity–time integral
with the corresponding value obtained from analysis of intracardiac electrograms (IEGM). (Reprinted from Heart Rhythm;
3(Suppl.)) Meine M, Min X, Paris M, et al. An intracardiac EGM
method for VV optimization during cardiac resynchronization
(Abstract). Pages S63–S64 (2006).36
determine and then program the V–V delay
automatically.35 This design was based on a study
involving 61 patients who received a St Jude
EPIC HF device, which used the ventricular
electrogram (IEGM) to obtain the optimal V–V
interval.36 Optimal V–V delays based on the
IEGM algorithm were compared with the optimal V–V interval obtained by the maximum aortic
VTI over seven V–V delays (20, 40, and 80 ms),
with both RV and LV leads pre-activated and
simultaneous biventricular pacing (Figure 12.8).
The maximum aortic VTI (22.1 ± 8.2 cm)
was equivalent to the IEGM aortic VTI values
(20.9 ± 8.3 cm) (concordance r = 0.98 and a
95% confidence lower limit of 97%; p<0.0001). In
36 patients, the differences between the IEGM
V–V delays and echo-optimal V–V delays were
within 20 ms.
The St Jude system consists of a sensed
followed by a paced determination (Figure 12.9):
1.
Intrinsic depolarization delay (sensing). For
optimization of the V–V delay, the algorithm first measures the intrinsic interventricular depolarization delay (∆) between the
RV and LV during atrial pacing or sensing
(Figure 12.8). From there, it assumes that the
Intrinsic interventricular
depolarization delay D
Difference of interventricular
conduction delay
e = IVCDLR − IVCDRL
R
RAp
RVs
Time
R
RVp
e
Time
LVs
Time
∆
IV delay
R
LVs
LVs
Interventricular
Time
IVCDRL
CALCULATION of
OPTIMAL V–V
V V INTERVAL
R
RVs
VVopt = 0.5 x (D + e)
Time
LVp
RVs
D is related to intrinsic depolarization
e is a correction term depending upon
the wavefront velocities
The factor of 0.5 is included since the
wavefronts should meet
halfway between RVp and LVp
Time
IVCDLR
Figure 12.9 Diagrammatic representation of the St Jude Medical system for optimizing the V–V interval. RAp, right atrial pacing
event; RVs, right ventricular sensed event; RVp, right ventricular paced event; LVs, left ventricular sensed event; LVp, left ventricular paced event; IVCDRL, right-to-left interventricular conduction delay; IVCDLR, left-to-right interventricular conduction delay;
∆, interventricular delay. See the text for details.
9781841846378-Ch12
6/14/07
10:10 AM
Page 175
OPTIMIZATION OF THE INTERVENTRICULAR INTERVAL DURING CRT 175
2.
ventricle that is detected latest will have to
be stimulated first (which makes sense).
Internally, the device assigns a ‘sign’ to the
measured ∆ (positive if LV has to be paced
first and negative in the case of RV first).
Interventricular conduction delays (pacing). After
measurement of the intrinsic depolarization,
the algorithm determines the RV-to-LV
and LV-to-RV conduction delays (IVCDRL
and IVCDLR, respectively) by pacing one ventricle and looking to the response in the
opposite ventricle. The difference between the
left-to-right and right-to-left interventricular
conduction delays is denoted by ε :
ε = IVCDLR − IVCDRL
3.
As ε is used as a correction term depending
on the wavefront velocity, its sign (plus or
minus) is important. Thus, if the conduction
is slower from the LV lead, ε will be positive.
Calculation of optimal V–V delay. Finally
the optimal V–V delay is determined as half
the sum of the intrinsic depolarization delay
and the interventricular conduction delay:
2.
3.
4.
5.
6.
7.
VVopt = 0.5 × (∆ + ε)
•
•
•
If ∆ is positive and ε positive, the sum is
positive and LV is first.
If ∆ is negative and ε negative, the sum is
negative and RV is first
If ∆ is positive and ε negative (or vice
versa), the sum can either be positive or
negative, depending on the relative
values of ∆ and ε. But, in any case, if the
sum is positive, LV will be first. If the sum
is negative, RV will be first.
The device knows what chamber to stimulate
first, because it takes the signs into account for
the calculation. It only expresses the results
using absolute values and mentioning what
chamber is paced first.
REFERENCES
1. Whinnett ZI, Davies JE, Willson K, et al. Haemodynamic
effects of changes in atrioventricular and interventricular
delay in cardiac resynchronisation therapy show a consistent pattern: analysis of shape, magnitude and relative
8.
9.
10.
11.
12.
importance of atrioventricular and interventricular
delay. Heart 2006;92:1628–34.
Burri H, Sunthorn H, Somsen A, et al. Optimizing
sequential biventricular pacing using radionuclide ventriculography. Heart Rhythm 2005;2:960–5.
Bax JJ, Abraham T, Barold SS, et al. Cardiac resynchronization therapy: Part 2 – Issues during and after device
implantation and unresolved questions. J Am Coll
Cardiol. 2005;46:2168–82.
Jansen AH, Bracke FA, van Dantzig JM, et al.
Correlation of echo-Doppler optimization of atrioventricular delay in cardiac resynchronization therapy with
invasive hemodynamics in patients with heart failure secondary to ischemic or idiopathic dilated cardiomyopathy.
Am J Cardiol 2006;97:552–7.
Bax JJ, Ansalone G, Breithardt OA, et al.
Echocardiographic evaluation of cardiac resynchronization therapy: ready for routine clinical use? A critical
appraisal. J Am Coll Cardiol 2004;44:1–9.
Breithardt OA, Stellbrink C, Franke A, et al. Pacing
Therapies for Congestive Heart Failure Study Group;
Guidant Congestive Heart Failure Research Group.
Acute effects of cardiac resynchronization therapy on left
ventricular Doppler indices in patients with congestive
heart failure. Am Heart J 2002;143:34–44.
Marcus GM, Rose E, Viloria EM, et al. VENTAK
CHF/CONTAK-CD Biventricular Pacing Study
Investigators. Septal to posterior wall motion delay fails
to predict reverse remodeling or clinical improvement in
patients undergoing cardiac resynchronization therapy.
J Am Coll Cardiol 2005;46:2208–14.
Yu CM, Zhang Q, Chan YS, et al. Tissue Doppler velocity is superior to displacement and strain mapping in
predicting left ventricular reverse remodelling response
after cardiac resynchronisation therapy. Heart 2006;
92:1452–6.
Yu CM, Wing-Hong Fung J, Zhang Q, Sanderson JE.
Understanding nonresponders of cardiac resynchronization therapy – current and future perspectives.
J Cardiovasc Electrophysiol 2005;16:1117–24.
Delfino JG, Bhasin M, Cole R, et al. Comparison of
myocardial velocities obtained with magnetic resonance phase velocity mapping and tissue Doppler
imaging in normal subjects and patients with left ventricular dyssynchrony. J Magn Reson Imaging 2006;
24:304–11.
Burri H, Lerch R. Echocardiography and patient selection for cardiac resynchronization therapy: a critical
appraisal. Heart Rhythm 2006;3:474–9.
Notabartolo D, Merlino JD, Smith AL, et al. Usefulness
of the peak velocity difference by tissue Doppler imaging technique as an effective predictor of response to
cardiac resynchronization therapy. Am J Cardiol
2004;94:817–20.
9781841846378-Ch12
6/14/07
10:10 AM
Page 176
176 CARDIAC RESYNCHRONIZATION THERAPY
13. Perego GB, Chianca R, Facchini M, et al. Simultaneous
vs. sequential biventricular pacing in dilated cardiomyopathy: an acute hemodynamic study. Eur J Heart Fail
2003;5:305–13.
14. Ramanathan C, Jia P, Ghanem R, Ryu K, Rudy Y.
Activation and repolarization of the normal human heart
under complete physiological conditions. Proc Natl
Acad Sci USA 2006;103:6309–14.
15. Wyndham CR, Meeran MK, Smith T, et al. Epicardial
activation of the intact human heart without conduction
defect. Circulation 1979;59:161–8.
16. Nelson GS, Curry CW, Wyman BT, et al. Predictors of
systolic augmentation from left ventricular preexcitation
in patients with dilated cardiomyopathy and intraventricular conduction delay. Circulation 2000;101: 2703–9.
17. Rodriguez LM, Timmermans C, Nabar A, Beatty G,
Wellens HJ. Variable patterns of septal activation in
patients with left bundle branch block and heart failure.
J Cardiovasc Electrophysiol 2003;14:135–41.
18. Fung JW, Yu CM, Yip G, et al. Variable left ventricular
activation pattern in patients with heart failure and left
bundle branch block. Heart 2004;90:17–19.
19. Auricchio A, Fantoni C, Regoli F, et al. Characterization
of left ventricular activation in patients with heart failure and left bundle-branch block. Circulation 2004;109:
1133–9.
20. Herweg B, Ilercil A, Madramootoo C, et al. Latency
during left ventricular pacing from the lateral cardiac
veins: a cause of ineffectual biventricular pacing. Pacing
Clin Electrophysiol 2006;29:574–81.
21. Sogaard P, Egeblad H, Pedersen AK, et al. Sequential
versus simultaneous biventricular resynchronization for
severe heart failure: evaluation by tissue Doppler imaging. Circulation 2002;106:2078–84.
22. Leon AR, Abraham WT, Brozena S, et al. InSync III
Clinical Study Investigators. Cardiac resynchronization
with sequential biventricular pacing for the treatment
of moderate-to-severe heart failure. J Am Coll Cardiol
2005;46:2298–304.
23. Hay I, Melenovsky V, Fetics BJ, et al. Short-term effects
of right-left heart sequential cardiac resynchronization
in patients with heart failure, chronic atrial fibrillation,
and atrioventricular nodal block. Circulation 2004;110:
3404–10.
24. van Gelder BM, Bracke FA, Meijer A, Lakerveld LJ,
Pijls NH. Effect of optimizing the VV interval on left
ventricular contractility in cardiac resynchronization
therapy. Am J Cardiol 2004;93:1500–3.
25. Mortensen PT, Sogaard P, Mansour H, et al. Sequential
biventricular pacing: evaluation of safety and efficacy.
Pacing Clin Electrophysiol 2004;27:339–45.
26. Kurzidim K, Reinke H, Sperzel J, et al. Invasive optimization of cardiac resynchronization therapy: role of
sequential ventricular and left ventricular pacing.
Pacing Clin Electrophysiol 2005;28:754–61.
27. Porciani MC, Dondina C, Macioce R, et al.
Echocardiographic examination of atrioventricular and
interventricular delay optimization in cardiac resynchronization therapy. Am J Cardiol 2005;95:1108–10.
28. Riedlbauchova L, Kautzner J, Fridl P. Influence of
different atrioventricular and interventricular delays
on cardiac output during cardiac resynchronization
therapy. Pacing Clin Electrophysiol 2005;28(Suppl 1):
S19–23.
29. Vanderheyden M, De Backer T, Rivero-Ayerza M, et al.
Tailored echocardiographic interventricular delay programming further optimizes left ventricular performance after cardiac resynchronization therapy. Heart
Rhythm 2005;2:1066–72.
30. Bordachar P, Lafitte S, Reuter S, et al. Echocardiographic
assessment during exercise of heart failure patients
with cardiac resynchronization therapy. Am J Cardiol
2006;97:1622–5.
31. Boriani G, Muller CP, Seidl KH, et al. Resynchronization
for the HemodYnamic Treatment for Heart Failure
Management II Investigators. Randomized comparison
of simultaneous biventricular stimulation versus
optimized interventricular delay in cardiac resynchronization therapy. The Resynchronization for the
HemodYnamic Treatment for Heart Failure Management
II Implantable Cardioverter Defibrillator (RHYTHM II
ICD) study. Am Heart J 2006;151:1050–8.
32. Kay GN. Troubleshooting and programming of
cardiac resynchronization therapy. In: Ellenbogen KA,
Kay GN, Wilkoff BL, eds. Device Therapy for
Congestive Heart Failure. Philadelphia: WB Saunders,
2004:232–93.
33. O’Donnell D, Nadurata V, Hamer A, Kertes P,
Mohammed W. Long-term variations in optimal programming of cardiac resynchronization therapy devices.
Pacing Clin Electrophysiol 2005;28(Suppl 1):S24–6.
34. van Gelder BM, Bracke FA, Meijer A. The effect of
anodal stimulation on V–V timing at varying V–V
intervals. Pacing Clin Electrophysiol 2005;28:771–6.
35. Analysis of QuickOptTM Timing Cycle Optimization.
An IEGM Method to Optimize AV, PV, and VV delays.
Sylmar, CA: St Jude Medical, 2006.
36. Meine M, Min X, Paris M, Park E. An intracardiac
EGM method for VV optimization during cardiac
resynchronization. Heart Rhythm 2006;3(Suppl):
S63–4 (abst).
9781841846378-Ch13
6/11/07
11:34 AM
Page 177
13
Complications of cardiac
resynchronization therapy
Christoph Stellbrink
Introduction • Complications associated with the implantation procedure • Complications
during chronic CRT • Summary
INTRODUCTION
With the increased use of cardiac resynchronization therapy (CRT) as a routine approach in the
management of patients with moderate to
advanced heart failure and ventricular conduction
delay, this therapy has spread from few investigational centers with long-term experience, high
implant volumes, and state-of-the art equipment
to smaller units that may have started implementing CRT only recently. One has to bear in mind
that the requirements for CRT are much higher
than for a regular pacemaker or implantable
cardioverter–defibrillator (ICD) service. This concerns the implantation setting as well as follow-up
procedures. Therefore, it is wise to be aware of the
potential complications and pitfalls of CRT before
setting up such a program at a specific center. This
chapter aims to give an overview of the available
data on CRT complications, combined with some
comments from individual experience.
The complications of CRT can be roughly
divided into those associated with the implantation procedure and those arising during chronic
therapy.
COMPLICATIONS ASSOCIATED WITH THE
IMPLANTATION PROCEDURE
General remarks
The risks associated with the implantation procedure may be classified as the general risks,
i.e., those associated with anesthesia, device
implantation (pacemaker or ICD), right-sided
lead placement, and defibrillation threshold
testing, and the specific risks of CRT, i.e., those
associated with left ventricular (LV) lead
implantation. A summary of the different risks is
shown in Table 13.1.
A complete discussion of the general risks of
the CRT implantation procedure lies beyond the
scope of this chapter. Although it has to be taken
into consideration that patients undergoing
implantation of a CRT device generally have a
higher perioperative risk than those undergoing
regular pacemaker or ICD implantation due to
the higher morbidity of the heart failure population, data from large series are reassuring that
the actual incidence of perioperative adverse
events is acceptable. In the largest published
series,1 the overall incidence of perioperative
complications was 13.8%, but only about half of
these could be attributed to coronary sinus intubation, LV lead implantation, or heart failure
decompensation, which may be regarded as specific complications of CRT. The perioperative
mortality rate in this series was only 0.4% and
the 30-day mortality rate 1.6%. Most patients
died from either sudden cardiac death or progressive heart failure. In addition, these data
include early experience from the MIRACLE,
MIRACLE ICD, and Insync III trials. The analysis showed that the complication rate was
already decreasing in the patients enrolled later
in the studies. Thus, with the current increase in
experience and the improved implantation tools
9781841846378-Ch13
6/11/07
11:34 AM
Page 178
178 CARDIAC RESYNCHRONIZATION THERAPY
Table 13.1 Risks associated with CRT device
implantation
General risks
Specific risks of CRT
Risks associated with
anesthesia
Allergic reaction
(contrast media)
General surgical risks:
Infection
Pneumothorax
Bleeding
Perforation
Risks associated with
defibrillation threshold
testing (only ICDs)
Transvenous LV lead
implantation:
Coronary sinus
dissection/perforation
Complete heart block
Contrast-induced renal
failure
Epicardial lead implantation
Pneumothorax
Need for thoracotomy
transseptal approach, or surgical epicardial
implantation via a limited left lateral thoracotomy. In clinical routine, the coronary venous
approach has become the preferred approach
and thus will be discussed here in greater detail.
The transseptal route cannot be recommended,
despite its technical feasibility,4 due to the potential long-term risk of systemic embolism associated with left endocardial leads.5 The surgical
approach, however, may be an alternative in the
rare patient with difficult coronary venous
anatomy or complete absence of a suitable
venous branch. Thus, this approach will be
briefly discussed at the end of this chapter.
Risks of coronary venous lead placement
that are available, the actual complication rate
may be considerably lower in large-volume
centers. It has to be pointed out, though, that
implantation of a resynchronization device
requires a higher level of pre-, intra-, and postoperative preparation and care than either standard
right-sided pacemaker or ICD implant procedures. Moreover, implantation should preferably
be performed using optimal angiographic settings such as are usually available in cardiac
catheterization laboratories, in order to improve
the implant success rate and to reduce implant
duration and radiation exposure to patients and
implanting personnel.2 The duration of the
implantation procedure is still in the range of
2.5 hours, but may be considerably longer in some
patients. The same applies to the fluoroscopy
time, which is in the range of 20–30 minutes in
most published series. It has to be considered
that the radiation exposure associated with CRT
device implantation is associated with a distinctly increased risk of fatal cancer.3 However,
many patients undergoing this procedure have a
limited life-expectancy in spite of the implanted
device, and thus the cancer risk may be a purely
theoretical consideration in clinical routine.
Specific complications of CRT implantation:
risks associated with LV lead placement
In principle, LV lead implantation may be performed via the coronary venous approach, the
There are risks associated with occlusion angiography of the coronary sinus. Coronary venous
implantation can be performed using an ‘overthe-wire’ lead or a stylet-driven lead. Regardless
of the lead used, it is advisable to perform a
coronary sinus angiography before implantation
in order to identify the most suitable vein for LV
pacing. It is also useful in order to visualize different side-branches in case of problems with
pacing threshold or phrenic nerve stimulation at
the initially desired pacing site. Non-invasive
imaging of the coronary sinus by multislice computed tomography (CT) has been proposed,6 but
this usually cannot replace coronary sinus
angiography, which may be performed by a
direct retrograde approach or an indirect
approach using the venous phase after contrast
injection into the left coronary artery.7 Although
indirect venography has the advantage that
injury to the coronary sinus can be avoided, it
requires arterial access and thus may be impractical in the operative setting. Moreover, in the
author’s view, direct retrograde coronary sinus
angiography usually allows better opacification
of the coronary venous vasculature, and thus
has become the method of choice in most centers. It requires intubation of the coronary sinus
with an angiography catheter. Contrast can be
injected directly through the catheter; this may
be associated with a lower incidence of coronary
sinus dissection,8 but has the disadvantage that
the blood flow directed against the injection
impedes optimal vessel visualization. Thus, the
9781841846378-Ch13
6/11/07
11:34 AM
Page 179
COMPLICATIONS OF CARDIAC RESYNCHRONIZATION THERAPY 179
author prefers transient balloon occlusion
angiography. This requires using a guiding
catheter (usually 8 French) through which a balloon angiography catheter is entered into the
posterior aspect of the coronary sinus. After
brief occlusion of the vessel by inflating the balloon, contrast medium is injected into the vessel
with gentle pressure, allowing visualization of
the coronary venous vessels. This technique is
superior to direct injection through the guiding
catheter, especially in cases when different veins
have to be tested and thus full visualization of all
the different ventricular branches of the coronary
sinus is important.
There are two major risks associated with
coronary venous angiography: contrast-induced
nephropathy and coronary venous dissection.
Many patients with heart failure have
enlarged atria, which may make intubation of
the coronary sinus with a guiding catheter
sometimes difficult, requiring high amounts of
contrast medium. At the same time, some preexisting renal insufficiency is often present and
patients may be dehydrated by treatment with
diuretics. If too much contrast medium are used
without adequate preparation of the patient,
renal function may deteriorate or even acute
renal failure may result. There are no published
data on the incidence of renal failure after coronary sinus angiography. Nevertheless, it is
advisable that patients should be adequately
hydrated throughout the implantation procedure and possibly pretreated with acetylcysteine; renal function and urine output should be
closely monitored after the operation if large
amounts of contrast were necessary for LV lead
deployment.
Introduction of the guiding catheter into the
coronary sinus ostium is sometimes difficult,
and too vigorous manipulation with the guiding
catheter or the balloon catheter can cause venous
dissection (Figure 13.1). This complication can
also be caused by too vigorous contrast injection
distal to the occluded balloon. Injury to the coronary sinus and its tributaries is much less commonly caused by the guidewire or the pacing
lead itself. The incidence of venous dissection is
in the range 2–3.5%.9,10 Fortunately, coronary
sinus dissection usually heals well and pericardial tamponade is a rare exception (its incidence
*
Figure 13.1 Coronary sinus angiography in the 30° left anterior oblique view in a patient with ischemic cardiomyopathy
and a previously implanted pacemaker lead (*). The vessel
has been lacerated at the posterolateral aspect, and contrast
injection into the proximal coronary sinus shows a contrast
deposit adjacent to the vessel (arrow). The patient developed
a minor pericardial effusion after the angiography, without any
hemodynamic consequences. Upgrading of the pacemaker to
a biventricular ICD could be performed successfully without
complications 2 weeks later, after complete resolution of the
pericardial effusion.
is 0.4–0.9%).1,10 Nevertheless, it seems prudent to
stop the implantation procedure if a severe coronary sinus dissection is noted and defer the
procedure for 2–4 weeks, when the injury is usually healed. Echocardiographic monitoring is
mandatory to exclude a hemodynamically relevant pericardial effusion.
Catheter or lead manipulation at the right
ventricular (RV) septum can lead to transient
mechanical right bundle branch block (RBBB).
Since most CRT candidates have pre-existing
left bundle branch block (LBBB), complete atrioventricular (AV) block may ensue. This complication occurs at an incidence of <1%,10 but
may occasionally lead to an emergency situation if no adequate escape rhythm is present. In
the author’s experience, complete AV block is
most often induced during placement of the
coronary sinus guiding catheter. It can thus be
9781841846378-Ch13
6/11/07
11:34 AM
Page 180
180 CARDIAC RESYNCHRONIZATION THERAPY
easily avoided by placing the RV lead before
entering the coronary sinus, which allows
immediate RV pacing should complete conduction block occur.
Risks of direct surgical epicardial
implantation of the LV lead
as disease progression or arrhythmias. The overall
incidence of chronic complications within the
first 6 months after implantation in the largest
published series was 10.6%.1 Most complications
were lead-related (7.9%), and of these, the majority
concerned the LV lead.
Lead-related complications
Several approaches for direct epicardial lead
implantation have been proposed, such as implantation by a limited left lateral thoracotomy,11 thoracoscopic implantation,12 or robotic assistance.13 It is
most important when using the surgical approach
to realize that leads need to be placed in a lateral or
even posterior position, as more anterior lead positions may lead to a suboptimal hemodynamic
response to CRT.14 The incidence of lead revisions
is smaller than with the coronary venous
approach, but the initial hospitalization is longer
due to the prolonged recovery of the patient.14
In addition, in about 7% of patients, the operative
approach has to be extendend to a full thoracotomy because of an inability to place the leads in an
adequate position with the limited surgical
access.15 Thus, epicardial lead implantation is usually reserved for those cases where coronary
venous implantation is not feasible due to unsatisfactory coronary venous anatomy.
The incidence of coronary sinus lead dislodgement
in large CRT series is in the range 4.0–13.6%.1,16
Most dislodgements occur early (i.e., within the
first weeks after implantation). With newer lead
designs, which usually have some passive fixation mechanisms (Figure 13.2), the incidence
may be lower, but long-term data on these leads
are not yet available. A dislodged LV lead may
potentially prolapse into the RV and cause
ventricular arrhythmias, or induce atrial fibrillation if it is floating in the right atrium (RA).
Moreover, due to the loss of synchronization,
cardiac decompensation may be precipitated.
Dislodged coronary sinus leads should be surgically removed and a new lead placed. Removal
of coronary sinus leads is usually safe,17 but surgical stand-by should be available.
COMPLICATIONS DURING CHRONIC CRT
Phrenic nerve stimulation
As for the perioperative risks, the chronic risks
of CRT can be divided into the general risks of
pacemaker/ICD therapy and those specific to
CRT (Table 13.2). This chapter focuses on the
specific complications that are caused by CRT
itself or the potential influence of the triple-lead
device on ICD detection or therapy delivery. The
complications may be lead-related, devicerelated, or caused by patient-specific events such
The left phrenic nerve can be located close to the
(postero)lateral branch, which is usually the
desired LV pacing site.18 Therefore, the phrenic
nerve threshold must always be tested during
lead implantation, in addition to local sensing
and ventricular pacing threshold. Every effort
should be made to find a pacing site with an
adequate LV pacing threshold (<2.0 V) where
the phrenic nerve is not captured at maximal
device output. However, if this is not possible,
the phrenic nerve threshold should at least be
significantly higher than twice the LV pacing
threshold. If the difference between the two
thresholds is too small, diaphragmatic stimulation may make CRT deployment impossible.
This is not a rare occurrence, since some chronic
increase in ventricular pacing threshold is often
observed and the phrenic nerve threshold may
vary depending on the heart axis change with
Table 13.2 Risks associated with chronic CRT
General risks
Specific risks of CRT
Lead dislocation
Pocket or lead infection
Arrhythmias
Loss of LV lead pacing capture
Phrenic nerve stimulation
Heart failure decompensation
Lead dislodgement
9781841846378-Ch13
6/11/07
11:34 AM
Page 181
COMPLICATIONS OF CARDIAC RESYNCHRONIZATION THERAPY 181
(a)
(b)
(c)
(d)
Figure 13.2 Coronary sinus leads with different fixation mechanisms. (a) Corox lead (BIOTRONIK, Berlin, Germany), using a helix
for passive fixation. (b) Attain StarFix lead (Medtronic, Minneapolis, USA) with deployable lobes. (c) Endotak Reliance lead
(Guidant, St Paul, USA) with active (screw) or passive (anchor) fixation. (d) Aescula lead (St Jude Medical, St Paul, USA), with a
helix for passive fixation.
body position. The use of bipolar leads can be
useful in reducing the incidence of phrenic nerve
stimulation, as it offers the chance to test different
pacing configurations, for example, bipolar
stimulation between both coronary sinus poles
or stimulation between the distal or proximal
coronary sinus pole and a RV electrode. The incidence of diaphragmatic stimulation in larger
series is 1.2–3%.1,10 If it occurs after device
implantation, it can sometimes be handled by
reprogramming output or the pacing configuration, but lead revision is frequently necessary if
the patient complains of intolerable hiccups.
have been described in case reports. These
include pacemaker-mediated tachycardia between
the two ventricular electrodes19 and double-sensing of RV and LV activation leading to inappropriate sensing of ventricular tachycardia and
thus delivery of inadequate shocks.20 The latter
occurred only in first-generation devices – newer
devices use only the RV signal for tachycardia
detection. Loss of capture by the LV electrode
may lead to lack of resynchronization and thus
progressive heart failure. Loss of capture of the
LV electrode may only be recognized by careful
analysis of the paced QRS complex, for which
specific algorithms have been proposed.21
Device-related complications
Device-related complications can be further classified into complications caused by delivery of
resynchronization pacing therapy and those
caused by inadequate tachycardia sensing or
therapy. Apart from the well-known complications of pacemaker and defibrillator therapy,
specific complications of biventricular devices
Patient-related complications
Arrhythmia-related complications
Atrial fibrillation is common in patients with
advanced heart failure. It may lead to precipitation of acute heart failure decompensation
caused by three mechanisms: (1) loss of the atrial
9781841846378-Ch13
6/11/07
11:34 AM
Page 182
182 CARDIAC RESYNCHRONIZATION THERAPY
contribution to stroke volume; (2) impaired diastolic filling if rapid conduction to the ventricles
occurs; (3) the irregularity in itself leading to
variation in ventricular filling and contractility.22
In CRT patients, a fourth very important pathophysiological mechanism is operative, namely,
loss of the atrial-sensed event triggering the
resynchronizing biventricular stimulus. This can
lead to partial or complete inhibition of CRT
delivery. Therefore, rapid clinical deterioration
is common in CRT patients when atrial fibrillation occurs, and thus should be treated as an
emergency. Cardioversion can be performed
under conscious sedation either by applying a
commanded device shock or by external cardioversion. Should the patient not be under
adequate anticoagulation, transesophageal cardioversion can be used to rule out left atrial (LA)
thrombi if the patient is hemodynamically stable
and the arrhythmia is present for more than
48 hours.
Ventricular tachycardia (VT) or ventricular
fibrillation clusters have been described in CRT
patients.23,24 An increased transmural dispersion
of repolarization has been discussed as a potential
mechanism for proarrhythmia.25,26 Alternatively,
increased occurrence of arrhythmia may simply
reflect progression of a previously existing
arrhythmogenic substrate. In these cases, antiarrhythmic drug treatment may reduce the incidence and rate of VT events. Amiodarone is
preferred because of its efficacy and lack of negative inotropy, but sometimes even class I drugs
may be necessary for rhythm stabilization. The
negative inotropic effect of these drugs, however, limits their applicability, and they should
never be used in a patient with a CRT device
without defibrillation capability because of their
proarrhythmic potential in heart failure.
Radiofrequency ablation may be an attractive
alternative, especially in the case of incessant
monomorphic VT.
SUMMARY
CRT has emerged as an increasingly accepted
approach to the treatment of advanced heart
failure with ventricular dyssynchrony. This new
therapy has not only broadened our understanding of the heart failure syndrome and added a
completely new therapeutic option (i.e., electrical therapy) to the treatment of heart failure
patients, but it has also introduced some new,
specific complications that need the physician’s
consideration when implementing CRT in practice. Complications are mostly related to the
implantation procedure and LV stimulation.
Moreover, the high baseline morbidity of
patients undergoing CRT has to be taken into
account. Nevertheless, after adequate training
and using an integrated approach involving the
heart failure specialist, the electrophysiologist,
and the cardiac surgeon, electrical therapy offers
great benefit to those patients for whom it is
indicated.
REFERENCES
1. Leon AR, Abraham WT, Curtis AB, et al. MIRACLE
Study Program. Safety of transvenous cardiac resynchronization system implantation in patients with chronic
heart failure: combined results of over 2000 patients from
a multicenter study program. J Am Coll Cardiol
2005;46:2348–56.
2. Stellbrink C, Auricchio A, Lemke B, et al. Policy paper to
the cardiac resynchronization therapy. Z Kardiol
2003;92:96–103.
3. Perisinakis K, Theocharopoulos N, Damilakis J, et al.
Fluoroscopically guided implantation of modern cardiac
resynchronization devices: radiation burden to the
patient and associated risks. J Am Coll Cardiol
2005;46:2335–9.
4. Leclercq F, Hager FX, Macia JC, et al. Left ventricular
lead insertion using a modified transseptal catheterization technique: a totally endocardial approach for permanent biventricular pacing in end-stage heart failure.
Pacing Clin Electrophysiol 1999;22:1570–5.
5. Jais P, Takahashi A, Garrigue S, et al. Mid-term followup of endocardial biventricular pacing. Pacing Clin
Electrophysiol 2000;23:1744–7.
6. Jongbloed MR, Lamb HJ, Bax JJ, et al. Noninvasive visualization of the cardiac venous system using multislice
computed tomography. J Am Coll Cardiol 2005;
45:749–53.
7. Mischke K, Knackstedt C, Muhlenbruch G, et al. Imaging
of the coronary venous system: retrograde coronary
sinus angiography versus venous phase coronary
angiograms. Int J Cardiol 2006 Oct 23; [Epub ahead of
print].
8. De Martino G, Messano L, Santamaria M, et al. A randomized evaluation of different approaches to coronary
sinus venography during biventricular pacemaker
implants. Europace 2005;7:73–6.
9781841846378-Ch13
6/11/07
11:34 AM
Page 183
COMPLICATIONS OF CARDIAC RESYNCHRONIZATION THERAPY 183
9. Higgins SL, Hummel JD, Niazi IK, et al. Cardiac resynchronization therapy for the treatment of heart failure
in patients with intraventricular conduction delay and
malignant ventricular tachyarrhythmias. J Am Coll
Cardiol 2003;42:1454–9.
10. Young JB, Abraham WT, Smith AL, et al. Multicenter
InSync ICD Randomized Clinical Evaluation (MIRACLE ICD) Trial Investigators. Combined cardiac
resynchronization and implantable cardioversion
defibrillation in advanced chronic heart failure: the
MIRACLE ICD trial. JAMA 2003;289:2685–94.
11. Izutani H, Quan KJ, Biblo LA, Gill IS. Biventricular
pacing for congestive heart failure: early experience in
surgical epicardial versus coronary sinus lead placement.
Heart Surg Forum 2002;6:E1–6.
12. Gabor S, Prenner G, Wasler A, et al. A simplified technique for implantation of left ventricular epicardial
leads for biventricular resynchronization using videoassisted thoracoscopy (VATS). Eur J Cardiothorac Surg
2005;28:797–800.
13. Derose JJ Jr, Belsley S, Swistel DG, Shaw R, Ashton RC
Jr. Robotically assisted left ventricular epicardial lead
implantation for biventricular pacing: the posterior
approach. Ann Thorac Surg 2004;77:1472–4.
14. Koos R, Sinha AM, Markus K, et al. Comparison of left
ventricular lead placement via the coronary venous
approach versus lateral thoracotomy in patients receiving
cardiac resynchronization therapy. Am J Cardiol
2004;94:59–63.
15. Mair H, Jansens JL, Lattouf OM, Reichart B, Dabritz S.
Epicardial lead implantation techniques for biventricular pacing via left lateral mini-thoracotomy, videoassisted thoracoscopy, and robotic approach. Heart
Surg Forum 2003;6:412–17.
16. Cazeau S, Leclercq C, Lavergne T, et al. Multisite
Stimulation in Cardiomyopathies (MUSTIC) Study
Investigators. Effects of multisite biventricular pacing
in patients with heart failure and intraventricular conduction delay. N Engl J Med 2001;344:873–80.
17. De Martino G, Orazi S, Bisignani G, et al. Safety and
feasibility of coronary sinus left ventricular leads
18.
19.
20.
21.
22.
23.
24.
25.
26.
extraction: a preliminary report. J Interv Card
Electrophysiol 2005;13:35–8.
Butter C, Auricchio A, Stellbrink C, et al. Pacing
Therapy for Chronic Heart Failure II Study Group.
Effect of resynchronization therapy stimulation site
on the systolic function of heart failure patients.
Circulation 2001;104:3026–9.
Berruezo A, Mont L, Scalise A, Brugada J. Orthodromic
pacemaker-mediated tachycardia in a biventricular
system without an atrial electrode. J Cardiovasc
Electrophysiol 2004;15:1100–2.
Schreieck J, Zrenner B, Kolb C, Ndrepepa G, Schmitt C.
Inappropriate shock delivery due to ventricular double
detection with a biventricular pacing implantable
cardioverter defibrillator. Pacing Clin Electrophysiol
2001;24:1154–7.
Ammann P, Sticherling C, Kalusche D, et al. An electrocardiogram-based algorithm to detect loss of left ventricular capture during cardiac resynchronization
therapy. Ann Intern Med 2005;142:968–73.
Melenovsky V, Hay I, Fetics BJ, et al. Functional impact
of rate irregularity in patients with heart failure and
atrial fibrillation receiving cardiac resynchronization
therapy. Eur Heart J 2005;26:705–11.
Shukla G, Chaudhry GM, Orlov M, Hoffmeister P,
Haffajee C. Potential proarrhythmic effect of biventricular pacing: fact or myth? Heart Rhythm 2005;
2:951–6.
Guerra J, Wu J, Miller J, Groh W. Increase in ventricular
tachycardia frequency, after biventricular implantable
cardioverter defibrillator upgrade. J Cardiovasc
Electrophysiol 2003;14:1245–7.
Fish JM, Di Diego JM, Nesterenko V, Antzelevitch C.
Epicardial activation of left ventricular wall prolongs
QT interval and transmural dispersion of repolarization: implications for biventricular pacing. Circulation
2004;109:2136–42.
Medina-Ravell N, Lankipali R, Yan G, et al. Effect of
epicardial or biventricular pacing to prolong QT interval
and increase transmural dispersion of repolarization.
Circulation 2003;7:740–6.
9781841846378-Ch13
6/11/07
11:34 AM
Page 184
9781841846378-Ch14
6/13/07
6:48 PM
Page 185
14
Non-responders and patient selection from
an electrophysiological perspective
Ignacio García-Bolao and Alfonso Macías
Introduction • Inclusion criteria for CRT trials • Clinical significance of QRS duration in
patients with heart failure • QRS duration and mechanical dyssynchrony • QRS duration
and the response to CRT • Ventricular activation patterns in patients with LBBB and heart failure
• Electrical and mechanical dyssynchrony • Conclusions
INTRODUCTION
Electrophysiological disturbances are a common
finding in advanced heart failure.1 In addition to
abnormalities in cardiac muscle contraction
(mainly dependent on the severity of the underlying myocardial disease), abnormal electrical
conduction delays the timing of atrial contraction and generates discoordinate contraction of
the left ventricle (LV), which further impairs the
hemodynamic performance of the failing heart.
Both abnormal electrophysiological timing and
contractile discoordination can be offset by cardiac resynchronization therapy (CRT) through
the use of atrial-synchronized biventricular
pacing. Although QRS duration is not a direct
marker of mechanical dyssynchrony, CRT has
been shown to reduce morbidity and mortality
in patients with ventricular dyssynchrony
selected almost exclusively on the basis of a prolonged QRS width.2–11
As initially proposed, CRT is based on the
original and logical (but probably oversimplified) theory that synchronous biventricular
pacing and LV free-wall pre-excitation are able
to reduce the interventricular delay caused by
left bundle branch block (LBBB) and to counterbalance the delay of activation of the LV free
wall. However, even the general assumption that biventricular or LV pacing is effective
in removing the electrical component of
the electromechanical delay is still under evaluation. Although the clinical results of CRT
are promising – analysis of individual responses
has revealed that almost 30% of patients do not
exhibit any symptomatic or hemodynamic
improvement: the so-called ‘non-responders.’
Current data indicate that the problem of nonresponse is multifactorial and not only related
to the parameters of dyssynchrony (i.e., electrical vs mechanical) used for patient selection.
However, and in order to improve clinical
outcomes, investigators are seeking new markers of dyssynchrony that can prospectively
identify the patients who are more likely to
respond.12,13
This chapter aims at summarizing our understanding about the problem of non-response to
CRT from an electrical perspective, to discuss
the strengths and weakness of the QRS width as
an index of dyssynchrony, and to go deeply into
the relationship between electrical and mechanical
dyssynchrony.
INCLUSION CRITERIA FOR CRT TRIALS
The weight of evidence supporting the beneficial
effects of CRT in large prospective trials is now
firmly established, with more than 4000 patients
9781841846378-Ch14
6/13/07
6:48 PM
Page 186
186 CARDIAC RESYNCHRONIZATION THERAPY
evaluated in randomized single- or doubleblinded controlled trials. In these pivotal clinical
trials,2–11 CRT has been demonstrated unequivocally to improve functional status, quality of life
and LV systolic performance and to reduce
hospitalization and mortality. Patients were
selected on the basis of three main well-known
criteria: refractory heart failure with impaired
functional status (New York Heart Association
(NYHA) class III or IV), reduced LV ejection
fraction (LVEF) (<0.36), and prolonged QRS
duration (>130–150 ms) on the surface electrocardiogram (ECG) (Table 14.1). The last of these
was considered a surrogate marker of underlying dyssynchrony. Only the CARE-HF (Cardiac
Resynchronization in Heart Failure) study
included echocardiographic enrolment criteria.
In this study, 92 patients (11% of the total
included population) with intermediate QRS
(120–150 ms) and echocardiographic indicators
of dyssynchrony were included.11 However, the
results of this subgroup analysis have not yet
been published.
Based on the inclusion criteria of these landmark trials, recent international guidelines for
the treatment of heart failure recommend CRT
on the basis of a wide QRS complex as the key
element for identifying the presence of a
mechanical dyssynchrony potentially correctable by atrio-biventricular pacing.14,15
CLINICAL SIGNIFICANCE OF QRS DURATION IN
PATIENTS WITH HEART FAILURE
In the general population, increasing ECG QRS
duration is positively related to LV mass and
dimensions and inversely associated with systolic performance.1,16 Prolongation of QRS
beyond 120 ms occurs in 20–47% of patients with
heart failure.17,18 Among the different forms of
intraventricular conduction disturbances, typical LBBB is far more common than right bundle
branch block (RBBB) in this population (25–36%
vs 4–6%, respectively).1 In heart failure patients,
prolongation of QRS is a significant predictor of
LV dysfunction, and an inverse correlation exists
between QRS duration and LVEF.19
Not only the LVEF but also the clinical status
shows a correlation with the width of the QRS
complex. For example, in the Framingham
cohort, longer ECG QRS was associated with an
increased risk of developing congestive heart
failure.20 In another study,21 the incidence of
QRS prolongation increased from 10% to 53%
when patients moved from NYHA functional
class I to class III.
Patients with heart failure and QRS prolongation have a poorer prognosis than those with
narrow QRS. Shamim et al22 have shown that
intraventricular conduction delay is the most
powerful predictor amongst the simple ECG
Table 14.1 Dyssynchrony criteria of randomized controlled trials of cardiac resynchronization
Trial
Design
MUSTIC2
MUSTIC AF3
PATH CHF4
PATH CHF II5
MIRACLE6
MIRACLE ICD7
CONTAK-CD8
MIRACLE ICD II9
COMPANION10
CARE-HF 11
Crossover
Intrapatient
Crossover
Crossover
Parallel
Parallel
Parallel
Parallel
Parallel
Open-label,
randomized
NA, not applicable; ND, no data.
n
58
41
41
86
453
555
490
186
1520
814
Dyssynchrony QRS
criteria (ms)
QRS > 150
QRS > 200
QRS ജ 120
QRS ജ 120
QRS ജ 130
QRS ജ 130
QRS ജ 120
QRS ജ 130
QRS ജ 120
QRS 120–149 + Echo
QRS > 150
Mean QRS
at entry (ms)
176±19
207±17
174±30
163±25
165±20
162±22
164±27
165±23
160
160
LBBB (%)
87
NA
87
88
ND
77
54
90
70
ND
9781841846378-Ch14
6/13/07
6:48 PM
Page 187
NON-RESPONDERS AND PATIENT SELECTION FROM AN ELECTROPHYSIOLOGICAL PERSPECTIVE 187
parameters in patients with heart failure.
They demonstrated that QRS <120 ms, QRS of
120–160 ms, and QRS >160 ms correlated with a
mortality rate at 36 months of 20%, 36%, and
58% respectively. In a cohort of patients with
heart failure it was estimated that the presence
of LBBB was associated with a 60–70% higher
risk of all-cause mortality.23
In summary, left-sided intraventricular conduction delay is unequivocally associated with
more advanced myocardial disease, worse LV
systolic performance, and poorer prognosis
compared with a normal QRS complex. Whether
QRS prolongation simply represents a marker of
greater disease severity or there is a cause–effect
relationship between the mechanical effects of
intraventricular conduction defects and the
severity and progression of heart failure remains
to be elucidated.
QRS DURATION AND MECHANICAL
DYSSYNCHRONY
CRT was originally conceived and developed on
the basis of the premise that in patients with
heart failure and disturbed electrical activation
(particularly those with LBBB pattern and prolongation of the PR interval), depolarization of the
LV free wall is significantly delayed compared
with that of the right ventricle (RV) (interventricular dyssynchrony) and the interventricular
septum (intraventricular dyssynchrony). These
electrical disturbances result in discoordinate
contraction, with paradoxical septal wall motion
and reduction of LV contractility, which further
impair the systolic function of an already spoiled
ventricle. In addition, a prolonged atrioventricular (AV) delay can promote presystolic mitral
regurgitation and inadequate LV filling. In this situation, synchronous atrio-biventricular pacing
with LV free-wall pre-excitation should be able to
reduce the interventricular delay caused by
LBBB, to counterbalance the delay of activation of
the LV free wall, and to correct the abnormal AV
timing and hence to minimize their mechanical
consequences.24
Observational echocardiographic studies
have clearly demonstrated that the presence of
left intraventricular mechanical dyssynchrony is
the most important factor determining a positive
response to CRT, while interventricular and AV
dyssynchrony appear to be of less importance.25
However, the correlation between QRS width
and mechanical dyssynchrony is a long way
from being exact.
Interventricular dyssynchrony and
QRS prolongation
Some studies have shown that QRS duration is a
more accurate reflection of interventricular
(left–right) mechanical dyssynchrony than of
intraventricular dyssynchrony. In fact, three
studies17,26,27 have demonstrated a good correlation between interventricular dyssynchrony and
QRS duration (Table 14.2). These studies have
Table 14.2 Prevalence of dyssynchrony in heart failure patients according to QRS duration
Prevalence of dyssynchrony (%)
Study
Bader et al17
Ghio et al26
Rouleau et al27
Bleeker et al28
Yu et al29
Bleeker et al30
n
104
158
35
90
112
64
QRS<120 ms
QRS 120–150 ms
InterV
IntraV
InterV
12
13
18
—
—
5
56
30
—
27
43–51
33
34
52
44
—
—
—
IntraV
84
57
—
60
64–73
—
QRS>150 ms
InterV
IntraV
46
72
100
—
—
—
InterV, interventricular dyssynchrony; IntraV, intraventricular dyssynchrony; NS, not significant.
89
71
—
70
—
—
Correlation with QRS
InterV
r = 0.43; p < 0.05
r = 0.66; p < 0.001
r = 0.86; p < 0.001
—
—
NS
IntraV
NS
NS
—
NS
NS
NS
9781841846378-Ch14
6/13/07
6:48 PM
Page 188
188 CARDIAC RESYNCHRONIZATION THERAPY
shown that the prevalence of interventricular
dyssynchrony in heart failure patients with QRS
> 150 ms ranges from 46%17 to 100%,26 while it is
absent in more than three-quarters of patients
with QRS < 120 ms. Bleeker et al28 showed that
while intraventricular dyssynchrony was present in 33% of patients with heart failure and QRS
< 120 ms, the prevalence of interventricular dyssynchrony was only 5%.
This acceptable correlation between interventricular dyssynchrony and QRS duration is quite
consistent with the electrical activation pattern
of patients with LBBB and heart failure: as we
will see later, the most constant (although not
universal) activation pattern in this population
is the preservation of RV activation coexisting
with slow transseptal conduction.
Intraventricular dyssynchrony and
QRS prolongation
Unlike interventricular dyssynchrony, mechanical intraventricular dyssynchrony seems to correlate poorly with QRS duration (Table 14.2)
Bleeker et al28 studied the relationship between
LV dyssynchrony and QRS duration in 90 patients
with advanced heart failure. Patients were categorized according to QRS width as narrow (QRS
< 120 ms), intermediate (QRS 120–150 ms), and
wide (QRS > 150 ms) QRS complex. The authors
reported that 27% of patients with ‘narrow’ QRS
showed significant LV dyssynchrony, while 30%
of patients with ‘wide’ QRS (mainly LBBB) did
not exhibit LV dyssynchrony. In this study, there
was no significant relationship between QRS
duration and intraventricular dyssynchrony in the
whole group, while a weak relation was found
between these two parameters in patients with
idiopathic cardiomyopathy. Other authors,17,26,28–30
using various echocardiographic parameters,
have demonstrated that intraventricular dyssynchrony is absent in around one-third of patients
with an intermediate or wide QRS, and conversely present in a relatively high percentage of
patients (27–56%) with normal QRS duration.
Taken together, these studies suggest that
there is a group of patients (around 30%) who
meet conventional electrical dyssynchrony criteria (i.e., QRS width) but do not have mechanical
dyssynchrony. However, the assumption that
this 30% might partially explain the similar percentage of non-responders in the randomized
trials has not been prospectively validated in
randomized studies to date. Conversely, it is
estimated that perhaps 20–30% of heart failure
patients with QRS <130 ms have mechanical dyssynchrony. Again – and although this population is a potential target for CRT – extending the
indication to patients with narrow QRS based on
mechanical parameters of dyssynchrony is currently based only on data arising from observational and non-randomized studies.
QRS DURATION AND THE RESPONSE TO CRT
Baseline QRS duration
Although Kass et al31 and Auricchio et al32 found
that a QRS > 150 ms was predictive of acute
hemodynamic improvement, baseline QRS
duration has consistently failed to predict a
chronic clinical positive response to CRT. Only
data from the PATH-CHF (Pacing Therapies in
Congestive Heart Failure) II trial suggested that
the clinical benefit of CRT, assessed by peak
oxygen consumption, was more pronounced in
(but not confined to) patients with QRS >150 ms
when compared with patients with QRS of
120–150 ms.5 In this study, 38% of individuals
with QRS <150 ms had increased peak oxygen
consumption by more than 1 ml/min/kg with
LV pacing. However, other studies have consistently failed to demonstrate the value of the
baseline QRS duration in predicting a positive
response to CRT.33–34
These data suggest that there is a weak correlation between basal QRS duration and positive
response, but with a very poor predictive value
for identifying responders versus non-responders.
Change of QRS duration after CRT
One aspect that continues to be somewhat controversial is whether QRS narrowing after CRT
can be used to indicate treatment efficacy. A
hypothetical reduction in QRS duration produced by biventricular stimulation should represent the quality of electrical resynchronization
and indirectly reflect the degree of correction of
electromechanical abnormalities.
9781841846378-Ch14
6/13/07
6:48 PM
Page 189
NON-RESPONDERS AND PATIENT SELECTION FROM AN ELECTROPHYSIOLOGICAL PERSPECTIVE 189
An acute echocardiographic study showed
that the decrease in QRS duration was correlated
with a decrease in systolic volume.35 Shortening
of QRS following CRT differs significantly
between responders and non-responders in a
number of chronic studies. For example,
Molhoek et al36 analyzed the value of QRS shortening as a marker of a positive clinical response
to CRT. Their study included 61 patients, with a
reported nonresponse of 26%. While baseline
QRS duration was similar between responders
and nonresponders, a significant shortening in
QRS duration was observed only in responder
patients after 6 months. A reduction in QRS
>10 ms had a high sensitivity (73%), but a low
specificity (44%) for the prediction of a positive
response. Conversely, a reduction in QRS
>50 ms showed a high specificity but with a low
sensitivity (18%) to predict response to CRT
(Figure 14.1). This finding was mirrored by a
study reported by Lecoq et al,37 which showed
retrospectively that the degree of QRS shortening was the only independent predictor of positive response after multivariate adjustement in a
series of 139 patients. At 6 months, the mean
QRS shortening associated with CRT when
100
Specificity/sensitivity
75
Specificity
50
Sensitivity
25
0
0
20
40
60
80
100
Change in QRS (ms)
Figure 14.1 Specificity and sensitivity of the changes in QRS
duration after CRT in predicting a positive response to CRT.
(Adapted from Molhoek SG, Bax JJ, Van Erven L, et al. QRS
duration and shortening to predict clinical response to cardiac
resynchronization therapy in patients with end-stage heart
failure. Pacing Clin Electrophysiol 2004;27:308–13.36)
compared with baseline was significantly
greater (p < 0.001) among the responder patients
(37 ms) when compared with nonresponders
(11 ms). It should be noted that in this study,
the RV implantation site was selected on a
patient-to-patient basis, trying to reach the
shortest QRS duration during biventricular
pacing, which is not a routine implantation
practice.
However, other studies did not replicate this
finding, and reached different conclusions.32,33,36,38
In daily practice, it is very common to see cases
in which the QRS actually lengthens or remain
unchanged despite substantial clinical improvement. Furthermore, with epicardial LV pacing,
there is an obvious discrepancy between
changes is QRS duration after CRT and hemodynamic and clinical improvement.
Nevertheless, it is important to point out that,
as with any intra- or postoperative criteria, this
parameter should not be considered as a classical
predictor but rather as a marker of positive
response.
VENTRICULAR ACTIVATION PATTERNS IN
PATIENTS WITH LBBB AND HEART FAILURE
Correcting the mechanical problem arising from
abnormal electrical conduction delays, particularly LBBB, by modifying electrical activation of
the ventricles presupposes a good understanding of the propagation of electrical impulses in
this condition.
While in the normal ventricle the spread of
ventricular electrical activation is uniform and
occurs within 40 ms through the Purkinje network, intraventricular conduction disturbances
impair the velocity and direction of electrical
propagation. In addition, abnormalities found
in the damaged myocardium of heart failure
patients, such as scar tissue, ischemia, or interstitial fibrosis with rearrangement of extracellular matrix and myocytes, can further alter the
local activation and the specific pattern of LV
activation.
Classically, it has been considered that electrical impulse propagation in patients with lone
LBBB without heart disease starts in the RV,
through the intact right bundle, and then proceeds
to the LV, which is depolarized transseptally from