Ebook Modelling optimization and control of biomedical systems: Part 2
Bạn đang xem bản rút gọn của tài liệu. Xem và tải ngay bản đầy đủ của tài liệu tại đây (4.67 MB, 150 trang )
157
Part II
159
5
Part A: Type 1 Diabetes Mellitus: Modelling,
Model Analysis and Optimization
Stamatina Zavitsanou1, Athanasios Mantalaris2, Michael C.
Georgiadis3, and Efstratios N. Pistikopoulos4
1
Paulson School of Engineering & Applied Sciences, Harvard University, USA
Department of Chemical Engineering, Imperial College London, UK
3
Laboratory of Process Systems Engineering, School of Chemical Engineering, Aristotle University of Thesaloniki, Greece
4
Texas A&M Energy Institute, Artie McFerrin Department of Chemical Engineering, Texas A&M University, USA
2
5.a Type 1 Diabetes Mellitus: Modelling,
Model Analysis and Optimization
5.a.1 Introduction: Type 1 Diabetes Mellitus
Type 1 diabetes mellitus (T1DM) is a metabolic disorder that is characterized by
insufficient or absent insulin circulation, elevated levels of glucose in the plasma
and beta cells’ inability to respond to metabolic stimulus. It results from autoim
mune destruction of beta cells in the pancreas, which is responsible for secretion
of insulin, the hormone that contributes to glucose distribution in the human cells.
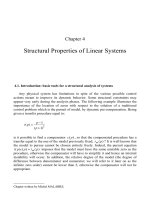
T1DM is one of the most prevalent chronic diseases of childhood. According
to the American Diabetes Association, 1 in 400–600 children and adolescents
in the USA have T1DM, and the incidence is increasing worldwide (Onkamo
et al., 1999; Patterson et al., 2009) not only in populations with high incidence
such as Finland (2010: 50/100,000 a year) but also in low‐incidence populations
(30/100,000 a year) (see Figure 5.a.1).
T1DM can cause serious complications in the major organs of the body.
Problems in the heart, kidney, eyes and nerves can develop gradually over
years. The risk of the complications can be decreased only when blood glucose
is efficiently regulated.
The most common treatment of T1DM is daily subcutaneous insulin injec
tions. This method subjects the patient to several complications, such as
requirement of the patient’s appropriate education and adherence to a specific
Modelling Optimization and Control of Biomedical Systems, First Edition.
Edited by Efstratios N. Pistikopoulos, Ioana Naşcu, and Eirini G. Velliou.
© 2018 John Wiley & Sons Ltd. Published 2018 by John Wiley & Sons Ltd.
160
Modelling Optimization and Control of Biomedical Systems
<4%
4–6%
6–8%
8–10%
10–14%
14–20%
>20%
Figure 5.a.1 Incidence of type 1 diabetes mellitus (T1DM) worldwide. Source: Onkamo et al.
(1999). Reproduced with permission of Springer.
lifestyle, risk of hypoglycaemia and therefore ability of the patient to manage
the hypoglycaemic episodes, infection of injected sites and so on. Additionally,
the patient is restricted to his treatment therapy, meaning that participation in
daily activities without adhering to strict glycaemic control could provoke
deviations from the normal glucose range, accompanied with medical con
sequences. Motivated by the challenge to improve the living conditions of a
diabetic patient and actually to adapt the insulin treatment to the patient’s life
rather than the opposite, the idea of an automated insulin delivery system that
would mimic the endocrine functionality of a healthy pancreas has been well
established in the scientific society.
5.a.1.1 The Concept of the Artificial Pancreas
Currently, the most advanced insulin delivery system for patients with T1DM
is an insulin pump. The insulin pump delivers a basal dose of rapid‐acting
insulin and several bolus doses according to the meal plan of the patient. Good
glycaemic control requires 4–6 measurements of blood glucose per day. These
measurements, taken either by standalone finger‐stick meters or by continu
ous blood glucose sensors, are loaded into the pump usually by the user or by
wireless connection. These measurements are an indicator of whether insulin
administration needs adjustment. A wireless connection of the pump data with
a personal computer offers a good programming of the pump settings.
The appropriate basal dose for a specific patient is set by the physician, and
it can be modified to several profiles (e.g. weekdays and weekends). The bolus
doses are set by the patient himself, depending on the meal content, and
indicated by the blood glucose levels.
Part A: Type 1 Diabetes Mellitus: Modelling, Model Analysis and Optimization
The automation of this therapy constitutes the concept of the artificial pan
creas. Essentially, the artificial pancreas is a device composed of a continuous
glucose monitoring system (CGMS), which reports blood glucose concentra
tion approximately every 5 min; a controller implemented on portable and
remotely programmable hardware (a microchip), which computes the appro
priate insulin delivery rate according to the provided data from the sensor;
and, finally, an insulin pump which infuses the previously calculated insulin
amount. The insulin pump, which incorporates the controller and the CGMS,
is wirelessly connected.
Many research groups worldwide have believed in this idea, and the research
society has focused on the development of the key components for the
realization of the artificial pancreas. Pump and CGM manufacturers, as well as
the US Food and Drug Administration (FDA) and several diabetes organiza
tions such as JDRF, are involved in projects by encouraging collaborations and
solving practical issues to accelerate the design of the artificial pancreas. The
state of the art on these topics related to the artificial pancreas can be found in:
Kovatchev et al. (2010), Dassau et al. (2013), Thabit and Hovorka (2013), Soru
et al. (2012), Cobelli et al. (2012), Breton et al. (2012) and Herrero et al. (2013).
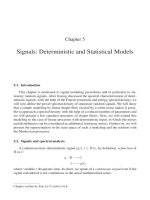
Towards this direction, as shown in Figure 5.a.2, the development of an
artificial pancreas is given in two levels (Dua et al., 2006, 2009). The first level
is the development of a high‐fidelity mathematical model that represents in
Parameter
estimation
Data of
patients
with
T1DM
Model development
Model
-Set point
-Safety constraints
predefined by the
physician
Sensitivity
analysis
Optimization
problem
Optimal insulin infusion
Continuous glucose monitoring
Disturbances
Patient
Parametric
controller
u(t) = g(x*)
Estimator
(current state x*)
Control strategy
Figure 5.a.2 The framework of an automated insulin delivery system.
161
162
Modelling Optimization and Control of Biomedical Systems
depth the complexity of the glucoregulatory system, presents adaptability to
patient variability and demonstrates adequate capture of the dynamic response
of the patient to various clinical conditions (normoglycaemia, hyperglycaemia
and hypoglycaemia). This model is then used for detailed simulation and
optimization studies to gain a deep understanding of the system. The second
level is the design of model‐based predictive controllers by incorporating tech
niques appropriate for the specific demands of this problem.
5.a.2 Modelling the Glucoregulatory System
In the last 25 years, a large number of models describing the glucoregulatory
system have been developed. The pharmacodynamics (effect of a drug on the
body) and the pharmacokinetics (effect of the body to the drug) have been
approached in several ways. Firstly, compartmental models have been devel
oped such as those of Bergman et al. (1981), Dalla Man (2007), Wilinska (2010)
and their further extensions, which assume that the relative mechanisms and
interactions of insulin and its effect on blood glucose can be represented within
several compartments, which are connected through the underlying mass
balances. The most common difficulty occurring in this approach is to relate
the model parameters (compartment’s volume, transfer rate between com
partments) to physiological parameters. To overcome these difficulties, physi
ological models are developed. These models accurately predict the drug–body
interactions by using detailed description of the body environment (tissues,
organs etc.). Examples of this type of approach are Sorenshen (1978) and
Parker (2000). However, this approach can lead to complicated models whose
validation requires a lot of experimental effort. Alternative models such as
data‐driven models or hybrid models such as the one developed by Mitsis
(2009) can also be used. A selection of models can be seen in Table 5.a.1.
Inspired by these previous approaches and previous work in the group of
Dua and colleagues (Dua & Pistikopoulos, 2005; Dua et al., 2006, 2009), a
physiologically based compartmental simulation model describing the
glucoregulatory system has been developed.
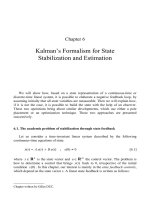
5.a.3 Physiologically Based Compartmental Model
The proposed model describes glucose distribution in the involved body com
partments, as presented in Figure 5.a.3, and the effect of insulin on glucose uptake
and suppression of endogenous glucose production (EGP). At steady state, an
approximation of constant physiological conditions, the blood glucose concentra
tion equals the net balance of endogenous glucose release in the circulation
and glucose uptake. When food is consumed, the contained carbohydrates break
Table 5.a.1 Mathematical models of glucose–insulin system.
Mathematical models
Compartmental models
Number of compartments
Glucose
kinetics
Insulin
kinetics
Validation
Comments
Reference
1
2
IVGTT data
Minimal complexity
Healthy subjects
Bergman et al.
(1981)
1
2
Literature data
Minimal model for
type 1 DM
Fisher (1991)
2
2
IVGTT data
Healthy subjects
Caumo (1993)
1
3
Literature data
No published data for
clinical evaluation
Berger and
Rodbard (1991)
1
2
Literature data
AIDA: educational
tool
Lehmann and
Deutsch (1992)
1
1
Literature data
Experimental data on
critically ill patients
Hann et al.
(2005)
2
2
Literature data
Average patient
Circadian SI variation
Fabietti et al.
(2006)
2
3
Literature data
Critically ill patients
Herpe et al.
(2007)
2
3
3 effect of
insulin action
Clinical study of
closed‐loop insulin
delivery in young
people with T1DM
Validated simulation
environment
Wilinska et al.
(2010)
2
2
Experiments
FDA approval
Dalla Man et al.
(2007a, 2007b)
Physiological models
6
6
Literature data
Average 70 kg man
Sorensen
(1978)
6
6
Literature data
Average 70 kg man
Includes a meal
sub‐model
Parker et al.
(1999)
Models in the form of delayed differential equation
1
2
3 delayed
insulin effect
Literature data
Healthy subjects
Implicit delays
Tolić et al.
(2000)
1
2
Literature data
Healthy subjects
Explicit delays
Bennett (2004)
(Continued )
164
Modelling Optimization and Control of Biomedical Systems
Table 5.a.1 (Continued)
Glucose
kinetics
Insulin kinetics Validation
Comments
Reference
1
2
Literature data
Healthy subject
Explicit delay
Engelborghs
et al. (2001)
1
2
Literature data
Healthy subjects
Explicit/implicit delays
Li et al. (2006)
1
2
Literature data
Type 1 DM
Explicit delay
Chen et al.
(2010)
Empirical models
Volterra model
Literature data
Mitsis et al.
(2009)
ARMA model
Literature data
Eren‐Oruklu
et al. (2009)
NARX model
Literature data
Ghosh and
Maka (2009)
Compartmental‐neural
networks
Literature data
Mougiakakou
et al. (2005)
QCO
CH
Heart
CB
Brain
CP
Periphery
QP
Meal
QL
CL Liver
QG
CK
QB
QG
CG Gut
Kidney
Gastrointestinal tract
Glucose
QK
Figure 5.a.3 Structure of the physiologically based compartmental model of glucose
metabolism in T1DM.
down into glucose in the gastrointestinal tract which is absorbed through
the small intestine into the bloodstream. Physiologically, an increase in blood
glucose triggers pancreatic insulin release, which activates g lucose transporters to
mediate glucose translocation into the insulin‐sensitive cells (adipose tissue, and
Part A: Type 1 Diabetes Mellitus: Modelling, Model Analysis and Optimization
skeletal and cardiac muscles) and additionally suppresses the EGP. In T1DM, the
pancreatic insulin secretion is replaced by optimal administration of exogenous
insulin that mimics the pancreatic response.
For the highly perfused organs (brain, liver, gut and kidney), glucose concen
tration is considered to be in equilibrium with the tissue glucose concentration.
The periphery compartment lumps the adipose tissue and muscle cells. Glucose
transfer from the blood capillaries to the interstitial fluid and glucose uptake in
the periphery are described with two compartments. Homogeneity and instant
mixing are assumed for every compartment, imposing all the exiting fluxes to
be in equilibrium with the compartment. For the insulin‐insensitive organs,
glucose uptake is assumed to be a constant ratio of the available glucose. The
core of the model is described with Equations (5.a.1)–(5.a.6), and the definitions
of the involved variables are presented in Table 5.a.2 and Table 5.a.3.
The driving force for glucose transport into the compartments is the blood–
tissue concentration difference. The concentration in every organ is given by
mass balances in every compartment.
Brain (B):
Vg ,B
dC B
dt
QB (C H C B ) uB (5.a.1)
Table 5.a.2 Variables of glucose metabolism model.
Symbol
Definition
Units
Qi
Blood flow
dL/min
QCO
Cardiac output
mL/min
Ci
Glucose concentration
mg/dL
Vg,i
Accessible glucose volume of compartment i
dL
ui
Glucose uptake
mg/min
ru,i
Ratio of glucose uptake
–
rCO,i
Ratio of cardiac output
–
excretion
Excretion rate
mg/min
EGP
Endogenous glucose production
mg/min
Ra
Rate of glucose appearance
mg/min
p
Rate constant defined as the rate of loss of solute from
blood to tissue
dL/min
Ip
Plasma insulin
pmol/L
Id
Delayed insulin signal
pmol/L
ML
Liver glucose mass
mg/kg
165
166
Modelling Optimization and Control of Biomedical Systems
Table 5.a.3 Variable subscript denotation.
Subscript
Denotation
Subscript
Denotation
i
Organ compartment
H
Heart
B
Brain
P
Periphery
K
Kidney
Pt
Periphery tissue
L
Liver
P,ISF
Interstitial periphery
G
Gut
Kidney (K):
dC k
dt
QK (C H C K ) uK
dC L
dt
QL C H
dCG
dt
QG (C H CG ) uG
V g ,K
excretion(5.a.2)
Liver (L):
V g ,L
QG CG QL C L uL
BW EGP (5.a.3)
Gut (G):
Vg,G
BW Ra (5.a.4)
Heart (H):
Vg ,H
dC H
dt
QB C B QL C L QP C P QK C K
QCO C H
uH (5.a.5)
Periphery (P):
V g ,Pc
dC P
dt
V g ,P , ISF
uP
QP (C H C P ) p(C P C Pt )(5.a.6.1)
dC Pt
dt
p(C P C Pt ) uP (5.a.6.2)
( o ) C Pt(5.a.6.3)
where the Ci is the glucose concentration (mg/dL) in i compartment, Vg,i the
accessible glucose volume (dL) of i compartment, Qi the blood flow (dL/min)
in i compartment, ui the glucose uptake (mg/min), EGP the endogenous glu
cose production (mg/kg/min), Ra the rate of glucose appearance in the blood
(mg/kg/dL) and λο the rate of glucose uptake (dL/min).
Part A: Type 1 Diabetes Mellitus: Modelling, Model Analysis and Optimization
Table 5.a.4 Ratio of cardiac output at rest.
Tissue
(rco,i)
Reference
Brain
0.11
Ferrannini and DeFronzo (2004)
Liver
0.20
Ferrannini and DeFronzo (2004)
Kidneys
0.13
Ferrannini and DeFronzo (2004)
Gut
0.15
Ferrannini and DeFronzo (2004)
Periphery
0.40
Ferrannini and DeFronzo (2004)
Table 5.a.5 Ratio of glucose uptake.
Tissue
(ru,b,i)
Reference
Brain
0.45
Ferrannini and DeFronzo (2004)
Liver
0.13
Ferrannini and DeFronzo (2004)
Kidneys
0.02
Ferrannini and DeFronzo (2004)
Gut
0.07
Ferrannini and DeFronzo (2004)
Periphery
0.30
Ferrannini and DeFronzo (2004)
For Equations (5.a.1)–(5.a.6), the blood flow in every organ i is described
with Equation (5.a.7). The ratio of cardiac output perfusing every organ is
presented in Table 5.a.4.
Qi
rCO ,i QCO(5.a.7)
Similarly, the glucose uptake in every organ is described with Equation (5.a.8),
and the ratio of glucose uptake ru,i is presented in Table 5.a.5.
ui
ru ,i Total _ uptake (5.a.8)
In the remainder of this section, the sub‐models of glucose metabolism functions
are described in more detail.
5.a.3.1 Endogenous Glucose Production (EGP)
Approximately 80% of glucose is produced endogenously in the liver through
gluconeogenesis and glucogenolysis, and 20% in the cortex of the kidney
mainly through gluconeogenesis (Cano, 2002; Gerich, 2010). In this study, due
to limited data availability, it is assumed that glucose is produced entirely by
the liver. In T1DM, the rate of EGP depends on adequate control of the disease
167
168
Modelling Optimization and Control of Biomedical Systems
(Roden & Bernroider, 2003). When referring to intensive insulin therapy, it can
be assumed that EGP is approximately the same as in normal humans (Davis
et al., 2000). The model describing the EGP in T1DM and used in Equations
(5.a.2) and (5.a.3) is adapted from Dalla Man et al. (2007). ML (mg/kg) denotes
the liver glucose mass, and Id (pmol/l) denotes the delayed insulin signal
described by a chain of two compartments (I1, Id). The model parameters are
estimated using available literature data (Boden et al., 2003).
k p1 k p2 M L k p3 I d (5.a.9)
EGP
dI1
dt
ki
I1
I p (5.a.10)
dI d
dt
ki
Id
I1 (5.a.11)
5.a.3.2 Rate of Glucose Appearance (Ra)
The model describing the rate of glucose appearing in the circulation when
food is consumed is adopted from Dalla Man et al. (2006).
5.a.3.3 Glucose Renal Excretion (Excretion)
In diabetes, the threshold of renal glucose reabsorption is exceeded when glucose
concentrations increase above 180 mg/dl and glucose gets excreted by the kidney.
It is assumed that renal glucose excretion (mg/min) increases proportionally to
increasing blood glucose concentration (Rave et al., 2006; Wilinska et al., 2010).
E t
CLrenal GK
0
180
If
If
GK
GK
180 mg /dL
180 mg /dL
(5.a.12)
(5.a.13)
where CLrenal (dl/min) is renal glucose clearance.
5.a.3.4 Glucose Diffusion in the Periphery
Glucose distribution and uptake in the periphery compartment are modelled
according to the structure presented in Figure 5.a.4.
It is assumed that glucose is extracted from the arterial flux with a rate factor
given in the current literature (Crone, 1965; Regittnig et al., 2003).
p QP 1 exp
PS /QP (5.a.14)
where PS is the permeability across the capillary wall, a product of permeabil
ity of exchange surface to glucose P and exchange surface area S. This rate
Part A: Type 1 Diabetes Mellitus: Modelling, Model Analysis and Optimization
Figure 5.a.4 Detailed glucose uptake in
the periphery.
Cart
Interstitial
fluid
Tissue
Cven
factor can increase in case of increased blood flow to the periphery or increased
perfusion due to increased capillary exchange area (e.g. during exercise).
According to Gudbjưrnsdóttir et al. (2003), PS was increased significantly
during a one‐step hyperinsulinemic clamp. Equation (5.a.15) describes the
influence of insulin on glucose permeability across the capillary wall:
dPS
dt
k2 ,PS PS k1,PS I p (5.a.15)
When glucose enters the interstitial fluid, it is absorbed by the tissues to pro
vide them with energy (5.a.6). The rate of uptake, λο (dL/min), is dependent on
insulin concentration in the blood.
d o
dt
SI
k2
o
k1 ( I p
I basal )
with
o (0)= basal
k1
I basal (5.a.16)
k2
k1 /k2(5.a.17)
where SI represents the patient’s sensitivity to insulin.
5.a.3.5 Adaptation to the Individual Patient
5.a.3.5.1 Total Blood Volume
The total blood volume (dL) is adapted to the patient’s height, weight and gen
der to account for the differences between obese and underweight patients and
for males and females. The formula used for men is (Wennesland et al., 1959):
TBVM
0.285h 0.316 BW 2.820
(5.a.18)
And for women (Brown et al. 1962):
TBVF
0.1652h 0.3846 BW 1.369(5.a.19)
The height (h) is in centimetres and weight (BW) in kilograms.
169
170
Modelling Optimization and Control of Biomedical Systems
5.a.3.5.2 Cardiac Output
The cardiac output (mL/min) can be efficiently approximated as a proportional
relationship to the patient’s weight BW (kg) according to Equation (5.a.20)
(Ederle et al., 2000):
QCO
224 BW 3/4
(5.a.20)
5.a.3.5.3 Compartmental Volume
Plasma proteins comprise approximately 8% of the plasma volume, and the
erythrocytes about 38% of the total packed red blood cells volume or haemato
crit (Hemat) (Ferrannini & DeFronzo, 2004). This percentage of the total blood
volume is inaccessible to glucose. Consequently, the accessible glucose volume
in every compartment is determined as:
V g ,i
1
0.08 (1 Hemat ) 0.38 Hemat
(VV,i VC ,i )(5.a.21)
The blood volume of every compartment i is defined as the sum of venous
and capillary volume. The glucose venous volume equals 60% of total blood
volume, and the capillary volume 10% of total blood volume (Gerich et al.,
2001; Ederle, 2011). The compartmental venous and capillary volumes are
defined as:
VV ,i
r f ,i 0.6TBV (5.a.22)
VC ,i
rc ,i 0.1TBV (5.a.23)
where rf,i refers to the ratio of total venous volume in compartment i and is
calculated with Equation (5.a.24):
r f ,i
Qi / Qi (5.a.24)
and rc,i refers to the ratio of total capillary volume, respectively (Sorensen, 1978).
and is presented in Table 5.a.6.
Table 5.a.6 Ratio of capillary volume.
Tissue
(rc,i)
Brain
0.071
Liver
0.18
Kidneys
0.08
Gut
0.13
Periphery
0.53
Part A: Type 1 Diabetes Mellitus: Modelling, Model Analysis and Optimization
5.a.3.5.4 Peripheral Interstitial Volume
The total regional volume for the adipose tissue is defined as:
VP
VCapillary ,P VInterstitial ,P VIntracellular ,P(5.a.25)
According to Oh and Uribarri (2006), the interstitial volume represents
28% of the total body water, while the intracellular volume is 60%. Hence,
VIntracellular 0.47VInterstitial .
According to Deurenberg et al. (1991):
1.2 BMI 10.8sex 0.23age 5.4 0.01m(5.a.26)
mAT
With
di
mi /Vi (5.a.27)
The interstitial volume of the muscles and the adipose tissue is considered to
be 10% of the total tissue volume according to Johnson (2003) and Eckel (2003),
respectively. Muscle mass is considered to be approximately 40% of the total
body weight (5.a.28), according to Ackland et al. (2009).
mmuscles
0.4 BW (5.a.28)
The peripheral volume of the interstitial fluid is calculated with Equations
(5.a.25)–(5.a.29), using Table 5.a.7:
V g ,P , ISF
VInterstitial , AT VInterstitial ,musc (5.a.29)
5.a.3.6 Insulin Kinetics
Insulin kinetics comprises the mechanisms involved from the moment insulin
is administered in the subcutaneous tissue until it is fully eliminated from
the body. Several models have been proposed in the literature (Kraegen &
Chisholm, 1984; Nucci & Cobelli, 2000; Tarín et al., 2005; Kuang & Li, 2008),
with compartmental modelling being the most common approach. In this
study, the structure to describe insulin kinetics is investigated when an insulin
pump is used. Four alternative compartmental models are presented here
Table 5.a.7 Density of muscles and adipose tissue.
Tissue
Density (kg/L)
Reference
Adipose tissue (dAT)
0.92
Gallagher et al. (1998)
Muscles (dmuscles)
1.04
Gallagher et al. (1998)
171
172
Modelling Optimization and Control of Biomedical Systems
(see Table 5.a.8) that describe experimental data of insulin kinetics and c ompare
in terms of identifiability and parameter accuracy, as discussed in Section 5.a.4.
The variable and parameter definitions for both models are shown in
Table 5.a.9.
5.a.4 Model Analysis
In this section, the most suitable model for insulin kinetics is selected by
performing a series of analysis tests. Experimental data obtained in the litera
ture are used to estimate the model parameters. Additionally, the suggested
structure of the EGP sub‐model is evaluated in terms of reliability, using again
experimental data from the literature to estimate the model parameters and
confirm the model’s accuracy. Consecutively, the previously presented entire
mathematical model of glucose metabolism is analysed in order to identify
the most influential parameters that contribute to the model’s uncertainty. This
uncertainty originates from the high intra‐ and inter‐patient variability that
dominates the system. Global sensitivity analysis, parameter estimation and
accuracy tests are performed to evaluate the model’s ability to represent the
physiology.
5.a.4.1 Insulin Kinetics Model Selection
The values of the parameters of the four models of insulin kinetics are identified
via parameter estimation, performed in gPROMS (PSE, 2011b), using experi
mental data obtained from the literature (Boden et al., 2003) The solution
method used in gPROMS to obtain the optimal parameter estimates is to
minimize the maximum log‐likelihood objective function by solving a nonlinear
optimization problem.
Figure 5.a.6 shows the plasma insulin concentration profiles produced by
the suggested models versus the experimental data. Generally, we can conclude
that all models describe relatively well the experimental data. However, a more
in‐depth analysis reveals the strengths and the weaknesses of each model.
A Pearson’s chi‐squared test (x2) (PSE, 2011b) is performed (Table 5.a.10) to
confirm the results indicated by Figure 5.a.5. For k N p degrees of freedom,
where N is the number of experimental data and p the number of parameters,
the x2 value is obtained for a 95% confidence level. The calculated x2 smaller
than the reference x2 value indicates that the fit of the considered model is good.
The Akaike criterion (AIC; Akaike, 1974) is applied in order to select the most
appropriate model that represents the experimental data. The test is presented
in Equation (5.a.39):
AIC Nln(WRSS) 2K (5.a.39)
Table 5.a.8 Model equations of three proposed insulin kinetics models and a reference model; schematic representation of the models.
ksub_1
bolus
S1
Ip
basal rate
bolus
S2
S1
kelim
ksub_2
ksub_1
kin*basal
Ip
dS1
dt
bolus k sub _ 1 S1
(5.a.30)
dS2
dt
basal k sub _ 2 S2
(5.a.31)
dI p
dt
k sub _ 1 S1 k sub _ 2 S2
Vdist
dS1
dt
bolus k sub _ 1 S1
(5.a.33)
dI p
dt
k sub _ 1 S1
Vdist
(5.a.34)
ke lim I p
kin basal ke lim I p
Model 1
(5.a.32)
Model 2
kelim
(Continued )
Table 5.a.8 (Continued)
u
k1
S1
S1
k1
I
kelim
Q1a
Ka1
LDa
Fast channel
(1–k)u
Q1b
LDb
k sub _ 1S1 k sub _ 1S2
(5.a.35)
dS1
dt
u k sub _ 1S1
(5.a.36)
dI
dt
k sub _ 1S2 ke lim I
(5.a.37)
Ip
I
Vdist
(5.a.38)
(Wilinska, 2005)
Slow channel
ku
dS2
dt
Q2
Ka1
Ka2
Q3
Ke
Model 3
Reference
model
Part A: Type 1 Diabetes Mellitus: Modelling, Model Analysis and Optimization
Table 5.a.9 Variable and parameter definition of Models 1, 2 and 3.
Symbol
Definitions
S1, S2
Insulin mass (mU) in the subcutaneous compartments
I
Insulin mass (mU) in the plasma compartment
ksub_1, ksub_2
Intercompartmental transfer rate constant (min−1)
kelim
Elimination rate constant (min−1)
Vdist
Insulin distribution volume (L/kg)
u, basal, bolus
Continuous insulin infusion (U/min)
Table 5.a.10 Goodness of fit of proposed models and model selection.
Pearson’s chi‐squared test (x2)
2
Model 1
Model 2
23.404
9.1041
Reference model
10.729
Model 3
9.0727
x Value (95%, k)
27.587
27.587
23.685
28.869
Akaike criterion
11.28
13.19
9.95
5.13
250
Plasma insulin concentration (pmol/L)
Experimental data
Model 1
200
Model 2
Reference model
Model 3
150
100
50
0
0
50
100
150
200 250 300
Time (min)
350
400
450
Figure 5.a.5 Comparison of Models 1, 2 and 3 and a reference model with
experimental data.
500
175
176
Modelling Optimization and Control of Biomedical Systems
Table 5.a.11 Optimal mean parameter estimates and standard deviations reported
in parentheses.
Model 1
Model 2
Reference model
Model 3
ksub1
0.36(±0.28)
0.59(±0.3)
–
0.025(±0.0017)
ksub2
0.016(±0.048)
0.042(±0.012)
–
–
kelim
0.017(±0.0065)
0.011(±0.004)
0.024(±0.014)
0.418 (±0.338)
Vdist
3.46(±1.57)
2.76(±0.5)
0.859(±0.63)
0.087(±0.072)
k
–
–
0.130(±0.1)
ka1
–
–
0.0661(±0.019)
–
ka2
–
–
0.0035(±0.0006)
–
km
–
–
69.25(±28.87)
–
VmaxLD
–
–
0.116(±0.068)
–
where N denotes the number of data points, K the number of parameters and
WRSS the weighted residuals sum of squares.
The Akaike values, as shown in Table 5.a.10, indicate that the most suitable
model to describe the available experimental data is Model 3, when c ompared
to the other three models. Model 3 is a trilinear compartment, which involves
two compartments to describe insulin absorption through the subcutaneous
tissue and a single compartment for insulin in the plasma. This model of insulin
kinetics has been widely used in the literature (Wilinska et al., 2005, 2010).
Table 5.a.11 presents the optimal estimated values of all the model parameters.
The values of the estimated parameters for the reference model and Model 3
are in good accordance with the literature (Wilinska et al., 2005).
5.a.4.2 Endogenous Glucose Production: Parameter Estimation
The experimental data used for parameter estimation are obtained from
Boden et al. (2003). The purpose of this experiment was to study the
mechanisms of endogenous glucose production during insulin excess and
insulin deficiency, while maintaining blood glucose concentration constant.
Therefore, the parameter related to the effect of glucose on the suppression
of EGP, kp2, was kept constant and equal to the mean value obtained from
Dalla Man et al. (2007).
Figure 5.a.6 shows that the model fits well with the experimental data,
and the values of the estimated model parameters can be seen in Table 5.a.12.
A t‐test (PSE, 2011b) is performed that indicates accurate estimates of the
parameters since the t‐value is larger than the reference t‐value for the 95%
confidence level. Additionally, the confidence interval shows the precision of
Part A: Type 1 Diabetes Mellitus: Modelling, Model Analysis and Optimization
Endogenous glucose production (EGP)
3.5
Experimental data
Model prediction
EGP (mg/kg/min)
3
2.5
2
1.5
1
0
50
100
150
200
250
Time (min)
300
350
400
450
Figure 5.a.6 Effect of subcutaneous insulin injection on endogenous glucose production.
Table 5.a.12 Parameter estimation results.
Symbol
Optimal estimate
(mean ± SD)
Confidence
interval* (95%)
95%
t‐value
ki
0.024 0.0034
0.0085
2.82
kp1
3.058 0.17
0.42
7.33
kp3
0.014 0.0022
0.0053
2.7
Reference t‐value (95%): 1.94.
the estimated values for the corresponding parameters and is calculated with
Equation (5.a.40), considering the confidence level a = 95%.
Confidence Interval
ta
SD (5.a.40)
(n 1)
2
n
5.a.4.3 Global Sensitivity Analysis
The model’s reliability is evaluated with the performance of global sensitivity
analysis (GSA). The uncertain factors that have a relative influence on the
model’s measurable output are determined and provide information on
the proposed model’s structure, in an effort to reduce the model’s uncertainty
by examining the most influential parameters. GSA has been performed with
177
178
Modelling Optimization and Control of Biomedical Systems
graphical user interface/high‐dimensional model representation (GUI‐HDMR)
software (Ziehn & Tomlin, 2009) which uses an expansion of the random
sampling HDMR (RS‐HDMR) method. The sampling was performed by simu
lating the model in gPROMS via the gO:MATLAB interface, developed by
Krieger et al. (2014). The sensitivity index (SI) is scaled between 0 and 1, indi
cating that a SI equal to 0 refers to a non‐influential parameter. The parameters
values vary between their upper and lower bounds, and for every GSA, a set of
20,000 Sobol distributed points within the range were used to calculate the SI
for specified time points. Sobol’s sampling set is preferred because it provides
evenly uniform distributed points of the input space. The sum of all the
SI converges to 1. In this study, the effect of the parameters on blood glucose
concentration was evaluated in two cases. In the first case, the SIs were calcu
lated for all the parameters to investigate their influence in a system with
respect to intra‐ and inter‐patient variability. In the second case, only the
parameters related to intra‐patient variability were included, assuming that the
weight, the organ volumes, the insulin distribution and the meal absorption
can be considered constants for an individual patient and were fixed at their
default values. The results are presented in Table 5.a.13.
5.a.4.3.1 Individual Model Parameters
The model parameters are shown in Table 5.a.13. The range of the parameters
Qco and Vg,i is calculated from Equations (5.a.18)–(5.a.23) when considering the
body weight of 50–115 kg, height of 150–190 cm and age of 18–80 years. The
default values are set for a male patient of 170 cm height, 52 years old and 94 kg.
The range of the parameters related to the Ra and EGP is adapted from the Uva/
Padova Simulator. The default values of the parameters for these subsystems
were set at the mean value. The ratio of cardiac output and the ratio of glucose
uptake were considered to vary ±5%, a value chosen when performing a series
of stochastic simulation studies, while the default values were obtained from
Table 5.a.4 and Table 5.a.5. The range and the default value of the parameters
for insulin kinetics were obtained from Wilinska et al. (2005). A big variation of
the default value in the parameters k1, k2 was assumed to evaluate the predic
tion ability of the model. Finally, a ±20% variation was assumed for k1,PS and
k2,PS. The initial guess of the values of the parameters k1, k2, and k1,PS, k2,PS was
selected when performing a set of stochastic simulation studies in comparison
with the simulation results provided by the Simulator.
A meal containing 50 g of carbohydrates and a 10 U bolus were given at
420 min. The time points in Table 5.a.13 refer to 1 h and 5 h after meal con
sumption, and they were chosen to investigate the influence of the parameters
when the sub‐models of meal absorption and bolus insulin kinetics are active,
all the external disturbances are absorbed and the system is relatively balanced.
For the first case, the most influential parameters are the k1, k2, kp3, kabs and ru,L
at 480 min and k1, k2, ru,L and ru,H at 720 min. Hence, the parameters related to
Table 5.a.13 Model parameters’ default values and range, and SIs for all parameters and for those related to intra‐patient variability calculated
with the GUI‐HDMR toolbox.
Sensitivity Index
All parameters
Symbol
Default
Range
480 min
2
ka1
1.66 10
02
Vdist
5.38 10
02
(1.16 25.08) 10
kelim
3.02 10
01
(6.79 134.55) 10
k1
3.00 10
04
(0.40 1.00) 10
03
k2
2.00 10
01
(0.50 5.00) 10
01
(1.0 2.66) 10
2
2
720 min
Intra‐patient parameters
480 min
720 min
Units
0
0
–
–
min− 1
1.12E‐06
5.07E‐07
–
–
L/Kg
0
0
–
–
min− 1
0.263565
0.340726
0.791256
0.445745
0.096337
0.418659
0.154249
0.565001
min− 1
mg/kg/min
dL2 per pmol· min2
kp1
5.38 10
00
(3.56 7.20) 10
00
0
0
7.93E‐06
3.21E‐05
kp2
5.23 10
03
(2.44 8.02) 10
03
0
0.000721
0
0
min− 1
kp3
1.43 10
02
(0.46 2.39) 10
02
0.005473
mg/kg/min per pmol/L
ki
0.78 10
(0.29 1.62) 10
02
0.11209
0.039743
02
0.301874
3.51E‐06
4.19E‐05
0
0.000163
min ‐ 1
k2_PS
4.00 10
03
(3.20 4.80) 10
03
0.015557
0.004761
0
3.37E‐05
min− 1
k1_PS
5.00 10
04
(4.00 6.00) 10
04
0.000932
0.000138
3.64E‐05
2.27E‐05
dL2 per pmol· min2
kmax
3.01 10
01
(0.21 5.82) 10
01
0
0
–
–
min− 1
kmin
4.00 10
02
(2.19 5.82) 10
02
0
0.000127
–
–
min− 1
kabs
8.84 10
03
(0.28 1.49) 10
02
1.67E‐05
–
–
min− 1
kgri
4.00 10
02
(2.19 5.82) 10
02
0.160871
0
8.23E‐05
–
–
min− 1
b
7.95 10
01
(6.27 9.62) 10
01
3.63E‐05
0.001582
–
–
–
d
2.15 10
01
(0.92 3.37) 10
01
0
0.001022
–
–
–
(Continued )
Table 5.a.13 (Continued)
Sensitivity Index
All parameters
Symbol
Default
CLrenal
5.00 10
Range
Intra‐patient parameters
480 min
720 min
480 min
720 min
Units
05
(4.00 6.00) 10
01
1.33E‐04
0
6.32 E‐05
0
dL/min
Qco
6.04 10
03
(3.76 7.02) 10
03
0.003759
0.003217
6.69E‐05
2.64E‐05
mL/min
VK
3.90 10
00
(2.24 4.86) 10
00
0.000289
0.000225
–
–
dL
VG
4.44 10
00
(2.55 5.54 ) 10
00
0.012974
0.008315
–
–
dL
VP
1.09 10
01
(0.63 1.37) 10
01
0
0.000374
–
–
dL
VB
3.06 10
00
(1.76 3.82) 10
00
6.78E‐05
0.010876
–
–
dL
VL
5.62 10
00
(3.23 7.02) 10
00
0
0.00272
–
–
dL
VH
1.34 10
01
(1.27 1.35) 10
01
3.38E‐05
0.000164
–
–
dL
rco,K
1.78 10
01
(1.69 1.87) 10
01
1.33E‐05
0.000539
1.16E‐05
0.006560
–
rco,G
1.95 10
01
01
0.067301
0.004797
0
3.68E‐05
–
4.39 10
(1.85 2.05) 10
(4.17 4.61) 10
01
rco,P
4.28E‐05
0.00048
6.26E‐05
0.003743
–
rco,B
1.38 10
01
(1.31 1.45) 10
01
0.000107
0.003262
1.29E‐05
2.34E‐06
–
rco,L
2.44 10
01
(2.32 2.56) 10
01
2.75E‐05
0.018778
1.04E‐05
0.000398
–
ru,K
2.00 10
02
(1.90 2.10) 10
02
0
0.00064
0.000774
0.003097
–
ru,G
7.00 10
02
(6.65 7.35) 10
02
0.02257
0.001398
0.008611
0.003169
–
ru,L
1.30 10
01
(1.24 1.37) 10
01
0.027909
0.001827
–
(1.71 1.89) 10
02
0.137398
1.80 10
02
0.052423
ru,H
0.000969
0.033467
0.000112
0.025256
–
01
Part A: Type 1 Diabetes Mellitus: Modelling, Model Analysis and Optimization
k1
0.8
k2
Sensitivity index
kp3
ru,L
0.6
ru,H
kabs
0.4
0.2
0.0
380 420 460 500 540 580 620 660 700 740 780 820 860
Time (min)
Figure 5.a.7 Time‐varying SIs when all parameters are considered.
glucose absorption from the periphery k1, k2 as a function of insulin concen
tration (5.a.16) are the most critical since they are related to the patient’s sen
sitivity to insulin and therefore their ability to absorb glucose. For the second
case, the parameters k1, k2, ru,L and ru,H are the most influential.
The time‐varying parameters for the two cases defined in Table 5.a.13 are
shown in Figure 5.a.7 and Figure 5.a.8. Only the parameters with the highest
sensitivities are included in the graphs. For both cases, the sensitivities of
parameters k1 and k2 remain high throughout the performance analysis, and
both are increased after meal and bolus administration. The sensitivity of kp3,
as expected, increases during bolus administration and decreases at the post
prandial state when insulin concentration decreases after the bolus peak.
Additionally, for kabs, a parameter that indicates how fast the blood glucose
is absorbed from the small intestine, the sensitivity increases with meal
consumption and decreases when glucose has been absorbed. For the ratio of
glucose absorption from the liver, the sensitivity is high at the fasting state and
decreases relatively at the postprandial state, while the ratio of glucose absorp
tion from the heart increases after meal consumption, indicating that both of
these parameters influence glucose regulation in accordance to Equations
(5.a.3) and (5.a.5).
As a conclusion, it can be stated that the parameters with the most influen
tial role are those related to insulin effect on glucose. The parameters related to
181
Modelling Optimization and Control of Biomedical Systems
1.0
k1
k2
0.8
kp3
ru,L
Sensitivity index
182
0.6
0.4
0.2
0.0
380 420 460 500 540 580 620 660 700 740 780 820 860
Time (min)
Figure 5.a.8 Time‐varying SIs when intra‐patient variability‐related parameters are
considered.
insulin distribution, absorption and elimination through the subcutaneous
tissue, as well as the parameters related to glucose distribution in the various
compartments, can be considered as non‐influential compared to the insulin
effect–related parameters.
5.a.4.4 Parameter Estimation
The performance of the proposed model is evaluated with detailed simula
tion studies performed in gPROMS, and its prediction ability is verified when
compared with data of 10 adult patients provided by the UVa/Padova T1DM
Simulator. To demonstrate the prediction ability of the proposed model, a
specific diet plan of 45 g of carbohydrates for breakfast, 70 g for lunch and
70 g for dinner and the appropriate insulin regimen for each patient is set, and
the simulation results are shown for the 10 patients. The same conditions are
applied in the Simulator, and the blood glucose and plasma insulin concentra
tion profiles are used as experimental data to estimate the most influential
model parameters (presented in Table 5.a.14). The parameters of the Ra and
EGP sub‐models are also estimated for each patient to obtain patient‐specific
glucose–insulin dynamics. The default values are used for the remaining
nonsignificant parameters.