Ebook Systems and computational biology – Molecular and cellular experimental systems: Part 2
Bạn đang xem bản rút gọn của tài liệu. Xem và tải ngay bản đầy đủ của tài liệu tại đây (0 B, 0 trang )
Part 2
Gene Regulation, Networking and
Signaling in and Between Genomes
0
8
Prediction and Analysis of Gene Regulatory
Networks in Prokaryotic Genomes
Richard Münch, Johannes Klein and Dieter Jahn
Institute of Microbiology, Technische Universität Braunschweig, Braunschweig
Germany
1. Introduction
The availability of over 1500 completely sequenced and annotated prokaryotic genomes offers
a variety of comparative and predictive approaches on genome-scale. The results of such
analyses strongly rely on the quality of the employed data and the computational strategy
of their interpretation. Today, comparative genomics allows for the quick and accurate
assignment of genes and often their corresponding functions. The resulting list of classified
genes provides information about the overall genomic arrangement, of metabolic capabilities,
general and unique cellular functions, however, almost nothing about the underlying complex
regulatory networks. Transcriptional regulation of gene expression is a central part of these
networks in all organisms. It determines the actual RNA, protein and as a consequence
metabolite composition of a cell. Moreover, it allows cells to adapt these parameters in
response to changing environmental conditions. An integral part of transcriptional regulation
is the specific interaction of transcription factors (TFs) with their corresponding DNA targets,
the transcription factor binding sites (TFBSs) or motifs. Recent advances in extensive data
mining using various high-throughput techniques provided first insights into the complex
regulatory networks and their interconnections. However, the computational prediction of
regulatory interactions in the promoter regions of identified genes remains to be difficult.
Consequently, there is a high demand for the in silico identification and analysis of involved
regulatory DNA sequences and the development of software tools for the accurate prediction
of TFBSs.
In this chapter we focus on methods for the prediction of TFBSs in whole prokaryotic
genomes (regulons). Although, many studies were sucessfully performed in eukaryotes they
are often not transferable to the special features of bacterial gene regulation. In particular
the prokaryotic genome organization concerning clusters of co-transcribed polycistronic
genes, the lack of introns and the shortness of promoter sequences necessitates adapted
computational approaches. Besides the genomic structure there are also differences in
the regulatory control logic. Prokaryotic promoters often possess one or few regulatory
interactions while the repertoire of regulators consists of only a couple of global TFs but
many local TFs (Price et al., 2008). On the other hand, eukaryotic promoters and enhancers
involve the concerted binding of multiple regulators, so called cis-regulatory modules (CRMs)
or composite elements (Loo & Marynen, 2009). Many excellent reviews in the field prokaryotic
gene regulation were recently published with focus on the broad spectrum of approaches
for the experimental and theoretical reconstruction of gene regulatory networks and their
150
2
Systems and Computational Biology – Molecular and Cellular Experimental
Systems
Will-be-set-by-IN-TECH
interspecies transfer (Baumbach, 2010; Rodionov, 2007; van Hijum et al., 2009; Zhou & Yang,
2006). Here, we focus on practical aspects how to detect new members of a regulon for genes
or genomes of interest. We will summarize useful bioinformatics databases, methods and
algorithms available for unraveling bacterial gene regulatory networks from whole genome
sequences. Finally, we want to indicate the limitations and technical problems of such
approaches and give a survey on recent improvements in this field.
2. Strategies for the prediction of transcripion factor binding sites
Basically, today exist at least two general approaches to recognize regulatory sequence
patterns.
One challenging approach called pattern discovery relies on a statistical
overrepresentation of DNA sequence motifs present in promoters of structurally and
funktionally related or co-regulated genes. In that case it is a de-novo prediction where the
binding site and the corresponding regulator are unknown. The list of investigated genes
can be derived from clusters of co-expressed genes available in microarray experiments,
from ChIP-on-chip experiments or from orthologous genes of related organisms. In the
latter case this method is called phylogenetic footprinting (McCue et al., 2001). Pattern
discovery algorithms are top-down approaches that use various learning principles with
different degrees of performance (Sandve et al., 2007; Su et al., 2010; Tompa et al., 2005). The
advantage of this method is the detection of potential regulatory DNA sequences even if there
is little known about the corresponding regulation. A recent study in prokaryotes appling a
pattern discovery approach revealed that the predicted patterns matched up to 81% of known
individual TFBSs (Zhang et al., 2009). However, this approach has limitted value in getting a
clue about what specific regulator is involved in a predicted TFBS.
An alternative approach on which we focus in this chapter is called pattern matching. It
makes use of prior knowledge in form of a predetermined pattern that can be assigned to a
specific regulator. The pattern is usually build based on a profile of known TFBSs for which
experimental evidence is available (Fig. 1 A). Using this set of DNA sequences a probabilistic
model describing the pattern degeneracy is constructed. Application of the model on a
given sequence results in a score for the likelihood that the investigated sequence belongs
to the same sequence family. The application of pattern matching involves the availability
of a reliable training set of TFBSs. For that purpose, several specalized databases provide
collections and patterns of prokaryotic TBFSs supplemented with various related information
like promoter and operon structures. A limited list of important data sources is shown in
table 1.
In the following examples a data set of 40 experimentally proven TFBSs from the anaerobic
regulator Anr of Pseudomonas aeruginosa is used (Trunk et al., 2010). There are different
ways of pattern representation. Traditionally, the usage of IUPAC code for base ambiguities
is a straightforward way to describe a binding motif (NC-IUB, 1985). In this approach,
combinations of certain bases are assigned to an extended alphabet of specific letters (Fig. 1 B).
IUPAC code can be easily converted into a regular expression (Fig. 1 C). A regular expression
is a formal language for pattern matching, that can be used to scan for ambiguous IUPAC
strings in order to predict new TFBSs (Betel & Hogue, 2002). (Fig. 1 B). Allthough the IUPAC
letter code is very concise and still widely used among biologists it does not describe a proper
weighting of bases. Additionally, the majority rules how to generate a consensus sequences
are to some extent arbitrary (Day & McMorris, 1992). However, in the case that the training
set consists of only a few sequences the usage of IUPAC code can still make sense.
Prediction
andofAnalysis
of Networks
Gene inRegulatory
Networks in Prokaryotic Genomes
Prediction and Analysis
Gene Regulatory
Prokaryotic Genomes
Name
Year Data content
URL
CoryneRegNet 2006 Coynebacerium TFBSs,
regulatory networks,
predictions
1513
References
Baumbach et al. (2009)
DBTBS
2001 B. subtilis TFBSs,
operons, predictions
Sierro et al. (2008)
DPInteract
1998 E. coli TFBSs, PWMs
/dpinteract
Robison et al. (1998)
PRODORIC
2003 prokaryotic TFBSs,
PWMs, promoters,
expression data
Grote et al. (2009)
PromEC
2001 E. coli promoters
/promec
Hershberg et al. (2001)
RegPrecise
2010 predicted TFBSs
Novichkov et al. (2010)
Kazakov et al. (2007)
RegTransBase 2007 prokaryotic TFBSs,
PWMs
RegulonDB
1998 E. coli TFBSs,
PWMs, operons,
Gama-Castro et al. (2011)
Tractor_DB
2004 predicted TFBSs of
γ-proteobacteria
Pérez et al. (2007)
Table 1. List of important public databases about bacterial gene regulation. The table shows
the name, year of establishment, data content, the internet address and the latest reference of
the respective database.
A more accurate description of a binding pattern is achieved by probabilistic models like a
frequency matrix (or alignment matrix) (Staden, 1984). Instead of considering only the most
common bases at each position a matrix comprises the frequencies for each nucleotide at each
position (Fig. 1 D). Based on frequency matrices many models for the calculation of weights
were proposed. Such a model is broadly called position weight matrix (PWM) or position
specific scoring matrix (PSSM). PWMs can be considered as simplified profile hidden Markov
models (HMM) that do not allow insertion and deletion states (Durbin et al., 1998). Formally,
a PWM is an array M of weights w where each column corresponds to the position of the TFBS
motif of the length l and each row represents the letter of the sequence alphabet A. In case of
DNA A ∈ { A, C, G, T } (equation 1).
w A,1
wC,1
M=
wG,1
wT,1
w A,2
wC,2
wG,2
wT,2
···
···
···
···
w A,l
wC,l
wG,l
wT,l
(1)
Many very related examples for the calculation of individual weights were proposed in the
literaure (Berg & von Hippel, 1987; Fickett, 1996; Schneider et al., 1986; Staden, 1984; Stormo,
2000). The information theoretical approach and modifications of it ((Schneider et al., 1986))
are widely used and some of the most successful methods for both the modeling and the
prediction of potential TFBSs. Information is a measure of uncertainty which means that
152
4
Systems and Computational Biology – Molecular and Cellular Experimental
Systems
Will-be-set-by-IN-TECH
a highly conserved position with the exclusive occurence of one specific nucleotide gets
the highest information value of 2 bits. In other words there is a maximum certainty of
finding this nucleotide at this position. In contrast, an information value of 0 bits represents
a highly degenerated position and the highest uncertainty of finding a specific nucleotide.
The information vector R(l ) represents the total information content of a profile of aligned
sequences at the position l with f (b, l ) indicating the frequency of the base b at position l.
R(l ) = 2 +
T
∑
b= A
f (b, l ) log2 f (b, l )
(2)
An information PWM m(b, l ) is generated by multiplying the base frequencies f (b, l ) with the
total information content R(l ) (Fig. 1 E).
m(b, l ) = f (b, l ) · R(l )
(3)
For pattern matching applications a PWM is used by summing up the corresponding
weights of a candidate sequence to a score. Afterwards, these scores are compared to a
predefined cut-off (or threshold) to filter out potential predictions. The derived score is
often correlated to the binding affinity of a TF thus the information score can be interpreted
as an rough estimate to the specific bindung energy. However, this is only possible under
the simplifying assumption that each position of a pattern contributes independently to the
TF-TFBS interaction. This additivity assumption is controversially discussed but is was shown
that it is in fact a reasonable approximation (Benos et al., 2002). The graphical representation
of an information PWM is called sequence logo (Schneider & Stephens, 1990). In a sequence
logo each PWM weight is equivalent to the individual letter size so the total height of the stack
of letters represents the information content R(l ) at this position. Sequence logos allow an
illustrative visualization of the sequence conservation and binding preference of a regulator
(Fig. 1 F).
3. Statistical significance of pattern matching
Regulatory sequences are commonly short (usually 6-18 bp), the sample size of experimentally
proven sites is often limited and in many cases the observed level of sequence conservation
is low. Consequently, the genome-wide statistically occurance frequency of derived patterns
is often unrealistically high. In such cases, searches generally generate increasing numbers of
false-predictions the lower the threshold score is set. This is demonstrated in Fig. 2 showing
the score distributions of true and false predictions of a genome wide search in P. aeruginosa
using the PWM of the Anr regulator (Fig. 1 E). In the shown example matches in coding
regions were considered as false-predictions (false-positives) and matches that are part of the
training set were naturally ranked as true-predictions (true-positives). Score distributions are
also important indicators to evaluate the predictive capacity of a PWM (Medina-Rivera et al.,
2011).
In order to improve the predictive power of pattern matching, commonly a cut-off score is
set in a way, that improves the ratio of true- and false-predictions. However, thereby the
total number of hits will still contain to some extent false-positives while some true matches
become lost (false-negatives). From this it follows that matches of TFBS predictions can not be
classified in a binary manner like a dignostic test, since true-positives and false-positives are
always coexisting. Alternatively, they can be grouped into a classification schema consisting
1535
Prediction
andofAnalysis
of Networks
Gene inRegulatory
Networks in Prokaryotic Genomes
Prediction and Analysis
Gene Regulatory
Prokaryotic Genomes
A) Excerpt of 40 Sample sequences (training set)
1
2
3
4
..
.
40
T
T
T
T
T
T
T
T
G
G
G
G
A
A
A
A
T
C
T
C
T
T
T
C
C
T
G
G
G
C
C
A
G
A
A
A
T
T
T
T
C
C
C
C
A
A
A
A
A
A
A
A
T
C
T
C
G
..
.
C
T
T
G
A
T
G
G
A
T
C
A
A
H
Y
N
B
N
B
V
K
C
A
R
B) IUPAC consensus
Y
T
G
C) Regular Expression
[CT]TG[ACT][CT][ACGT][CGT][ACGT][CGT][ACG][TG]CA[AG]
D) Frequency Matrix
1
2
5
0
33
A
C
G
T
2
0
0
0
40
3
0
0
40
0
4
29
7
0
4
5
0
17
3
20
6
6
17
10
7
7
0
15
9
16
8
10
10
18
2
9
6
15
16
3
10
20
3
17
0
11
0
1
2
37
12
0
40
0
0
13
40
0
0
0
14
35
0
5
0
5
0.00
0.30
0.05
0.35
6
0.02
0.05
0.03
0.02
7
0.00
0.17
0.10
0.18
8
0.07
0.07
0.12
0.01
9
0.04
0.09
0.10
0.02
10
0.35
0.05
0.30
0.00
11
0.00
0.04
0.08
1.43
12
0.00
2.00
0.00
0.00
13
2.00
0.00
0.00
0.00
14
1.27
0.00
0.18
0.00
E) Position Weight Matrix
A
C
G
T
1
0.06
0.15
0.00
0.97
2
0.00
0.00
0.00
2.00
3
0.00
0.00
2.00
0.00
4
0.65
0.16
0.00
0.09
F) Sequence Logo
13
12
10
C
C
9
8
6
5
G
A
T
G
14
G
A
C
G
G
4
TCAA
A
T
G
CGC
C
TG
11
T
AC
C
A
7
TG
T
C
3
0
5′
2
1
1
bits
2
3′
Fig. 1. Various pattern representations for a taining set 40 Anr binding sites from Pseudomonas
aeruginosa (Trunk et al., 2010). The deduced IUPAC consensus (B), regular expression (C),
frequency matrix (D), position weight matrix (E) and sequence logo (F) are shown.
154
6
Systems and Computational Biology – Molecular and Cellular Experimental
Systems
Will-be-set-by-IN-TECH
B
10
8
6
0
0
2
4
Number of matches
250
200
150
100
50
Number of matches
300
12
350
A
11.5
12.0
12.5
13.0
13.5
14.0
14.5
15.0
11.5
12.0
12.5
13.0
Score
13.5
14.0
14.5
15.0
Score
Fig. 2. Score distributions of false-positive matches (A) and true-positive matches (B) from a
genome wide search in P. aeruginosa using the Anr PWM.
of four different classes (Fig. 3) which is called a two-by-two confusion matrix or contingency
table (Fawcett, 2004).
Dataset
Match
No Match
Positive
Negative
True-Positive
False-Positive
False-Negative
True-Negative
Fig. 3. A two-by-two confusion matrix illustrates all four possible outcomes of matches in the
positive and in the negative dataset.
Thus, setting a cut-off score can be considered as important decision-making process. Instead
of setting an arbitrary cut-off value it is possible to determine an optimized threshold. For
that purpose, a number of statistical performance measurements for binary classification are
available. Sensitivity Sn (or true-positive rate) measures the proportion of positive matches
which are correctly identified at a given cut-off score c. Hereby, the positive matches include
both the number of true-positives TP and false-negatives FN.
TP
(4)
TP + FN
Similarly, specificity Sp (or true-negative rate) measures the proportion of correctly identified
negative matches at a given cut-off score c where the amount of negative matches is the sum
of true-negatives TN and false-positive FP.
Sn(c) =
Sp(c) =
TN
TN + FP
(5)
1557
Prediction
andofAnalysis
of Networks
Gene inRegulatory
Networks in Prokaryotic Genomes
Prediction and Analysis
Gene Regulatory
Prokaryotic Genomes
This definition involves that the sensitivity and specificity plots as a function of the cut-off
show opposite behaviour which results in an increase of specificity (get less false-positives)
at the cost of sensitivity (find less true-positives) and vice versa (Fig. 4 A). A receiver
operating characteristics (ROC) curve summarizes the classification performance in a plot of
sensitivity versus (1-specificity). ROC curves are fundamental tools for the evaluation of the
classification models. An optimal ROC curve would cross the upper left corner or coordinate
(0,1) representing 100% sensitivity and specificity whereas a random guess would produce a
point along the diagonal line (Fig. 4 A). Thus, the diagonal line divides the ROC space: points
above the digonal represent good classification results, points below the line indicate poor
results (Fawcett, 2004).
1.0
B
1.0
A
0.8
0.6
0.0
0.2
0.4
TP rate
0.6
0.4
0.0
0.2
Performance
0.8
Sensitivity
Specificity
12.0
12.5
13.0
13.5
Score
14.0
14.5
0.0
0.2
0.4
0.6
0.8
1.0
FP rate
Fig. 4. Performance measurements for the prediction of the Anr regulon in Pseudomonas
aeruginosa. (A) Sensitivity (green) and specificity (red) plot. (B) ROC graph.
An alternative way to optimize the performance of pattern matching and to produce
stastistically significant results is the calculation of a p-value. A p-value depicts the likelihood
to find a score that is as least as good by change. P-values can be either determined by
simulation or estimated via a compound importance sampling approach (Oberto, 2010).
Finally, appropriate thresholds for pattern searches are determined as a tradeoff between
sensitivity and specificity to maximize both values. Despite optimized cut-off values this
approach can results in a poor sensitivity and a loss of 40-60% of known functional sites
(Benítez-Bellón et al., 2002). In addition, the fact that false-predictions commonly exeeds
true-predictions by several orders of magnitude (Fig. 2 B) was called ’futility theorem’
(Wasserman & Sandelin, 2004). Fortunately, there are many sophisticated approaches to
overcome this problem in a reasonable way (see section 4).
4. Improvements to increase the accuracy of TFBS predictions
4.1 Modifications of the score
In several studies the information score was modified in different ways. One of the most
critical points of equation 2 is that it postulates an equal nucleotide distribtuion of the target
genome which is the case e.g. for Escherichia coli with a GC content of 51.8%. For this reason,
156
8
Systems and Computational Biology – Molecular and Cellular Experimental
Systems
Will-be-set-by-IN-TECH
the calculation of the information content of motifs in genomes with highly biased nucleotide
composition is likely to be over- or underestimated. A more generalized form that considers
the background frequencies Pb is given in equation 6.
R(l ) = −
T
∑
b= A
f (b, l ) log2
f (b, l )
Pb
(6)
This new term turned out to be the relative entropy or Kullback-Leibler distance (Stormo,
2000). An other promising approach deals with biased genome as a discrete channel of noise to
discriminate a motif from its background (Schreiber & Brown, 2002). However, it was recently
demonstrated, that the unmodified information score performs on average better than other
alternatives (Erill & O’Neill, 2009). One reason might be, that binding sites shift towards the
genome skew in a co-evolutionary process between TFs and its corresponding TFBSs.
Other modifications concern the way the score is computationally calculated. Since the
information vector usually peeks at certain well conserved positions it is possible to get
overestimated matches by forming the overall sum. For that purpose, it is useful to define
a core region consisting of the highly conserved positions. Using this approach it is possible
to realize the computation of the score in two steps. Potential matches have to pass first the
core cut-off before they are evaluated by the overall cut-off score (Münch et al., 2005; Quandt
et al., 1995).
Finally, it is possible to enhance the accuracy by combining multiple (independent) criterions.
Apart from the pure sequence information, DNA exhibits distinct structural properties caused
by interactions from neighboring nucleotides. This includes for example DNA curvature,
flexibility and stability, amongst others. Structural DNA features are available as di- and
trinucleotide scale values assigning a particular value to each possible nucleotide combination
(Baldi & Baisnée, 2000). These values are derived from empirical measurements or
theoretical approaches. The calculation of structural features within a DNA sequence stretch
is usually performed by summing up and averaging the corresponding di- or trinucleotide
scales. Prokaryotic promoters usually exhibit distinct structural features which imply that
these DNA sequences are more curved and less flexible in comparision to coding regions.
This feature is necessary in order to enable the melting of the DNA strands for the onset of
transcription. In most bacterial promoters structural peaks are present around the position
-40 upstream of the transcriptional start point (Pedersen et al., 2000). Structural features can
provide distinct scores independent from PWM based sequence similarity scores. Recently,
pattern matching was combined with a binding site model that was trained using 12 different
structural properties (Meysman et al., 2011). In this approach, based on conditional random
fields, it was shown, that the classification of matches was significantly improved. In a similar
way, structural and chemical features of DNA decreased the number of false-positives in a
supervised learning approach (Bauer et al., 2010).
4.2 Positional preference of TFBSs
Prokaryotic genomes usually consist of 6-14% non-coding DNA (Rogozin et al., 2002). In
contrast to eukaryotes, the evolvement of non-coding regions appears to be determined
primarily by the selective pressure to minimize the amount of non-functional DNA, while
maintaining the essential TFBSs. Additionally, it was demonstrated in Escherichia coli, that
many PWMs show a strong preference for matches in non-coding regions (Robison et al.,
1998). Figure 5 A shows the distance of 1741 genomic TFBSs relative to the translational
start site of the target gene. Only 3.6% of all TFBSs are located after the start codon within
1579
Prediction
andofAnalysis
of Networks
Gene inRegulatory
Networks in Prokaryotic Genomes
Prediction and Analysis
Gene Regulatory
Prokaryotic Genomes
the coding region. However, the largest amount of TFBSs is accumulated directly upstream.
This is also demonstrated in the cumulative percentage of TFBSs against the distance to the
translational start (Fig. 5 B). According to this result, a total of 75.3% and 87.9% of all TFBSs
are located 200bp and 300bp upstream, respectively. Thus, prokaryotic promoters are usually
short and it is reasonable to constrain searches to non-coding regions with a limit of a few
hundred bp upstream to the translational start.
B
60
40
0
20
Cumulative Percentage
300
200
0
100
Frequency
400
80
500
100
A
−1000
−800
−600
−400
−200
0
200
−1000
Distance
−800
−600
−400
−200
0
Distance
Fig. 5. Histogram of TFBS distances to the translational start site. The used dataset consisted
of 1741 genomic TFBSs from various bacterial species taken from the PRODORIC database
4.3 Phylogenetic conservation of regulatory interactions
The large number of sequenced bacterial genomes offers comparative genomics approaches
to predict and to analyze regulatory interactions. Similar to phylogenetic footprinting, highly
conserved matches in promoter regions of paralogous genes are more likely to be functional
targets than non-conserved matches (McCue et al., 2001). This is particulary important for
the interspecies transfer of gene regulatory networks (Babu et al., 2006; Baumbach, 2010) but
also for the scanning of new regulon members (Pérez et al., 2007). The utilization of pattern
matching methods in combination with phylogenetic conservation is also called regulog
analysis (Alkema et al., 2004). During a regulog analysis the relativ conservation score RCS is
defined by the fraction of orthologs, that share the same potential TFBS.
RCS =
orthologsobserved
orthologsexpected
(7)
In the first step of this and related approaches, the orthologous regulators and the
corresponding target gene set are determined. This is often realized by bi-directional best
BLAST hits (BBH) (Mushegian & Koonin, 1996). In the second step, conserved TFBSs are
extracted via pattern matching or pattern discovery approaches. Predicted TFBSs with
phylogenetic conservation can also be used to extend or to build new PWMs. Huge
datasets based on phylogenetic reconstruction were generated in various groups of bacteria
(Baumbach et al., 2009; Novichkov et al., 2010; Pérez et al., 2007). Further investigetion of
regulon evolution revealed the availability of a core set of genes that is widely conserved
158
10
Systems and Computational Biology – Molecular and Cellular Experimental
Systems
Will-be-set-by-IN-TECH
across related species and a variable set of target genes reflecting the degree of specialization
(Browne et al., 2010; Dufour et al., 2010). However, it was shown, that the outlined approach is
commonly only feasible between closely related clades which is due to the fact that TFs evolve
rapidly and independently of their target genes (Babu et al., 2006). Morover, orthologous
TFs in bacteria often have different functions and regulate different sets of genes (Price et al.,
2007). In summary, a high RCS value for a TFBS match represents an independent score
for the validation for a real functional targets while a low RCS does not necessarily rule
out false-positive matches. The phylogenetic conservation approach represents a powerful
approach to predict gene regulatory networks in highly related organisms and to get insights
into the evolution of regulons.
5. Conclusion and outlook
In summary the genome-wide recognition of DNA patterns by computational methods is still
a challanging task. However, major improvements in this field allow for reliable predictions in
many cases. Especially the rising number of sequenced bacterial genomes in combination with
data from high-throughput technologies offers many posibilities for the development of more
sophisticated methods in comparative genomics approaches. Nevertheless, computational
methods for TFBSs prediction can not replace wet-lab experiments but they can help to find
new hypotheses that can be verified in an iterative process.
6. References
Alkema, W. B. L., Lenhard, B. & Wasserman, W. W. (2004). Regulog analysis: detection of
conserved regulatory networks across bacteria: application to Staphylococcus aureus.,
Genome Res. 14(7): 1362–1373.
URL: />Babu, M. M., Teichmann, S. A. & Aravind, L. (2006). Evolutionary dynamics of prokaryotic
transcriptional regulatory networks., J Mol Biol 358(2): 614–633.
URL: />Baldi, P. & Baisnée, P. F. (2000). Sequence analysis by additive scales: DNA structure for
sequences and repeats of all lengths., Bioinformatics 16(10): 865–889.
Bauer, A. L., Hlavacek, W. S., Unkefer, P. J. & Mu, F. (2010). Using sequence-specific chemical
and structural properties of dna to predict transcription factor binding sites., PLoS
Comput Biol 6(11): e1001007.
URL: />Baumbach, J. (2010). On the power and limits of evolutionary conservation–unraveling
bacterial gene regulatory networks., Nucleic Acids Res .
URL: />Baumbach, J., Wittkop, T., Kleindt, C. K. & Tauch, A. (2009).
Integrated analysis
and reconstruction of microbial transcriptional gene regulatory networks using
coryneregnet., Nat Protoc 4(6): 992–1005.
URL: />Benos, P. V., Bulyk, M. L. & Stormo, G. D. (2002). Additivity in protein-DNA interactions: how
good an approximation is it?, Nucleic Acids Res 30(20): 4442–4451.
Benítez-Bellón, E., Moreno-Hagelsieb, G. & Collado-Vides, J. (2002). Evaluation of thresholds
for the detection of binding sites for regulatory proteins in Escherichia coli K12 DNA.,
Genome Biol 3(3): 13.
Prediction
andofAnalysis
of Networks
Gene inRegulatory
Networks in Prokaryotic Genomes
Prediction and Analysis
Gene Regulatory
Prokaryotic Genomes
159
11
Berg, O. G. & von Hippel, P. H. (1987). Selection of DNA binding sites by regulatory proteins.
Statistical-mechanical theory and application to operators and promoters., J Mol Biol
193(4): 723–750.
Betel, D. & Hogue, C. W. V. (2002). Kangaroo–a pattern-matching program for biological
sequences., BMC Bioinformatics 3(1): 20.
Browne, P., Barret, M., O’Gara, F. & Morrissey, J. P. (2010). Computational prediction of the
crc regulon identifies genus-wide and species-specific targets of catabolite repression
control in Pseudomonas bacteria., BMC Microbiol 10: 300.
URL: />Day, W. H. & McMorris, F. R. (1992). Critical comparison of consensus methods for molecular
sequences., Nucleic Acids Res 20(5): 1093–1099.
Dufour, Y. S., Kiley, P. J. & Donohue, T. J. (2010). Reconstruction of the core and extended
regulons of global transcription factors., PLoS Genet 6(7): e1001027.
URL: />Durbin, R., Eddy, S., Krogh, A. & Mitchison, G. (1998). Biological sequence analysis, Cambridge
University Press.
Erill, I. & O’Neill, M. C. (2009). A reexamination of information theory-based methods for
dna-binding site identification., BMC Bioinformatics 10: 57.
URL: />Fawcett, T. (2004). ROC graphs: Notes and practical considerations for researchers, Technical
report, HP Laboratories.
URL: />Fickett, J. W. (1996). Quantitative discrimination of MEF2 sites., Mol Cell Biol 16(1): 437–441.
Gama-Castro, S., Salgado, H., Peralta-Gil, M., Santos-Zavaleta, A., Muñiz-Rascado, L.,
Solano-Lira, H., Jimenez-Jacinto, V., Weiss, V., García-Sotelo, J. S., López-Fuentes,
A., Porrón-Sotelo, L., Alquicira-Hernández, S., Medina-Rivera, A., Martínez-Flores,
I., Alquicira-Hernández, K., Martínez-Adame, R., Bonavides-Martínez, C.,
Miranda-Ríos, J., Huerta, A. M., Mendoza-Vargas, A., Collado-Torres, L., Taboada,
B., Vega-Alvarado, L., Olvera, M., Olvera, L., Grande, R., Morett, E. & Collado-Vides,
J. (2011). Regulondb version 7.0: transcriptional regulation of escherichia coli k-12
integrated within genetic sensory response units (gensor units)., Nucleic Acids Res
39(Database issue): D98–105.
URL: />Grote, A., Klein, J., Retter, I., Haddad, I., Behling, S., Bunk, B., Biegler, I., Yarmolinetz, S., Jahn,
D. & Münch, R. (2009). PRODORIC (release 2009): a database and tool platform
for the analysis of gene regulation in prokaryotes., Nucleic Acids Res 37(Database
issue): D61–D65.
URL: />Hershberg, R., Bejerano, G., Santos-Zavaleta, A. & Margalit, H. (2001). PromEC: An
updated database of Escherichia coli mRNA promoters with experimentally identified
transcriptional start sites., Nucleic Acids Res 29(1): 277.
Kazakov, A. E., Cipriano, M. J., Novichkov, P. S., Minovitsky, S., Vinogradov, D. V., Arkin,
A., Mironov, A. A., Gelfand, M. S. & Dubchak, I. (2007). RegTransBase–a database
of regulatory sequences and interactions in a wide range of prokaryotic genomes.,
Nucleic Acids Res 35(Database issue): D407–D412.
URL: />
160
12
Systems and Computational Biology – Molecular and Cellular Experimental
Systems
Will-be-set-by-IN-TECH
Loo, P. V. & Marynen, P. (2009). Computational methods for the detection of cis-regulatory
modules., Brief Bioinform 10(5): 509–524.
URL: />McCue, L., Thompson, W., Carmack, C., Ryan, M. P., Liu, J. S., Derbyshire, V. & Lawrence,
C. E. (2001). Phylogenetic footprinting of transcription factor binding sites in
proteobacterial genomes., Nucleic Acids Res 29(3): 774–782.
Medina-Rivera, A., Abreu-Goodger, C., Thomas-Chollier, M., Salgado, H., Collado-Vides, J. &
van Helden, J. (2011). Theoretical and empirical quality assessment of transcription
factor-binding motifs., Nucleic Acids Res 39(3): 808–824.
URL: />Meysman, P., Dang, T. H., Laukens, K., Smet, R. D., Wu, Y., Marchal, K. & Engelen, K. (2011).
Use of structural dna properties for the prediction of transcription-factor binding
sites in Escherichia coli., Nucleic Acids Res 39(2): e6.
URL: />Münch, R., Hiller, K., Grote, A., Scheer, M., Klein, J., Schobert, M. & Jahn, D. (2005).
Virtual Footprint and PRODORIC: an integrative framework for regulon prediction
in prokaryotes., Bioinformatics 21(22): 4187–4189.
URL: />Mushegian, A. R. & Koonin, E. V. (1996).
A minimal gene set for cellular life
derived by comparison of complete bacterial genomes., Proc Natl Acad Sci U S A
93(19): 10268–10273.
NC-IUB (1985). Nomenclature Committee of the International Union of Biochemistry
(NC-IUB). Nomenclature for incompletely specified bases in nucleic acid sequences.
Recommendations 1984., Eur J Biochem 150(1): 1–5.
Novichkov, P. S., Laikova, O. N., Novichkova, E. S., Gelfand, M. S., Arkin, A. P., Dubchak, I.
& Rodionov, D. A. (2010). RegPrecise: a database of curated genomic inferences of
transcriptional regulatory interactions in prokaryotes., Nucleic Acids Res 38(Database
issue): D111–D118.
URL: />Oberto, J. (2010). Fitbar: a web tool for the robust prediction of prokaryotic regulons., BMC
Bioinformatics 11: 554.
URL: />Pedersen, A. G., Jensen, L. J., Brunak, S., Staerfeldt, H. H. & Ussery, D. W. (2000). A DNA
structural atlas for Escherichia coli., J Mol Biol 299(4): 907–930.
URL: />Pérez, A. G., Angarica, V. E., Vasconcelos, A. T. R. & Collado-Vides, J. (2007). Tractor_DB
(version 2.0): a database of regulatory interactions in gamma-proteobacterial
genomes., Nucleic Acids Res 35(Database issue): D132–D136.
URL: />Price, M., Dehal, P. & Arkin, A. (2008). Horizontal gene transfer and the evolution of
transcriptional regulation in Escherichia coli., Genome Biol 9(1): R4.
URL: />Price, M. N., Dehal, P. S. & Arkin, A. P. (2007). Orthologous transcription factors in
bacteria have different functions and regulate different genes., PLoS Comput Biol
3(9): 1739–1750.
URL: />
Prediction
andofAnalysis
of Networks
Gene inRegulatory
Networks in Prokaryotic Genomes
Prediction and Analysis
Gene Regulatory
Prokaryotic Genomes
161
13
Quandt, K., Frech, K., Karas, H., Wingender, E. & Werner, T. (1995). MatInd and MatInspector:
new fast and versatile tools for detection of consensus matches in nucleotide
sequence data., Nucleic Acids Res 23(23): 4878–4884.
Robison, K., McGuire, A. M. & Church, G. M. (1998). A comprehensive library of
DNA-binding site matrices for 55 proteins applied to the complete Escherichia coli
K-12 genome., J. Mol. Biol. 284(2): 241–254.
Rodionov, D. A. (2007). Comparative genomic reconstruction of transcriptional regulatory
networks in bacteria., Chem Rev 107(8): 3467–3497.
URL: />Rogozin, I. B., Makarova, K. S., Natale, D. A., Spiridonov, A. N., Tatusov, R. L., Wolf, Y. I.,
Yin, J. & Koonin, E. V. (2002). Congruent evolution of different classes of non-coding
DNA in prokaryotic genomes., Nucleic Acids Res 30(19): 4264–4271.
Sandve, G. K., Abul, O., Walseng, V. & Drabløs, F. (2007). Improved benchmarks for
computational motif discovery., BMC Bioinformatics 8: 193.
URL: />Schneider, T. D. & Stephens, R. M. (1990). Sequence logos: a new way to display consensus
sequences., Nucleic Acids Res 18(20): 6097–6100.
Schneider, T. D., Stormo, G. D., Gold, L. & Ehrenfeucht, A. (1986). Information content of
binding sites on nucleotide sequences., J Mol Biol 188(3): 415–431.
Schreiber, M. & Brown, C. (2002). Compensation for nucleotide bias in a genome by
representation as a discrete channel with noise., Bioinformatics 18(4): 507–512.
Sierro, N., Makita, Y., de Hoon, M. & Nakai, K. (2008).
Dbtbs: a database
of transcriptional regulation in bacillus subtilis containing upstream intergenic
conservation information., Nucleic Acids Res 36(Database issue): D93–D96.
URL: />Staden, R. (1984). Computer methods to locate signals in nucleic acid sequences., Nucleic Acids
Res 12(1 Pt 2): 505–519.
Stormo, G. D. (2000). DNA binding sites: representation and discovery., Bioinformatics
16(1): 16–23.
Su, J., Teichmann, S. A. & Down, T. A. (2010). Assessing computational methods of
cis-regulatory module prediction., PLoS Comput Biol 6(12): e1001020.
URL: />Tompa, M., Li, N., Bailey, T. L., Church, G. M., Moor, B. D., Eskin, E., Favorov, A. V., Frith,
M. C., Fu, Y., Kent, W. J., Makeev, V. J., Mironov, A. A., Noble, W. S., Pavesi, G., Pesole,
G., Régnier, M., Simonis, N., Sinha, S., Thijs, G., van Helden, J., Vandenbogaert, M.,
Weng, Z., Workman, C., Ye, C. & Zhu, Z. (2005). Assessing computational tools for
the discovery of transcription factor binding sites., Nat Biotechnol 23(1): 137–144.
URL: />Trunk, K., Benkert, B., Quäck, N., Münch, R., Scheer, M., Garbe, J., Jänsch, L., Trost, M.,
Wehland, J., Buer, J., Jahn, M., Schobert, M. & Jahn, D. (2010). Anaerobic adaptation
in Pseudomonas aeruginosa: definition of the Anr and Dnr regulons., Environ Microbiol
12(6): 1719–1733.
URL: />van Hijum, S. A. F. T., Medema, M. H. & Kuipers, O. P. (2009). Mechanisms and evolution
of control logic in prokaryotic transcriptional regulation., Microbiol Mol Biol Rev
73(3): 481–509, Table of Contents.
URL: />
162
14
Systems and Computational Biology – Molecular and Cellular Experimental
Systems
Will-be-set-by-IN-TECH
Wasserman, W. W. & Sandelin, A. (2004). Applied bioinformatics for the identification of
regulatory elements., Nat Rev Genet 5(4): 276–287.
URL: />Zhang, S., Xu, M., Li, S. & Su, Z. (2009). Genome-wide de novo prediction of cis-regulatory
binding sites in prokaryotes., Nucleic Acids Res 37(10): e72.
URL: />Zhou, D. & Yang, R. (2006). Global analysis of gene transcription regulation in prokaryotes.,
Cell Mol Life Sci 63(19-20): 2260–2290.
URL: />
9
Mining Host-Pathogen Interactions
Dmitry Korkin, Thanh Thieu, Sneha Joshi and Samantha Warren
University of Missouri, Columbia,
USA
1. Introduction
Infections are caused by a vast variety of pathogenic agents including viruses, bacteria,
fungi, protozoa, multicellular parasites, and even proteins (Anderson and May 1979;
Morse 1995; Bartlett 1997; Mandell and Townsend 1998) that target host organisms from
virtually all kingdoms of life (Daszak, Cunningham et al. 2000; Williams, Yuill et al. 2002).
Infectious diseases in humans account for 170 thousand deaths in the United States and
14,7 million deaths world-wide (2004; Rossi and Walker 2005). “Neglected diseases”, a
group of tropical diseases that are spread among the poorest segment of the world’s
population, account for a large portion of human infections (Ayoola 1987; Trouiller,
Olliaro et al. 2002). With the reluctance of the pharmaceutical industry to invest in the
development of drugs for neglected diseases, there is an increasing pressure on the
scientific community in academia and non-profit organizations to obtain a fast and
inexpensive cure (Trouiller, Torreele et al. 2001; Maurer, Rai et al. 2004; Fehr, Thurmann et
al. 2006). In addition to human infections, infections in plant and animals have a
multibillion dollar economic impact each year (Bowers, Bailey et al. 2001; Whitby 2001).
Expanding the studies to the whole animal kingdom allows scientists to study the hostpathogen evolution of virulence mechanisms that are common among plant and animals,
such as type III secretion system (T3SS), an elaborate protein-delivery system (Espinosa
and Alfano 2004; Abramovitch, Anderson et al. 2006). Moreover, studying interactions
between pathogens and simpler model organisms, such as drosophila, has led to
important findings in mammalian systems and is critical for understanding human
infections (Cherry and Silverman 2006). Recently another threat has come to scientists’
attention: the potential use of some pathogens as bioweapons (Whitby 2001; Moran, Talan
et al. 2008). The attacks can target population directly, or they can target strategic
resources such as the world’s most consumed crops. Studying HPIs may provide critical
knowledge for the development of infection diagnosis and treatment for disaster planning
in case of a bioterrorism event.
A pathogen causing an infectious disease generally exhibits extensive interactions with the
host (Munter, Way et al. 2006). These complex crosstalks between a host and a pathogen
may assist the pathogen in successfully invading the host organism, breaching its immune
defence, as well as replicating and persisting within the organism. Systematic determination
and analysis of HPIs is a challenging task from both experimental and computational
approaches, and is critically dependent on the previously obtained knowledge about these
interactions. The molecular mechanisms of host-pathogen interactions (HPIs) include
164
Systems and Computational Biology – Molecular and Cellular Experimental Systems
interactions between proteins, nucleotide sequences, and small ligands (Lengeling, Pfeffer et
al. 2001; Kahn, Fu et al. 2002; Stebbins 2005; Forst 2006). The interactions between the
pathogen and host proteins are one of the most important and therefore widely studied
group of HPIs (Stebbins 2005). During the last decade, an increasing amount of experimental
data on virulence factors, their structures, and their functions has become available
(Sansonetti 2002; Stebbins 2005). The first steps towards large-scale systematic determination
and analysis of molecular HPIs have recently emerged for important pathogens (Shapira,
Gat-Viks et al. 2009; Dyer, Neff et al. 2010). Recent progress in data mining and
bioinformatics allows scientists to accurately predict novel protein-protein interactions,
structurally characterize individual proteins and protein complexes, and predict protein
functions on a scale of an entire proteome (Thornton 2001; Russell, Alber et al. 2004;
Shoemaker and Panchenko 2007). Unfortunately, there have been only a handful of methods
designed to address the protein interactions between pathogenic agents and their hosts
(Cherkasov and Jones 2004; Davis, Barkan et al. 2007; Dyer, Murali et al. 2007; Lee, Chan et
al. 2008; Evans, Dampier et al. 2009; Tyagi, Krishnadev et al. 2009; Doolittle and Gomez
2011). As it is the case for many bioinformatics areas, collecting HPI data into a centralized
repository is instrumental in developing accurate predictive methods. Recently, several such
HPI repositories have been introduced, some are manually curated, while others are reliant
on the existing databases (Winnenburg, Urban et al. 2008; Driscoll, Dyer et al. 2009; Kumar
and Nanduri 2010). While this is a promising first step towards a large-scale HPI data
collection, one of the largest and most comprehensive sources of experimentally verified
HPI data remains largely underexplored: PubMed, a database of peer-reviewed biomedical
literature, which includes abstracts of more than 20 million research papers and books
( Unfortunately, the comprehensive manual
identification and data extraction of the abstracts containing HPI information from PubMed
is not feasible due to the size of PubMed. Furthermore, no informatics approach currently
available to do this automatically.
In this chapter, we discuss several possible solutions to the problem of automated HPI data
collection from the publicly available literature. The chapter is organized as follows. First,
we describe some of the popular HPI databases that are currently available publicly. Second,
we discuss the state-of-the-art approaches to a related problem of mining general proteinprotein interactions from the literature. Third, we propose three approaches to mine HPIs
and discuss the advantages and disadvantages of these approaches. In conclusion, we
discuss the future steps in the area of HPI text mining by highlighting factors that are critical
for its successful development.
2. Host-pathogen interaction databases
During the last several years, a number of resources collecting HPI data have emerged
(Snyder, Kampanya et al. 2007; Winnenburg, Urban et al. 2008; Driscoll, Dyer et al. 2009;
Kumar and Nanduri 2010). Many resources rely on the automated post-processing of the
large-scale databases for general protein-protein interactions, while some other obtain the
HPI data by manually curating the biomedical literature. Often the resources focus on the
human-pathogen interactions. Next, we will briefly describe some of the popular databases
that include HPI data.
HPIDB - Host-Pathogen Interaction DataBase. One of the most recent HPI database,
HPIDB (Kumar and Nanduri 2010) integrates the information from other HPI database, PIG
Mining Host-Pathogen Interactions
165
(Driscoll, Dyer et al. 2009), and more general protein-protein interaction databases, BIND
(Gilbert 2005), GeneRIF(Mitchell, Aronson et al. 2003; Pruitt, Tatusova et al. 2003), IntAct
(Aranda, Achuthan et al. 2010), MINT (Zanzoni, Montecchi-Palazzi et al. 2002), and
Reactome (Matthews, Gopinath et al. 2009). Currently, the database has 22,841 proteinprotein interactions between 49 host and 319 pathogen species (Kumar and Nanduri 2010).
HPIDB is searchable via a keyword search, a BLAST search, or a homologous HPI search.
For each query, the following output information is obtained: UniProt accession numbers of
both host and pathogen proteins, host and pathogen names, detection method, author name,
PubMed publication ID (PMID), interaction type, source database, and comments. The
homologous HPI search option allows the user to do one or both of the following: search for
a set of homologous host proteins, and search for a set of homologous pathogen proteins.
PATRIC – PAThosystems Resource Integration Center. PATRIC is a resource that
integrates genomics, proteomics, and interactomics data on a comprehensive set of bacterial
species as well as a set of data mining and comparative genomics tools (Snyder, Kampanya
et al. 2007; Sullivan, Gabbard et al. 2010). The human-pathogen interaction data for 30
bacterial pathogens are also a part of the resource. Similar to HPIDB, the data are extracted
and post-processed from a number of general protein-protein interaction databases
including BIND (Gilbert 2005), DIP (Xenarios, Fernandez et al. 2001), IntAct (Aranda,
Achuthan et al. 2010), and MINT (Zanzoni, Montecchi-Palazzi et al. 2002). With PATRIC a
user selects a pathogen from the home page. The search can be refined by selecting specific
interaction types (e.g., “direct interaction”, “colocalization”), detection methods (e.g.,
“coimmunoprecipitation”, “two hybrid”), or source databases. The results can be visualized
as a network of interacting proteins with the colour nodes representing different species and
weighted edges representing the number of independent experimental sources supporting
the interaction. The Pathogen Interaction Gateway (PIG) is a part of PATRIC that is focused
on collecting and analysing exclusively the protein-protein human-pathogen interactions
and the corresponding interaction networks (Driscoll, Dyer et al. 2009). The PIG web
interface allows mining the data using two query types: the BLAST search and text keyword
search. PIG also has a utility that allows the user to visualize the network of protein-protein
HPIs followed by the network comparison between the HPI networks extracted for two
different pathogen genes.
PHI-base – the Pathogen-Host Interaction dataBASE. PHI-base collects information on
experimentally verified pathogenicity, virulence and effector genes from bacterial, fungal,
and Oomycete pathogens and includes a variety of infected hosts from plants, mammals,
fungus, and insects (Winnenburg, Urban et al. 2008). All database entries are manually
curated and are supported by experimental evidence and literature citations. The current
version has a total of 1,065 gene entries participating in 1,335 interactions between 97
pathogens and 76 hosts, supported by 720 literature references. The interaction between a
host and pathogen organism is considered in this database in a more general sense and often
is not associated with any physical interaction between the host and pathogen proteins.
Using the PHI-base web interface, a user can do either a simple quick search or an advanced
search, where the user selects one or many of the following search terms: gene, disease
(caused by pathogen), host, pathogen, anti-infective, phenotype, and experimental evidence.
The search output is a list of interactions and their details including PHI-base accession
number, gene name, EMBL accession number, phenotype of the mutant, pathogen species,
disease name, and experimental host. The user can also obtain additional information on
nucleotide and amino acid sequences of the pathogen gene, experimental evidence of the
166
Systems and Computational Biology – Molecular and Cellular Experimental Systems
interaction, gene ontology (pathogenesis, molecular function, and biological process), and a
publication reference.
3. Current approaches for mining protein-protein interactions
Rapid growth of published biomedical research has resulted in the development of a
number of methods for biomedical literature mining over the last decade (Krallinger and
Valencia 2005; Rodriguez-Esteban 2009). The methods dealing with the biomolecular
information can be generally divided into three categories based on the domain of
biomedical knowledge they target: (i) automated protein or gene name identification in a
text (Mika and Rost 2004; Seki and Mostafa 2005; Tanabe, Xie et al. 2005), (ii) literature-based
functional annotation of genes and proteins (Chiang and Yu 2003; Jaeger, Gaudan et al.
2008), and (iii) extracting the information on the relationships between biological molecules,
such as proteins and RNAs, or genes (Hu, Narayanaswamy et al. 2005; Shatkay, Hˆglund et
al. 2007; Lee, Yi et al. 2008). The relationships detected by the third group of methods range
from a co-occurrence of the genes and proteins in a text (Hoffmann and Valencia 2005) to
detecting the protein-protein interactions (PPIs) (Blaschke and Valencia 2001; Marcotte,
Xenarios et al. 2001; Donaldson, Martin et al. 2003) and identification of signal transduction
networks and metabolic pathways (Friedman, Kra et al. 2001; Hoffmann, Krallinger et al.
2005; Santos and Eggle 2005). Being a special case of protein-protein interactions, HPIs could
directly benefit from the advancements of the currently existing text mining methods.
Extraction of protein-protein interactions from the text has been one of the three main tasks
for the recent BioCreAtIvE (Critical Assessment of Information Extraction systems in
Biology) challenges, a community-wide effort for evaluating biological text mining and
information retrieval systems (Hirschman, Yeh et al. 2005; Krallinger, Leitner et al. 2008).
Three subtasks have been specified: (i) detection of protein-protein interactions relevant
documents (interaction article subtask, IAS), (ii) identification of sentences with proteinprotein interactions (interaction sentences subtask, ISS), and (iii) identification of interacting
protein pairs (interaction pair subtask, IPS). A relevant problem, the protein interaction
method subtask (IMS), is concerned with identification of the type of experimental data
used to determine an interaction. Approaches that address these subtasks vary from
supervised machine learning classifiers, to address the first subtask, to statistical language
processing and grammar-based methods to address the second and third subtasks.
A simple approach to extract protein-protein interactions is to determine the co-existence of
proteins in the same sentence (Stephens, Palakal et al. 2001; Hoffmann and Valencia 2005).
However, this approach is insufficient to handle structured information of biomedical
sentences. Therefore, pattern matching methods have been proposed that rely on either
manually defined patterns (Leroy and Chen 2002; Corney, Buxton et al. 2004) or patterns
that are automatically generated using dynamic programming (Huang, Zhu et al. 2004; Hao,
Zhu et al. 2005). Another popular group of methods employs the natural language
processing parsers. A basic approach, called shallow parsing, decomposes sentences into
non-overlapping fragments and chunks, and defines the dependencies between the chunks
without extracting their internal structure (Thomas, Milward et al. 2000; Leroy, Chen et al.
2003). Many shallow parsing approaches employ finite-state automata to recognize the
interaction relationships between proteins or genes (Thomas, Milward et al. 2000; Leroy,
Chen et al. 2003). One of the most prominent approaches relies on the deep parsing
Mining Host-Pathogen Interactions
167
techniques, where the entire structure of a sentence is extracted (Park, Kim et al. 2001; Ding,
Berleant et al. 2003; Daraselia, Yuryev et al. 2004; Pyysalo, Ginter et al. 2004; Kim, Shin et al.
2008; Miyao, Sagae et al. 2009). Many deep parsing approaches have successfully employed
link grammars (Sleator and Temperley 1995), context-free grammars that rely on a
dictionary of rules (linking requirements) to connect, or “link”, pairs of related words
(Ahmed, Chidambaram et al. 2005; Seoud, Youssef et al. 2008; Yang, Lin et al. 2009).
Each of the above methods, while directly addressing the second and the third subtasks, can
also solve the abstract classification problem from the first subtask, based on whether or not
the method is able to extract any protein-protein interactions. The accuracy of such
classification, however, depends on the accuracy of a more difficult subtask of proteinprotein interaction extraction. Thus, several methods have been developed to directly
address the problem of binary classification of protein-protein interaction relevant
publications (Marcotte, Xenarios et al. 2001; Calli 2009; Kolchinsky, Abi-Haidar et al. 2010).
The methods primarily rely on supervised and unsupervised feature-based classification
techniques. Recently, the first method for classification of HPI-relevant documents has been
introduced, which employs a Support Vector Machines (SVM) supervised classifier (Yin, Xu
et al. 2010).
4. New approaches to detection and mining host-pathogen interactions from
biomedical abstracts
HPI literature mining is related to a general problem of protein-protein interaction literature
mining. However, the additional requirement that the interaction occurs exclusively
between the host and pathogen proteins makes the task more challenging. The accuracy
of an HPI mining method will depend on additional factors, such as its ability to correctly
assign a host or pathogen organism to the interacting protein. Similar to the way
the BioCreAtIvE initiative defines three types of protein-protein interaction mining
problems (Hirschman, Yeh et al. 2005), the problem of HPI mining can be split into three
specific tasks:
HPI Mining Task 1: Given a biomedical publication (a paper or an abstract), determine
whether or not it contains information on HPIs.
HPI Mining Task 2: Given a biomedical publication containing HPI information, determine
specific sentences that contain this information.
HPI Mining Task 3: Given a biomedical publication that contain HPI information, determine
specific pairs of host and pathogen proteins participating in the interactions and the
corresponding organisms.
The first task can be formulated as a standard classification problem, which is often
addressed by machine learning methods and for which a number of the method assessment
protocols have been developed. Here we rely on the following five basic measures. The first
measure, accuracy, is calculated as f AC N TP N TN / N , where NTP and NTN are the number
of true positives and negatives, correspondingly, and N is the number of classified
interfaces. The other two related measures, precision and recall, are calculated as
f PR N TP / NTP N FP and f RE N TP / N TP N FN , correspondingly, where NFP and NFN are
the number of false positives and negatives. F-score is calculated as F 2
fPR f RE
. The last
fPR fRE
168
measure,
MCC
Systems and Computational Biology – Molecular and Cellular Experimental Systems
the
Matthew
correlation
NTP NTN N FP N FN
coefficient
NTP N FP NTP N FN NTN N FP NTN N FN
is
calculated
as
. Similarly, performance on the last
task can be easily assessed based on the available information about the host and pathogen
proteins and their respective organisms. Specifically, we use four different measures. The
first two measures, fORG and fPRT, address the accuracy of detecting the pairs of interacting
host and pathogen organisms as well as their proteins. Each measure is calculated as a
percentage of the number of correctly detected pairs of organisms/proteins to the total
number of pairs. The other two measures, gORG and gPRT, account for the partial detection of
HPI information, when at least one of the two organisms or proteins is detected. Both
measures are defined as the percentage of the total number of detected organisms/proteins
to the total number of organisms/proteins in all HPIs.
Unfortunately, evaluating a method’s performance for the second task is more challenging,
since the HPI data are often (i) scattered across multiple sentences and (ii) redundant (for
instance, the same interaction between two proteins can be mentioned in several sentences).
The method assessment for the second task becomes even more challenging when multiple
HPIs are present in the same abstract.
We next introduce several strategies that address the above tasks for the PubMed
biomedical abstracts (here and below, we will always consider an abstract of the biomedical
publication together with the publication’s title; the latter often provides important
information on HPIs). One of the main reasons behind extracting HPI information from the
abstracts rather than entire papers is the fact that for many papers, the abstract is the only
information that is freely available in PubMed. The first strategy is to rely on the existing
methods for mining protein-protein interactions followed by additional post-processing to
filter out the intra-species interactions. Another approach employs the language-based
methods traditionally used in protein-protein interaction literature mining. The last
approach introduces a supervised-learning feature-based methodology, which has recently
emerged in the area of biomedical literature mining. While each of the approaches is
applicable to each of the three tasks, here we will focus on assessing their performance for
the first and third tasks.
4.1 Data collection
Collecting accurate, unbiased, non-redundant data on HPIs is a critical step for efficient
training of a supervised method as well as for an accurate assessment of any literature
mining approach. Both the positive set (abstracts containing HPI information) and the
negative set (abstracts that do not contain HPI information) were manually selected and
annotated. To obtain the set of potential candidates for the positive and negative sets we
have combined of both searching the existing HPI databases and the PubMed database. Our
positive set consisted of 175 HPI containing abstracts that include human and non-human
hosts. The abstracts containing human-pathogen interactions were collected by searching
and manually curating abstracts from PIG, a database of host-pathogen interactions
manually extracted from the literature (Driscoll, Dyer et al. 2009). For each abstract, we
required the presence of organism and protein names for both the host and the pathogen,
resulting in 89 abstracts. Unfortunately, in its current form, PIG only has the abstracts with
annotated human-pathogen interactions. Therefore to obtain the list of interactions between
non-human hosts and their pathogens, we searched using an extensive PubMed query. We
Mining Host-Pathogen Interactions
169
required the presence in the same abstract of (i) at least one (non-human) host name, (ii) at
least one pathogen name, (iii) and at least one interaction keyword. We then manually
selected from the list another 86 abstracts that contained HPI information, adding them to
the positive set.
To obtain candidates for the negative set, we performed an almost identical search
strategy using the same PubMed query but including ‘human’ to the list of the host
names. We again manually selected the abstracts to ensure that that they did not have any
HPI information, even though they contained the important keywords. Note that it is
significantly harder for a computational approach to distinguish between the abstracts
from the obtained negative training set and those from the positive set, compared to a
negative training set consisting of abstracts that were randomly chosen from PubMed. As
a result, we selected 175 abstracts where no HPI information was found, although some of
the abstracts included information on intra-species protein-protein interactions. The list of
manually curated positive and negative sets of PubMed abstracts can be found at:
/>4.2 A naïve approach based on literature mining of protein-protein interactions
In a simple naïve approach, we first establish whether an abstract contains any information
on a protein-protein interaction using the existing state-of-the-art literature mining methods
followed by extraction of the pair of interacting proteins (Fig. 1A). We rely on the PIE
system, which integrates the natural language processing and machine learning methods to
determine the sentences that contain protein-protein interactions in a PubMed abstract and
extract the corresponding protein names and the interaction keywords (Kim, Shin et al.
2008). Next, for each interacting protein we identify its corresponding organism by applying
NLProt protein/gene tagging software (Mika and Rost 2004). NLProt uses a number of
techniques, such as the dictionary search, rule-based detection, and feature-based
supervised learning, to extract the names of proteins and genes and tag them using SWISSPROT or TrEMBL identifiers (Boeckmann, Bairoch et al. 2003). The method also predicts the
most likely organisms associated with these proteins/genes. It was reported to have a
precision of 75% and a recall of 76% on detecting protein/gene names (Mika and Rost 2004).
Finally, for each sentence identified as containing a protein-protein interaction by the PIE
system, we determine if this interaction is a HPI. Specifically, if each of the two proteins
forming a protein-protein interaction belongs to a different organism, and these organisms
can be assigned the host-pathogen roles, then the interaction is classified as an HPI. To
assign the host-pathogen roles, we use our manually curated dictionaries of host and
pathogen organism names (Table 1).
We assessed the naïve approach by applying it to our testing set of 88 abstracts, 44 positive
and 44 negative examples. As a result in addressing Task 1, the obtained accuracy was 0.53,
precision was 1.0, and recall was 0.07 for the classification of HPI-containing abstracts (Task 1);
F-score and Matthews Correlation Coefficient were 0.13 and 0.19, correspondingly. We found
that the method almost completely failed to detect the abstracts containing HPI information;
the contribution to the accuracy came primarily from the true negative hits, containing 44 (out
of 44) abstracts from the negative testing set. Interestingly, both high precision and low recall
values could be attributed to the same property of the naïve approach: it failed to accurately
detect the protein-protein interactions. Indeed, all 41 false negatives were not due to the
approach’s failure to assign the host and pathogen roles to the identified organisms, but due to
its failure to identify a protein-protein interation in the abstract.
170
Systems and Computational Biology – Molecular and Cellular Experimental Systems
It is also not surprising that the naïve approach performed poorly when addressing Task 3:
the method was able to detect only two proteins out of 44 protein pairs and none of the 44
pairs of organisms, resulting in the only non-zero score of gPRT = 0.02; the other three scores,
fORG, fPRT, and gORG were equal to zero.
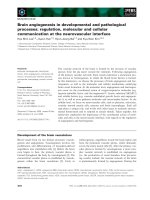
Fig. 1. Three HPI literature mining approaches. (A) Naïve approach. (B) Language-based
approach (C) Feature-based supervised machine learning approach.
171
Mining Host-Pathogen Interactions
Dictionary name
N
Examples
Interaction keywords
54
Interact, associate, bind
Experimental keywords
28
Yeast two-hybrid, chemical crosslinking
Negation keywords
11
Not, neither, inability
HPI specific keywords
17
Virulence, effectors, infection
Host names
309
Host, plant, human
Pathogen names
349
Listeria monocytogenes, Hepatitis virus
Table 1. Dictionaries of keywords used by all three approaches. N is the number of unique
entries for each dictionary.
4.3 A language-based approach
Our second approach is inspired by the language-based methods in biomedical text mining,
which are also widely used in mining protein-protein interactions. In HPI text mining, we
are faced with additional challenges such as correctly associating the organism name for
each protein, ensuring that the extracted interaction is inter- and not intra-species
interaction, and combining the information about an HPI from multiple sentences. As a
result, these additional challenges necessitate adding new modules to the computational
pipeline of our approach compared with a pipeline for extracting general protein-protein
interactions. The HPI mining pipeline consists of the following 7 steps (Fig. 1B): (1) text
preprocessing, (2) entity tagging, where we identify protein/gene and organism names, (3)
grammar parsing, where we parse the input text into dependency structures (4) anaphora
resolution, where we identity references to pronouns, (5) syntactic extraction, where we split
a complex sentence into simple ones, (6) role matching, where we identify semantic roles in
each simple sentence, (7) interaction keyword tagging, and (8) extraction of the actual HPI
information. We note that this approach directly addresses Tasks 2 and 3 by finding the
sentences containing HPI information and extracting the corresponding pairs of host and
pathogen organisms and the interacting proteins/genes. Task 1 is addressed by classifying
each abstract based on whether there was at least one HPI with the complete information
extracted from the abstract’s text.
Entity tagging. The entity tagging module identifies named entities in a abstract, such as
protein/gene names and the corresponding organism names. For a language-based text
mining approach, it is critical that all named entities are accurately identified. Thus, our
language–based approach for HPI literature mining has the most elaborate entity tagging
module of all three approaches introduced here. Specifically, the module includes three
stages: (i) protein/gene name tagging using NLProt, (ii) host/pathogen organism dictionary
match, and (iii) post-processing. First, we apply the NLProt tagger to identify the names of
all proteins/genes occurring in the text and the corresponding organism names (Mika and
Rost 2004). We note that in a case when a protein with the same name exists for multiple
species, NLProt assigns the most likely organism for each entry of this protein. Second, we
find a UniProt accession number (Bairoch, Apweiler et al. 2005) for each identified protein
followed by grouping the proteins/genes with the same accession number into a
protein/gene entity. Third we search for the organisms missed by NLProt using expanded
versions of our host and pathogen organism dictionaries that include synonyms for each