Ebook Making sense of the ECG (3rd edition): Part 2
Bạn đang xem bản rút gọn của tài liệu. Xem và tải ngay bản đầy đủ của tài liệu tại đây (7.35 MB, 158 trang )
8
The QRS complex
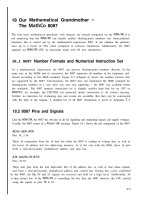
Normal QRS complexes have a different appearance in each of
the 12 ECG leads (Fig. 8.1).
I
aVR
V1
V4
II
aVL
V2
V5
Fig. 8.1 Normal 12-lead ECG
III
aVF
V3
V6
Key point:
● appearance of QRS complex
varies from lead to lead
When reviewing an ECG, look carefully at the size and shape of
the QRS complexes in each lead and ask yourself the following
four questions:
●
●
Are any R or S waves too big?
Are the QRS complexes too small?
135
MAKING SENSE OF THE ECG
●
●
Are any QRS complexes too wide?
Are any QRS complexes an abnormal shape?
In this chapter, we will help you to answer these questions and
to interpret any abnormalities you may find.
● Are any R or S waves too big?
The height of the R wave and depth of the S wave vary from
lead to lead in the normal ECG (as Fig. 8.1 shows). As a rule, in
the normal ECG:
●
●
●
●
●
the R wave increases in height from lead V1 to V5
the R wave is smaller than the S wave in leads V1 and V2
the R wave is bigger than the S wave in leads V5 and V6
the tallest R wave does not exceed 25 mm in height
the deepest S wave does not exceed 25 mm in depth.
Always look carefully at the R and S waves in each lead, and check
whether they conform to these criteria. If not, first of all consider:
●
ECG calibration (should be 1 mV ϭ 10 mm).
If the calibration is correct, consider whether your patient has
one of the following:
●
●
●
●
●
left ventricular hypertrophy
right ventricular hypertrophy
posterior myocardial infarction
Wolff–Parkinson–White syndrome
dextrocardia.
Each of these conditions is discussed below.
If the QRS complex is also abnormally wide, think of:
●
bundle branch block (discussed later in this chapter).
Left ventricular hypertrophy
Hypertrophy of the left ventricle causes tall R waves in the
leads that ‘look at’ the left ventricle – I, aVL, V5 and V6 – and
136
There are many criteria for the ECG diagnosis of left ventricular hypertrophy, with varying sensitivity and specificity.
Generally, the diagnostic criteria are quite specific (if the
criteria are present, the likelihood of the patient having left
ventricular hypertrophy is Ͼ90 per cent), but not sensitive
(the criteria will fail to detect 40–80 per cent of patients
with left ventricular hypertrophy). The diagnostic criteria
include:
●
●
8: The QRS complex
the reciprocal (‘mirror image’) change of deep S waves in leads
that ‘look at’ the right ventricle – V1 and V2.
In the limb leads:
– R wave greater than 11 mm in lead aVL
– R wave greater than 20 mm in lead aVF
– S wave greater than 14 mm in lead aVR
– sum of R wave in lead I and S wave in lead III greater
than 25 mm.
In the chest leads:
– R wave of 25 mm or more in the left chest leads
– S wave of 25 mm or more in the right chest leads
– sum of S wave in lead V1 and R wave in lead V5 or V6
greater than 35 mm (Sokolow–Lyon criterion)
– sum of tallest R wave and deepest S wave in the chest
leads greater than 45 mm.
The Cornell criteria involve measuring the S wave in lead V3
and the R wave in lead aVL. Left ventricular hypertrophy
is indicated by a sum of Ͼ28 mm in men and Ͼ20 mm in
women.
The Romhilt–Estes scoring system allocates points for the
presence of certain criteria. A score of 5 indicates left ventricular hypertrophy and a score of 4 indicates probable left ventricular hypertrophy. Points are allocated as follows:
●
3 points – for (a) R or S wave in limb leads of 20 mm or
more, (b) S wave in right chest leads of 25 mm or more, or
(c) R wave in left chest leads of 25 mm or more
137
MAKING SENSE OF THE ECG
●
●
●
●
●
3 points – for ST segment and T wave changes (‘typical
strain’) in a patient not taking digitalis (1 point with digitalis)
3 points – for P-terminal force in V1 greater than 1 mm
deep with a duration greater than 0.04 s
2 points – for left axis deviation (beyond –15º)
1 point – QRS complex duration greater than Ͼ0.09 s
1 point – intrinsicoid deflection (the interval from the start
of the QRS complex to the peak of the R wave) in V5 or V6
greater than 0.05 s.
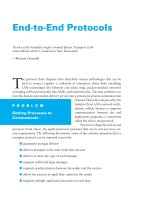
Figure 8.2 shows the ECG of a patient with left ventricular
hypertrophy.
Fig. 8.2 Left
ventricular
hypertrophy
Key points:
● 41 mm R wave in
lead V5
● 35 mm S wave in
lead V2
138
●
●
ST segment depression
T wave inversion.
(See Figure 9.16 for an example of left ventricular hypertrophy
with ‘strain’.)
8: The QRS complex
If there is no evidence of left ventricular hypertrophy on the
ECG, look for evidence of ‘strain’:
Echocardiography is diagnostic for left ventricular hypertrophy. The treatment is usually that of the cause (Table 8.1).
Table 8.1 Causes of left ventricular hypertrophy
●
●
●
●
Hypertension
Aortic stenosis
Coarctation of the aorta
Hypertrophic cardiomyopathy
Right ventricular hypertrophy
Right ventricular hypertrophy causes a ‘dominant’ R wave
(i.e. bigger than the S wave) in the leads that ‘look at’ the right
ventricle, particularly V1. Right ventricular hypertrophy is also
associated with:
●
●
●
right axis deviation (see Chapter 4)
deep S waves in leads V5 and V6
right bundle branch block (RBBB).
and, if ‘strain’ is present:
●
●
ST segment depression
T wave inversion.
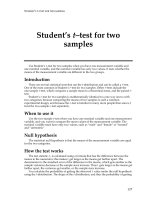
Figure 8.3 shows the ECG of a patient with right ventricular
hypertrophy and ‘strain’.
If you suspect right ventricular hypertrophy, look for an underlying cause (Table 8.2). The treatment of right ventricular hypertrophy is that of the underlying cause.
Posterior myocardial infarction
Posterior myocardial infarction is one of the few causes of a
‘dominant’ R wave in lead V1 (Table 8.3).
139
MAKING SENSE OF THE ECG
I
aVR
II
III
aVL
aVF
V1
V2
V3
V4
V5
V6
Fig. 8.3 Right
ventricular
hypertrophy with
‘strain’
Key points:
● dominant R wave in
lead V1
● deep S waves in
leads V5 and V6
● right axis deviation
● ST segment
depression/T wave
inversion in leads
V1–V3
Table 8.2 Causes of right ventricular hypertrophy
●
●
Pulmonary hypertension
Pulmonary stenosis
Table 8.3 Causes of a ‘dominant’ R wave in lead V1
●
●
●
Right ventricular hypertrophy
Posterior myocardial infarction
Wolff–Parkinson–White syndrome (left-sided accessory pathway)
Infarction of the posterior wall of the left ventricle leads to
reciprocal changes when viewed from the perspective of the
anterior chest leads. Thus, the usual appearances of pathological
140
The management of acute myocardial infarction is discussed in
detail in Chapter 9.
I
aVR
V1
V4
II
aVL
V2
V5
8: The QRS complex
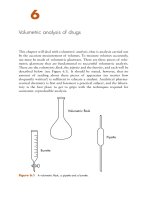
Q waves, ST segment elevation and inverted T waves will
appear as R waves, ST segment depression and upright, tall
T waves when viewed from leads V1–V3 (Fig. 8.4).
Fig. 8.4 Posterior
myocardial infarction
III
aVF
V3
V6
Key points:
● R waves in leads
V1–V3
● ST segment
depression in leads
V1–V3
ACT QUICKLY
Acute myocardial infarction is a medical emergency.
Prompt diagnosis and treatment are essential.
141
MAKING SENSE OF THE ECG
Wolff–Parkinson–White syndrome
If you see a dominant R wave in leads V1–V3 in the presence of
a short PR interval, think of Wolff–Parkinson–White syndrome
(p. 114). Patients with Wolff–Parkinson–White syndrome have
an accessory pathway (the bundle of Kent) that bypasses the
atrioventricular node and bundle of His to connect the atria
directly to the ventricles.
The position of the accessory pathway can be accurately localized only with electrophysiological studies. Generally, however, a dominant R wave in leads V1–V3 indicates a left-sided
accessory pathway, whereas a dominant S wave in leads V1–V3
indicates a right-sided accessory pathway.
The management of Wolff–Parkinson–White syndrome is
discussed in Chapter 6.
Dextrocardia
In dextrocardia, the heart lies on the right side of the chest
instead of the left. The ECG does not show the normal progressive increase in R wave height across the chest leads; instead,
the QRS complexes decrease in height across them (Fig. 8.5).
In addition, the P wave is inverted in lead I and there is right
axis deviation. Right-sided chest leads will show the pattern
normally seen on the left.
If you suspect dextrocardia, check the location of the patient’s
apex beat. A chest radiograph is diagnostic. No specific treatment
is required for dextrocardia, but ensure the condition is
highlighted in the patient’s notes and check for any associated
syndromes (e.g. Kartagener’s syndrome – dextrocardia,
bronchiectasis and sinusitis).
● Are the QRS complexes too small?
Small QRS complexes indicate that relatively little of the voltage generated by ventricular depolarization is reaching the
142
8: The QRS complex
Fig. 8.5 Dextrocardia
Key point:
● decrease in R wave
height across chest
leads
ECG electrodes. Although criteria exist for the normal upper
limit of QRS complex size, there are no similar guidelines for
the lower limit of QRS size.
Small QRS complexes may simply reflect a variant of normal.
However, always check for:
●
ECG calibration (should be 1 mV ϭ 10 mm).
Also check whether the patient has:
●
●
obesity
emphysema.
143
MAKING SENSE OF THE ECG
Both of these conditions increase the distance between the
heart and the chest electrodes.
However, if the QRS complexes appear small, and particularly
if they have changed in relation to earlier ECG recordings,
always consider the possibility of:
●
pericardial effusion.
This is discussed below.
Pericardial effusion
Pericardial effusion reduces the voltage of the QRS complexes
(Fig. 8.6).
Fig. 8.6 Pericardial
effusion
Key point:
● small QRS complexes
144
8: The QRS complex
Pericardial effusion can also cause electrical alternans, in which
the height of the R waves and/or T waves alternates from beat
to beat (Fig. 8.7).
Fig. 8.7 Electrical alternans in pericardial effusion
Key point:
●
variation in beat-to-beat R wave
height
Pericardial effusion may be asymptomatic when small. Larger
effusions cause breathlessness and, ultimately, cardiac tamponade. The presence of Beck’s triad indicates major cardiac
compromise:
●
●
●
low blood pressure
elevated jugular venous pressure
impalpable apex beat.
In addition, the heart sounds are soft and there may be pulsus
paradoxus (a marked fall in blood pressure on inspiration). The
combination of small QRS complexes, electrical alternans and
a tachycardia is a highly specific, but insensitive, indicator of a
pericardial tamponade.
145
MAKING SENSE OF THE ECG
In a patient with a pericardial effusion, the chest radiograph
may show a large globular heart but with no distension of the
pulmonary veins. The echocardiogram is diagnostic.
Obtain the advice of a cardiologist immediately, particularly
if the effusion is causing haemodynamic impairment. Urgent
pericardial aspiration is required if the signs of tamponade are
present, but should only be undertaken by, or under the guidance of, someone experienced in the procedure.
ACT QUICKLY
Cardiac tamponade is a medical emergency. Prompt
diagnosis and treatment are essential.
● Are any QRS complexes too wide?
The QRS complex corresponds to depolarization of the ventricles, and this normally takes no longer than 0.12 s from start
to finish. Thus, the width of a normal QRS complex is no
greater than 3 small squares on the ECG.
Widening of the QRS complex is seen if conduction through
the ventricles is slower than normal, and this usually means
that depolarization has taken an abnormal route through the
ventricles, as happens in:
●
●
bundle branch block
ventricular rhythms.
These conditions are discussed below.
Widening of the QRS complex can also result from the abnormal mechanism of depolarization that occurs with:
●
hyperkalaemia.
Hyperkalaemia is discussed in detail on page 187.
146
After leaving the bundle of His, the conduction fibres divide
into two pathways as they pass through the interventricular
septum – the left and right bundle branches, which supply the
left and right ventricles, respectively.
A block of either of the bundle branches delays the electrical
activation of its ventricle, which must instead be depolarized
indirectly via the other bundle branch. This prolongs the
process of ventricular depolarization, and so the QRS complex
is wider than 3 small squares. In addition, the shape of the
QRS complex is distorted because of the abnormal pathway of
depolarization.
8: The QRS complex
Bundle branch block
In left bundle branch block (LBBB), the interventricular septum has to depolarize from right to left, a reversal of the normal pattern. This causes a small Q wave in lead V1 and a small
R wave in lead V6 (Fig. 8.8). The right ventricle is depolarized
normally via the right bundle branch, causing an R wave in lead
V1 and an S wave in lead V6 (Fig. 8.9). Then, the left ventricle is
depolarized by the right, causing an S wave in lead V1 and
another R wave (called RЈ) in lead V6 (Fig. 8.10).
Thus, the ECG of a patient with LBBB appears as in
Figure 8.11.
Fig. 8.8 Left
bundle branch
block (1)
Key points:
● septal
depolarization
occurs from
right to left
● small Q wave
in lead V1
● small R wave
in lead V6
147
MAKING SENSE OF THE ECG
Fig. 8.9 Left
bundle branch
block (2)
Key points:
● right ventricle
depolarizes
normally
● R wave in
lead V1
● S wave in
lead V6
Fig. 8.10 Left
bundle branch
block (3)
Key points:
● left ventricle
depolarizes late
(by the right
ventricle)
● S wave in lead V1
● RЈ wave in lead
V6
In right bundle branch block, the interventricular septum
depolarizes normally, from left to right, causing a tiny R wave in
lead V1 and a small ‘septal’ Q wave in lead V6 (Fig. 8.12). The left
ventricle is depolarized normally via the left bundle branch,
causing an S wave in lead V1 and an R wave in lead V6 (Fig. 8.13).
Then, the right ventricle is depolarized by the left, causing
another R wave (called RЈ) in lead V1 and an S wave in lead V6
(Fig. 8.14).
148
8: The QRS complex
Fig. 8.11 Left bundle
branch block
Key points:
● broad QRS
complexes
● QRS morphology as
explained in text
Thus, the ECG of a patient with RBBB appears as in
Figure 8.15.
An aide-mémoire
Remembering the name ‘William Morrow’ should help
you recall that:
• In LBBB, the QRS looks like a ‘W’ in lead V1 and an ‘M’
in lead V6 (William).
• In RBBB, the QRS looks like an ‘M’ in lead V1 and a
‘W’ in lead V6 (Morrow).
149
MAKING SENSE OF THE ECG
Fig. 8.12 Right bundle branch block (1)
Key points:
●
●
●
septal depolarization occurs from left to right
small R wave in lead V1
small ‘septal’ Q wave in lead V6
Fig. 8.13 Right bundle branch block (2)
Key points:
●
●
●
left ventricle depolarizes normally
S wave in lead V1
R wave in lead V6
The presence of LBBB is almost invariably an indication of
underlying pathology (Table 8.4), and the patient should
be assessed accordingly. LBBB can be the presenting ECG feature of acute myocardial infarction, and is an indication for
150
Key points:
● right ventricle
depolarizes late
(by the left
ventricle)
● RЈ wave in lead
V1
● S wave in lead V6
I
aVR
V1
V4
II
aVL
V2
V5
8: The QRS complex
Fig. 8.14 Right
bundle branch
block (3)
Fig. 8.15 Right
bundle branch block
III
aVF
V3
V6
Key points:
● broad QRS
complexes
● QRS morphology
as explained
in text
151
MAKING SENSE OF THE ECG
Table 8.4 Causes of left bundle branch block
●
●
●
●
Ischaemic heart disease
Cardiomyopathy
Left ventricular hypertrophy
– Hypertension
– Aortic stenosis
Fibrosis of the conduction system
thrombolysis. The presence of LBBB renders interpretation of
the ECG beyond the QRS complex impossible.
In contrast with LBBB, RBBB is a relatively common finding
in otherwise normal hearts. However, it too can result from
underlying disease (Table 8.5) and should be investigated
according to the clinical presentation.
Table 8.5 Causes of right bundle branch block
●
●
●
●
●
Ischaemic heart disease
Cardiomyopathy
Atrial septal defect
Ebstein’s anomaly
Pulmonary embolism (usually massive)
Bundle branch block (particularly RBBB) can also occur at fast
heart rates. This is not uncommonly seen during supraventricular tachycardia (SVT), and the resultant broad complexes can
lead to an incorrect diagnosis of ventricular tachycardia (VT)
by the unwary. For help in distinguishing between VT and
SVT, see page 74.
Both LBBB and RBBB are asymptomatic in themselves, and do
not require treatment in their own right. Even so, they should
prompt you to look for an underlying cause that is appropriate
to the patient’s presentation.
Ventricular rhythms
When depolarization is initiated from within the ventricular
muscle itself, the wave of electrical activity has to spread from
152
8: The QRS complex
myocyte to myocyte rather than using the more rapid Purkinje
network. This prolongs the process of ventricular depolarization and thus widens the QRS complex (Fig. 8.16).
II
ventricular ectopic
Fig. 8.16 Ventricular ectopic
Key points:
●
●
broad QRS complex
complex occurs earlier than expected
For more information about ventricular rhythms, and help
with their identification, see Chapter 3.
● Are any QRS complexes an
abnormal shape?
Most of the causes of an abnormally shaped QRS complex have
been discussed earlier in this chapter. However, occasionally
you will encounter QRS complexes that just appear unusual,
without fitting any of the specific criteria mentioned above.
You may see complexes which appear ‘slurred’, or have an
abnormal ‘notch’, without necessarily being abnormally tall,
small or wide. If this is the case, consider the following possible
causes:
●
●
●
incomplete bundle branch block
fascicular block
Wolff–Parkinson–White syndrome.
Further information on each of these can be found below.
153
MAKING SENSE OF THE ECG
Incomplete bundle branch block
Bundle branch block is discussed earlier in this chapter.
Sometimes, however, conduction down a bundle branch can be
delayed without being blocked entirely. When this happens, the
QRS complex develops an abnormal shape but the complex
remains less than 3 small squares wide. This is called incomplete (or partial) bundle branch block, and can affect either the
left or the right bundle branches (Figs. 8.17 and 8.18).
I
aVR
V1
V4
II
aVL
V2
V5
Fig. 8.17
Incomplete left
bundle branch block
III
aVF
V3
V6
Key points:
● left bundle branch
block morphology
● QRS duration is
0.11s
The causes of incomplete bundle branch block are the same
as those of complete bundle branch block, discussed earlier
in this chapter.
154
aVR
V1
V4
II
aVL
V2
V5
8: The QRS complex
I
Fig. 8.18 Incomplete
right bundle branch
block
III
aVF
V3
V6
Key points:
● right bundle
branch block
morphology
● QRS duration is
0.11s
Fascicular block
Block of one of the two fascicles of the left bundle causes either
left or right axis deviation (Chapter 4). The consequent delay
to conduction may also lead to slurring or notching of the QRS
complex.
How to identify which fascicle is affected, and manage the
patient subsequently, is discussed in Chapter 4.
Wolff–Parkinson–White syndrome
Patients with Wolff–Parkinson–White syndrome characteristically exhibit a delta wave that slurs the upstroke of the QRS
155
MAKING SENSE OF THE ECG
complex (see Fig. 6.4, p. 115). This diagnosis should be suspected if, in addition, the PR interval is abnormally short. For
more information on the diagnosis and management of
Wolff–Parkinson–White syndrome, see page 114.
Summary
To assess the QRS complex, ask the following questions:
1. Are any R or S waves too big?
If ‘yes’, consider:
●
●
●
●
●
●
incorrect ECG calibration
left ventricular hypertrophy
right ventricular hypertrophy
posterior myocardial infarction
Wolff–Parkinson–White syndrome (left-sided accessory
pathway)
dextrocardia.
Also:
●
bundle branch block.
2. Are the QRS complexes too small?
If ‘yes’, consider:
●
●
●
●
incorrect ECG calibration
obesity
emphysema
pericardial effusion.
3. Are any QRS complexes too wide?
If ‘yes’, consider:
●
●
156
bundle branch block
ventricular rhythms.
●
hyperkalaemia.
4. Are any QRS complexes an abnormal shape?
If ‘yes’, consider:
●
●
●
incomplete bundle branch block
fascicular block
Wolff–Parkinson–White syndrome.
8: The QRS complex
Also:
157
The ST segment
9
The ST segment lies between the end of the S wave and the
start of the T wave. Normally, the ST segment is isoelectric,
meaning that it lies at the same level as the ECG’s baseline, the
horizontal line between the end of the T wave and the start of
the P wave (Fig. 9.1).
Fig. 9.1 The ST segment
Key point:
●
ST segment is normally isoelectric
ST segments can be abnormal in one of three ways, so the
questions you need to ask about the ST segments when you
review them are:
●
●
●
Are the ST segments elevated?
Are the ST segments depressed?
Are J waves present?
In this chapter, we will help you to answer these questions, and
guide you about what to do next if you find an abnormality.
158
Look carefully at the ST segment in each lead to see if it is
isoelectric. If it is raised above this level, the ST segment is
elevated.
ST segment elevation should never be ignored, as it often indicates a serious problem that warrants urgent attention. If you
see ST elevation in any lead, consider the following possible
diagnoses:
●
●
●
●
●
●
●
9: The ST segment
● Are the ST segments elevated?
ST segment elevation acute coronary syndrome
left ventricular aneurysm
Prinzmetal’s (vasospastic) angina
pericarditis
high take-off
left bundle branch block
Brugada syndrome.
Therefore, ST segment elevation can represent anything from
a potentially life-threatening condition to a normal variant,
making it particularly important to identify the cause. To help
you in this task, we describe each of these conditions (together
with example ECGs) below.
ST segment elevation acute coronary
syndrome
Patients presenting with acute coronary ischaemic syndromes
have traditionally been divided into those with myocardial infarction and those with unstable angina. The problem with this is
that a diagnosis of myocardial infarction requires the detection of
myocardial damage, usually shown by a rise in circulating levels
of markers of myocyte necrosis (e.g. troponin T or I, creatine
kinase), and this takes time. It can take 12 hours for levels of cardiac markers to rise markedly. However, important therapeutic
decisions need to be taken early on. A more helpful way of categorizing acute coronary syndromes is on the basis of the presenting ECG changes, and in particular whether ST segment elevation
159