Charging for Network Security Based on Long-Run Incremental Cost Pricing
Bạn đang xem bản rút gọn của tài liệu. Xem và tải ngay bản đầy đủ của tài liệu tại đây (468.18 KB, 8 trang )
1686
IEEE TRANSACTIONS ON POWER SYSTEMS, VOL. 24, NO. 4, NOVEMBER 2009
Charging for Network Security Based
on Long-Run Incremental Cost Pricing
Hui Yi Heng, Student Member, IEEE, Furong Li, Senior Member, IEEE, and Xifan Wang, Fellow, IEEE
Abstract—Pricing for the use of the networks is essential in the
way that it should be able to reflect the costs/benefits imposed on
a network when connecting a new generator or demand and to
provide forward-looking message to influence the site and size of
future network customers. Studies have been extensively carried
out over the years to achieve this pricing goal. Few methodologies
can directly link nodal generation/demand increment to network
long-run marginal/incremental costs. Even fewer consider network
security in their pricing methodologies, considering it is one of the
most important cost drivers. All networks are designed to be able
to withstand credible contingencies, but this comes at a significant
cost to network development. This paper proposes a new approach
that can establish the direct link between nodal generation/demand
increment and changes in investment cost while ensuring network
security. The investment cost is reflected by the change in the spare
capacity of a network asset from a nodal injection, which is in turn
translated into an investment horizon, leading to the change in the
present value of a future investment cost. The security is reflected
contingency analysis to define
in the pricing through a full
the maximum allowed power flow along each circuit, from which
the time horizon of future investment is determined. This paper illustrates the implementation of the proposed pricing model for a
system whose demand grows either at a uniform rate or at variable
growth rates. The benefits of introducing security into the long-run
pricing model are demonstrated on the IEEE 14-busbar system
and a practical 87-busbar distribution network.
N 1
Index Terms—Long-run incremental cost pricing, maximum
loadability, power system economics, power system security.
I. INTRODUCTION
N the U.K., privatization of the electricity supply industry
was introduced in 1990, where the underlying concepts
were to introduce competition (where competition was deemed
possible) and regulation (where competition was not considered practicable, that is, in the natural monopoly functions of
transmission and distribution). Since then, market forces are
increasingly playing an important role in the development and
operation of the electricity supply industry. The main purposes
of privatization were to promote competition (improving efficiency, thus reducing prices) and to improve the economic
performance of the electricity supply infrastructure while
maintaining the security and the quality of supply.
I
Manuscript received June 18, 2008; revised March 06, 2009. Current version
published October 21, 2009. Paper no. TPWRS-00482-2008.
H. Y. Heng and F. Li are with the Department of Electronic and Electrical Engineering, University of Bath, Bath BA2 7AY, U.K. (e-mail:
; ).
X. Wang is with the Department of Electric Power Engineering, Xi’an Jiaotong University, Shaanxi 710049, China (e-mail: ).
Color versions of one or more of the figures in this paper are available online
at .
Digital Object Identifier 10.1109/TPWRS.2009.2030301
Electricity generation shortages are a potential threat to electricity supplies. Hence, providing adequate generation to meet
demand becomes one of the key issues for the market forces in
achieving adequate security [1], [2].
The Joint Energy Security of Supply (JESS) group in the
U.K., set up in 2001 to examine energy security issues, acknowledges that competitive markets, mostly through price signals, help to provide information for consumers, suppliers, and
producers alike to see when supplies are relatively plentiful or
tight [3].
The market is designed to encourage electricity prices to rise
as the demand for additional capacity increases [2], thus encouraging new and timely generation development.
Adequate generation will require sufficient network to transport energy from points of generation to points of consumption.
With ever-rising generation/demand and limited scope in infrastructure development, maintaining network security is more
challenging than ever before for network owners/operators [4].
There are two measures that can be taken by network operators
to assure availability of network capacity and to ensure the integrity of the network, i.e., withstand credible contingencies to
maintain the integrity of the system. One is a technical measure to ensure adequate investment in transmission and distribution infrastructure (building new lines or, when feasible, upgrading existing ones) and efficient operation of the system [1],
[5]. The other is a commercial measure to have an efficient network pricing model that reflects the cost imposed on the network from new generation/demand at different locations. The
objective is to provide forward-looking economic message to
influence the site and size of future generation/demand, and to
lead to the least cost to the future network development.
The focus of this paper is on the pricing methodology for
the use of system charges. Efficient network charges should
closely reflect the extent of use of the system by network users,
thus helping to release constraints and congestion in the network, as well as be able to provide efficient economic signals for
the network expansion and reinforcement. However, the present
pricing methodology adopted by the majority of the distribution
networks—the distribution reinforcement model (DRM) in the
U.K.—does not provide locational signals as the costs are averaged at each voltage level [6]. The DRM’s inability to reflect
forward-looking costs and its inconsistency in the treatment between generation and demand increase the difficulty in facilitating the ease of connection of embedded generation.
Forward-looking network prices provide locational signals to
network users to act upon. For instance, as network prices for
demand increase, distributed generation will be incentivized to
connect and demand will be discouraged. This will help in re-
0885-8950/$26.00 © 2009 IEEE
HENG et al.: CHARGING FOR NETWORK SECURITY BASED ON LONG-RUN INCREMENTAL COST PRICING
leasing network capacity in more congested areas, and hence in
minimizing the future investment cost, which is the main factor
in a long-run network pricing methodology. Papers [7] and [8]
further illustrate how the network design (planning) process will
affect network investment costs. Network investment will increase available or usable capacity, especially from circuits that
are operating at or near their maximum capacity and hence increase reliability.
Long-run cost pricing methodologies are recognized as
more economically efficient since they reflect the cost to future
network reinforcement as a result of nodal demand/generation
increment. However, their implementation is often complicated
as they involve the allocation of the reinforcement costs among
network users [7]–[16]. Up to 2005, investment cost-related
pricing (ICRP) is the most advanced long-run pricing model,
with pricing based on distance or length of the circuits [17].
One of the recent developments in long-run cost pricing
methodology is the long-run incremental cost pricing (LRIC)
methodology, developed by the University of Bath in conjunction with Western Power Distribution (WPD) and Ofgem (the
regulator of gas and electricity markets in Great Britain) [10].
Its pricing is based on the degree of the circuits’ utilization in
addition to the circuit distance.
In terms of security, the ICRP charging model used by National Grid of the U.K. does not factor the network security requirement into the charging model; instead, it relies on postprocessing through a full-contingency analysis to give an average security factor of 1.86 for all network assets [17]. Reference [10] demonstrated a simplistic approach to network security, which is based on the assumption that reinforcement is
needed when a branch reaches its 50% utilization. The importance of network security is also acknowledged in some other
works [18]–[20], but none of them translated network security
into pricing methodology.
This paper proposes a much enhanced LRIC pricing methodology that adds a number of practical planning considerations in
the network pricing. The aim is to significantly improve the applicability of the LRIC pricing in practice. The enhanced LRIC
pricing model considers the additional power flow that circuits
contingency
or transformers have to carry under a full
analysis when pricing the cost of circuits and transformers. This
will be contrasted with that from [10] where all assets were
assumed to carry an equal amount of additional contingency
power flow. The enhanced model also takes into account the
effects from differing nodal load growth as seen by planning
engineers, instead of a uniform growth rate across the entire network as assumed in [10]. Using the IEEE 14-bus test system and
a practical 87-bus distribution network, this paper demonstrates
the efficiency of the enhanced LRIC pricing through the comparison in the locational LRIC prices and the resultant revenue
recoveries.
In Section II, the basic LRIC pricing methodology is introduced. The principle and the implementation of the enhanced
contingenLRIC pricing methodology considering full
cies and variable nodal growth rates are presented in Section III.
The locational prices and revenue recoveries from the two LRIC
pricing methodologies are then illustrated and compared on the
IEEE 14-bus test system and a practical distribution network
1687
in Sections IV and V, respectively. Finally, Section VI summarizes the contribution of this paper and identifies possible further
work.
II. LONG-RUN INCREMENTAL COST (LRIC) PRICING
Paper [10] proposed the first long-run charging methodology
that links the nodal generation/demand increment to changes in
circuits and transformers’ investment horizon, which is in turn
translated into long-run investment cost. The investment horizon
is dictated by the present loading level, the load growth rate and
circuits’ or transformers’ spare capacity.
In other words, the LRIC model reflects the asset costs of
meeting an increment of generation or demand, which for lines
and cables will be a function of distance and also the degree of
utilization. For a given load growth rate of a circuit, , the time
horizon, , will be the time taken for the load to grow from
current loading level of the circuit, , to its full loading level,
, as shown in (1). Rearranging (1) gives the equation for time
to reinforce (1):
(1)
(2)
If there is an injection from node , causing power flow
change along a circuit to rise by
, then this will advance or delay the future reinforcement, leading to new time
horizonto reinforce. The circuit’s long-run incremental
cost is the change of its present values
with and without
the increment of load, and is then determined using (4):
(3)
(4)
is the asset investment cost,
where is the discount rate,
and is the time horizon to reinforcement decision. If there is
a total of m circuits supporting the power injection from node
, then the long-run incremental cost for node
will
be the summation of the changes of present value from all supporting circuits over its nodal injection
, as represented
by (5):
(5)
As mentioned in [14], the LRIC pricing methodology recognizes not only the “distance” power must travel to meet demand
but also the degree of circuits’ utilization. However, this pricing
model does not account for the network security cost required to
withstand
contingencies. This would result in less cost-reflective economical signals for future demand and generation
siting, which can further jeopardize the efficiency in network
investment.
III. LRIC-SECURITY
All networks are designed to be able to withstand credible
contingencies, but this comes at a significant cost to network development. For network pricing using LRIC, it is very important
to recognize that a significant proportion of the network spare
1688
IEEE TRANSACTIONS ON POWER SYSTEMS, VOL. 24, NO. 4, NOVEMBER 2009
Fig. 1. Two-bus test system.
capacity is reserved for network security. The spare capacity
in the LRIC calculation should reflect the maximum allowed
loading level for a network asset subject to
contingencies, rather than its rated capacity.
The critical or maximum allowed loading point could either
be triggered by a thermal or bus voltage limit or a voltage stability limit (voltage collapse point) [4]. This proposed LRIC
pricing places emphasis on assets thermal limits. In the proposed
methodology, a security factor for each and every circuit and
transformer of the network is obtained by performing an
contingency analysis, where the outage of the most critical circuit is considered.
A. Security Factor With Uniform Load Growth Rate
Fig. 1 shows a busbar system, where Line 1 has a 30-MW flow
and Line 2 20 MW flow when there is a 50-MW load connected
at busbar 2, assuming no losses. For this simple case, Line 2
outage is the only and the most critical outage for Line 1 and
vice versa. We can easily see that when one line is out, the other
line will have to carry all the 50-MW power flow to maintain the
security of supply. By knowing the power flow at Line 1 during
its most critical outage, the security factor (S.F.) of Line 1 can
be evaluated using (6):
(6)
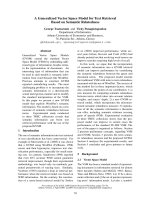
Likewise, security factor of Line 2 will be 2.5. Fig. 2 shows
the simplified flow chart for security factor calculation.
Fig. 2. Simplified flow chart to calculate security factor.
Knowing their respective circuit load growth rate, , the relationship of the base power flow across the critical line over the
base power flow of the examined line can then be found through
(9), where
and
are the load growth rates of Circuit A and
Circuit B, respectively.
and
are computed by examining
the power flow change at each circuit as a result of the load increase by a given growth rate:
(9)
(10)
Security factor as the ratio of a circuit’s worst outage loading
level to its original loading level for variable load growth rates
can then be redefined in (11). The maximum allowed loading
level for Circuit B can then be evaluated by dividing its rated
capacity with the S.F.:
(11)
B. Security Factor With Different Load Growth Rate
Equation (6) assumes uniform load growth rate along each
circuit of the network. In reality, different nodes may grow at
different rates, leading to potentially very different growth rate
for circuits.
If Circuit A is the worst outage for Circuit B, the outage power
flow at Circuit B,
, is the sum of the additional contingency flow and the original flow at Circuit B,
, where the
additional flow at Circuit B is the re-distribution of the original flow of Circuit A when it is out. To account for different
load growth rate, a line outage distribution factor (LODF) [21]
that defines the size of this re-distribution is introduced into the
equation, shown in (7) and (8):
(7)
(8)
C. LRIC Considering Network Security
LRIC pricing reflects how a nodal increment might advance
or defer the time horizon of future investment. For a given load
growth rate, the time horizon of future reinforcement is the time
taken for the circuit’s loading level rise from the present level to
the maximum allowed power flow. To provide efficient long-run
signals for future investment and to account for the cost of maintaining the security of supply, it is necessary to find the appropriate requirement of reinforcement for the network circuits.
This can be done by adding a security factor in the basic LRIC
pricing model.
The rating of the circuit at the design stage is influenced by security factor, which is impacted by the critical outage condition
seen by the circuit. With the security factor term, it will make
sure that sufficient spare capacity is allocated to ensure network
security under the
contingent situation.
HENG et al.: CHARGING FOR NETWORK SECURITY BASED ON LONG-RUN INCREMENTAL COST PRICING
1689
TABLE I
CIRCUITS WITH THEIR HIGHEST UTILIZATION HIGHLIGHTED AT THEIR CRITICAL OUTAGE CONDITION
at 33-kV voltage level. The peak demand of the system is 260
MW [22].
security assessment, the security factor
By running an
of each lines and transformers are obtained. LRIC charges with
and without any security consideration are then compared.
A. Security Factor and Maximum Allowed Loading Level
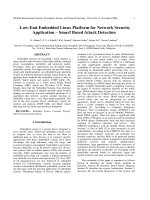
Fig. 3. IEEE 14-bus test system.
For a given load growth rate , the time horizon of future investment will be the time taken for the load to grow from current loading level
to the maximum or requirement of reinforcement loading margin (under
contingency),
,
instead of , the full loading level (rated capacity). The time
horizon, present value of the assets, and finally the new LRIC
cost are then obtained, with the S.F. term:
(12)
IV. CASE STUDY 1
This section compares the proposed approach with the basic
LRIC pricing on the IEEE 14-bus test system shown in Fig. 3.
The system consists of 14 buses, 17 lines, three transformers,
two generators, and three synchronous condensers. Buses 1, 2,
3, 4, and 5 are at 132-kV voltage level and the other buses are
Table I shows 18 valid outage conditions and their respective
impacts to the degree of assets’ utilization. For example, line
connecting Bus 1 to Bus 2 has its utilization raised from 47.63%
to 72.22% (the most critical) as a result of Outage L2 (outage of
the line connecting Bus 1 to Bus 5).
Tables II and III show the results of the maximum allowed
loading level (MALL) of the lines and transformers and their
respective security factor for each asset. For a uniform growth
rate, the security factor generated from the maximum allowed
power flow and the base flow varies widely from 1.00 to 7.54.
The will significantly impact on the time horizon of future reinforcement, which will in turn impact on the long-run locational
prices. This also implies that long-run cost evaluation without
security consideration (i.e., considering S.F. equals to 1) is considerably under-evaluating the cost to the network from a nodal
increment.
Fig. 4 depicts the maximum allowed loading level for each
contingency analysis, and its rated capacity.
line, from the
Fig. 4 suggests that this maximum allowed loading level, under
contingency, could be hugely different compared to the
rated capacity. For instance, Line 6, i.e., the line connecting Bus
3 to Bus 4, has a MALL value of 32.83 MVA which is just a
quarter of its rated capacity.
According to Table I, the worse outage that caused a large
contingency flow (75.1 MVA) on Line 6 is Outage L3 (the line
connecting Bus 2 to Bus 3). Line 3 has an original flow of 72.3
MVA, and the highest power flow in the network. When Line 3
is out, Line 6 has to carry all the power flow to supply the load at
Bus 3 (Fig. 5). This means that about 75% of Line 6’s capacity
1690
IEEE TRANSACTIONS ON POWER SYSTEMS, VOL. 24, NO. 4, NOVEMBER 2009
TABLE II
MAXIMUM ALLOWED LOADING LEVELS AND SECURITY FACTOR FOR LINES
Fig. 5. Directions of the power flow for the 132-kV part of the system.
Fig. 6. LRIC charges (for real power, P) comparison with and without security
factor (using LRIC).
TABLE III
MAXIMUM ALLOWED LOADING LEVELS AND SECURITY FACTOR
FOR TRANSFORMERS
Fig. 7. Directions of the power flow for the 33-kV part of the system.
B. Long-Run Incremental Cost Pricing
Fig. 4. Maximum allowed loading level with and without security consideration.
needs to be reserved to accommodate power flow at L3 should
this line be out.
The lesser the MALL, the smaller will be the spare capacity,
the future reinforcement will be closer, and this will give rise to
the reinforcement cost of the asset.
The significant difference of the MALL and the rated capacity
of Line 6 are immediately reflected in the LRIC price at Bus 3
(Fig. 6), which is supported by Lines 3 and 6.
This is followed by the prices at Buses 13 and 14, which are
supported by the line with the highest security factor (Line 16).
The LRIC price at Bus 14 is greater than that of Bus 13 due
to the way that power distributed at the distribution level. As
shown by Fig. 7, power flows into Bus 13 through Line 10 and
16 and flows out to Bus 14 through line 17. Therefore, a load
withdrawal at Bus 14 causes a power flow increase on all three
supporting lines. As for Bus 13, a load withdrawal at the point
has increased power flow for line 10 and 16 but decreased power
flow for line 17, and hence reduces prices. This further reinforces the finding in [23].
Fig. 8 shows reactive power prices against each node in
the network. LRIC prices for reactive power is based on the
MW+MVAr-Mile method presented in [24]. The figure shows
HENG et al.: CHARGING FOR NETWORK SECURITY BASED ON LONG-RUN INCREMENTAL COST PRICING
1691
TABLE IV
REVENUE RECOVERY TABLE WITHOUT SECURITY CONSIDERATION
for network security from the effective spare capacity, providing
more cost-reflective long-run pricing in network charges.
C. Revenue Recovery
Fig. 8. LRIC charges (for reactive power,
security factor (using LRIC).
Q) comparison with and without
the impact to the long-run network reinforcement cost from a
unit MVAr injection at each study node.
Without security factor, all the prices for the reactive power
(Fig. 8) are small negative values. This suggests that there is excessive reactive power in the system, which is not the case when
the network is required to withstand all
contingencies.
With security factor, Bus 2 has a large negative price. This is
due to the counter flow created in line 1 as the result of a reactive
power injection at Bus 2. This effect is shown in Fig. 5.
The LRIC charge at Bus 3 has the largest negative value as
a reactive power injection at Bus 3 has a large impact to the
network, causing counter flows on Lines 1, 4, 6, and 7.
The prices shown in Figs. 6 and 8 depict the price for load. As
for generation, the prices are obtained by applying an increment
of generation at each node. Hence, the generation prices are the
negative of the load prices that reflect the opposite effects in
reinforcement horizon as a result of nodal generation increment.
Generally, the results suggest that the prices for LRIC without
security factor are significantly smaller but less cost-reflective
compared to the prices with security factor. When the network
security is not being taken into account in the cost evaluation
by the original LRIC pricing model, the circuit loading level
is allowed to reach to its rated capacity. As for the new LRIC
methodology, the pricing is able to separate the spare capacity
Table V summarizes nodal generation/demand, nodal real and
reactive power prices, and the revenue recovery without considering security, while Table V gives the results considering
security. With significantly higher prices, the LRIC methodology with security factor can recover considerably more revenue, rising from 10.4% to 91.4%. This would leave less room
for revenue reconciliation, and hence, less distortion to the pure
economic message.
For the basic LRIC methodology, generation (at Bus 2) collects $
per year while load across the network pays
£917 652 per year after revenue recovery. As for LRIC with
security consideration, generation earnings increase by around
fivefold to $
per year and load payments increase to
£8 003 684 per year.
V. CASE STUDY 2
To demonstrate its practicality, the proposed approach is
applied on an 87-bus practical distribution network shown in
Fig. 9. This network consists of 56 lines, 54 transformers, and
three generators. The lines consist of both overhead lines and
underground cables. The underground cables have much higher
cost per km compared to the overhead lines. The and LRIC
charges with and without security factor are shown in Figs. 10
and 11.
As shown in Fig. 10, the highest price for real power withdrawal (for LRIC-security) is at Bus 3009 where the main supporting line, line connecting Buses 2015 and 3012, is the longest
line in the network, 20.9 km. Nevertheless, the length of the line
is not the only factor affecting the price. For instance, load at
Bus 3015 supported by another long line (20.1 km) is charged
much less. This is because the main supporting branches of Bus
3015 have to support relatively a small proportion of contingency flow, which consequently results in large spare capacity
1692
IEEE TRANSACTIONS ON POWER SYSTEMS, VOL. 24, NO. 4, NOVEMBER 2009
TABLE V
REVENUE RECOVERY TABLE WITH SECURITY CONSIDERATION
Fig. 11. LRIC charge (for reactive power,
security factor.
Q) comparison with and without
TABLE VI
DATA OF THE MAIN SUPPORTING BRANCHES OF BUS 3009
Fig. 9. The 87-bus practical distribution network.
TABLE VII
DATA OF THE MAIN SUPPORTING BRANCHES OF BUS 3015
Fig. 10. LRIC charge (for real power, P) comparison with and without security
factor.
and small effective circuit utilizations (Table VII), compared to
those of Bus 3009 (Table VI).
The next highest price is at Bus 3054, which is mainly due to
the highly utilized (96%) single transformer that is supporting
the load. In addition, the main supporting line connecting Buses
2005 and 3057 consist of a 4.7-km underground cable. This
cable is the longest amongst all the 33-kV underground cables
and has a significant contribution to the line’s high asset cost.
The revenue recovered from using the LRIC prices without
security consideration is 7.6%, while LRIC-security recovers
45.8%, which again leaves less room for revenue reconciliation.
HENG et al.: CHARGING FOR NETWORK SECURITY BASED ON LONG-RUN INCREMENTAL COST PRICING
LRIC-security not only takes into account the length and effective utilization of the supporting branches but also leads to a
better revenue recovery that is closer to the target compared to
the basic LRIC.
VI. CONCLUSION
This paper presented a new approach to account for the cost of
security in a long-run network pricing model. The proposed approach relates the nodal increment of generation/demand to the
long-run incremental cost to a network, where the incremental
cost reflects the network security in addition to distance travelled and the degree of circuits’ utilization. For the first time,
network security can be reflected in a pricing model by adding
a security term into the methodology, which is obtained by runcontingency analysis. This security factor term
ning a full
reflects the additional power flow a branch has to carry when its
most critical contingency takes place.
The security factor would reduce the unused capacity of a
branch and thus brought forward the time horizon of the future
reinforcement, and hence increases the incremental cost. Further, it has significantly increased the revenue recovery, leaving
less room for distorting the pure economic message. In this case,
the new methodology recovers 91.4% of the revenue, which is
81% more than the LRIC methodology without security consideration for the IEEE 14-bus test system and recovers 38.2%
more revenue for the practical 87-busbar system.
In conclusion, the new pricing methodology is simple, more
cost-reflective, transparent, and able to provide more efficient
locational signals for potential generation and demand customers. This will in turn incentivize a more efficient network to
evolve in the future.
1693
[11] D. Shirmohammadi, C. Rajgopalan, E. R. Alward, and C. L. Thomas,
“Cost of transmission transactions: An introduction,” IEEE Trans.
Power Syst., vol. 6, no. 3, pp. 1006–1016, Aug. 1991.
[12] H. H. Happ, “Cost of wheeling methodologies,” IEEE Trans. Power
Syst., vol. 9, no. 1, pp. 147–156, Feb. 1994.
[13] R. R. Kovacs and A. L. Leverett, “A load flow based method for calculating embedded, incremental and marginal cost of transmission capacity,” IEEE Trans. Power Syst., vol. 9, no. 1, pp. 272–278, Feb. 1994.
[14] J. M. Lima and E. Oliveira, “The long term impact of transmission
pricing,” IEEE Trans. Power Syst., vol. 13, no. 4, pp. 1514–1520, Nov.
1998.
[15] M. T. Ponce de Leao and J. T. Saraiva, “Solving the revenue reconciliation problem of distribution network providers using long-term marginal prices,” IEEE Trans. Power Syst., vol. 13, no. 1, pp. 448–454,
Feb. 2000.
[16] A. Bakirtzis et al., “Comparison of two methods for long-run marginal
cost based transmission use of system pricing,” Proc. Inst. Elect. Eng.,
Gen., Transm., Distrib., vol. 148, no. 4, pp. 477–481, Jul. 2001.
[17] The Statement of the Use of System Charging Methodology, The
Charging Team. National Grid, U.K. [Online]. Available: http//www.
nationalgrid.com/uk/indifo/charging/pdfs.UoSC_Apr_03_(I3R0).pdf.
[18] G. Strbac and N. Jenkins, Network Security of the Future UK Electricity System, PIU, U.K., 2001. [Online]. Available: /research/theme2/Network_Security_UMIST.pdf.
[19] J. Mutale, G. Strbac, and D. Pudjianto, “Methodology for cost reflective
pricing of distribution networks with distributed generation,” in Proc.
IEEE Power Eng. Soc. General Meeting, 2007.
[20] D. Pudjianto, G. Strbac, and J. Mutale, “Access and pricing of distribution network with distributed generation,” in Proc. IEEE Power Eng.
Soc. General Meeting, 2007.
[21] R. D. Christie, B. F. Wollenberg, and I. Wangensteen, “Transmission
management in the deregulated environment,” Proc. IEEE, vol. 88, pp.
170–195, 2000.
[22] Power Systems Test Case Archive, College of Engineering, University
of Washington. [Online]. Available:
/research/pstca/.
[23] H. Y. Heng, J. Wang, and F. Li, “Comparison between long-run incremental cost pricing and investment cost-related pricing for electricity
distribution network,” in Proc. CIRED, Vienna, Austria, 2007.
[24] F. Li et al., “Development of a novel MW+MVAr-Miles charging
methodology,” in Proc. IEEE/PES Transmission and Distribution
Conf. Exhib.: Asia and Pacific, 2005.
REFERENCES
[1] C. Ray, Power System Planning: System Development—Maintaining
Security, U.K. [Online]. Available: />2004/transmission/ray2.pdf.
[2] Security of Electricity Supplies, Parliamentary Office of Science and
Technology, 2003, POSTnote 203.
[3] The Joint Energy Security of Supply Group Report, Department of
Trade and Industry, 2006.
[4] F. Milano, C. A. Canizares, and M. Invernizzi, “Multiobjective optimization for pricing system security in electricity markets,” IEEE
Trans. Power Syst., vol. 18, no. 2, pp. 596–604, May 2003.
[5] Security of Supply in Electrcity Markets- Evidence and Policy Issues,
International Energy Agency, Paris, France, 2002. [Online]. Available:
/>pdf.
[6] F. Li, N. P. Padhy, J. Wang, and B. Kuri, “Cost-benefit reflective distribution charging methodology,” IEEE Trans. Power Syst., vol. 23, no.
1, pp. 58–64, Feb. 2008.
[7] D. Shirmohammadi et al., “Some fundamental, technical concepts
about cost based transmission pricing,” IEEE Trans. Power Syst., vol.
11, no. 2, pp. 1002–1008, May 1996.
[8] P. Williams and S. Andrews, Distribution Network Connection:
Charging Principles and Options. London, U.K.: DTI, 2002.
[9] F. Li et al., Network Benefits From Introducing an Economic
Methodology for Distribution Charging, 2006. [Online]. Available:
index.jsp?section=/areasofwork/distributioncharges.
[10] F. Li and D. L. Tolley, “Long-run incremental cost pricing based on unused capacity,” IEEE Trans. Power Syst., vol. 22, no. 4, pp. 1683–1689,
Nov. 2007.
Hui Yi Heng (S’07) was born in Miri, Malaysia. She received the B.Eng. degree
in electrical and electronics engineering from the University of Bath, Bath, U.K.,
in 2005. She is currently pursuing the Ph.D. degree in the Power and Energy
System Group at the University of Bath, in the field of power system economics,
pricing, and planning.
Her major research interest is in the area of power system planning, analysis,
and power system economics.
Furong Li (M’00–SM’09) was born in Shanxi, China. She received the B.Eng.
degree in electrical engineering from Hohai University, Nanjing, China, in 1990
and the Ph.D. degree in 1997 with a dissertation on “Applications of genetic
algorithms in optimal operation of electrical power systems.”
She is a Senior Lecturer in the Power and Energy System Group at the University of Bath, Bath, U.K. Her major research interest is in the area of power
system planning, analysis, and power system economics.
Xifan Wang (SM’96–F’09) graduated from Xi’an Jiaotong University, Xi’an,
China, in 1957. He has since been with the School of Electrical Engineering of
Xi’an Jiaotong University, where he now holds the rank of Professor. His research fields include power system analysis, generation planning and transmission system planning, reliability evaluation, and power market. He has authored
and coauthored ten books and more than 200 journal and conference papers on
the above subjects.