Segmentation and classification customer payment behavior at multimedia service provider company with K-Means and C4.5 algorithm
Bạn đang xem bản rút gọn của tài liệu. Xem và tải ngay bản đầy đủ của tài liệu tại đây (766.22 KB, 11 trang )
International Journal of Computer Networks and Communications Security
VOL. 4, NO. 9, SEPTEMBER 2016, 265–275
Available online at: www.ijcncs.org
E-ISSN 2308-9830 (Online) / ISSN 2410-0595 (Print)
Segmentation and Classification Customer Payment Behavior at
Multimedia Service Provider Company with K-Means and C4.5
Algorithm
Sardjoeni Moedjiono1, Fanny Fransisca2 and Aries Kusdaryono3
1, 2, 3
Master of Computer Science, Budi Luhur University, Jakarta, Indonesia
1
, ,
ABSTRACT
Multimedia internet and television (tv) cabel service provider companies get problem with customer who
refuse to pay after using the service. It’s hard to identify solvency customer because service provider
companies do not do customer finance verification. This research use model with join k-means
segmentation and C4.5 classification algorithm because C4.5 weaknesses in difficulty to choose attributes.
Be proven that extract customer potential attributes with k-means can help to increase C4.5 classification
algorithm’s accuracy. This thing proved from the model accuracy increment from 59.02% to 77.31% and
AUC from 0.537 to 0.836. Customer potential level can also be the reference in promotion, retention, and
prevention of insolvency customer.
Keywords: Customer loyalty, C4.5 Algorithm, K-means Algorithm, Multimedia Company, Data Mining.
1
INTRODUCTION
Multimedia service provider company often has a
problem with customers who refuse to pay for the
service they used [4]. Different with bank or Loan
Company, postpaid service companies often gives
their services to customer without detail
verification, so it’s hard to know who is solvency
customer and who is insolvency customer [11].
Therefore the customer who is refused to pay
caused a debt and decreased the income.
Service’s company has a regulation to keep
giving the service to customers who refuse to pay in
specific period [12]. Although there is penalty
which will be given, but it is still being the
problem. Detecting and preventing of customer
behavior who refuse to pay is one of objective
which want to solve by industry.
In insolvency classification, one of attribute
which is so affected is customer finance. But
multimedia service provider’s company has no
detail data about customer finance [4]. Therefore
customer payment data can be segmented to see
customer potential and help company to do
prevention based on customer segmentation [12].
Therefore company can take an action based on
customer group.
Data mining has been widely used to solve
customer behavior problem, a lot of researches
about data mining, which research include customer
be one of big category [9]. Survey of data mining in
detecting and preventing cheating which is
customer who use the service and refuse to pay too
[14]. In this research, customer will be segmented
with k-means algorithm according customer
payment behavior, so can be measured their
potential customer level. Every customer segments
will be classified according customer solvency with
C4.5 algorithm. So, the accuracy of C4.5 algorithm
will be better and suitable to be applied according
customer potential level.
This research will classify customer insolvency
in one of tv cable and internet service provider’s
company in Jakarta. Payment process is charged
every month after using the service. The customer
who does not pay the bill in the time still can use
the service for three months with certain penalty.
Therefore, company want to know who the
insolvency customer is, so can handle and prevent
directly without waiting for three months.
Research data will be taken from customer
payment data, and other data which is collected as
customer complain and service that is used. Data is
266
S. Moedjiono et. al / International Journal of Computer Networks and Communications Security, 4 (9), September 2016
collected for the last of 2014 and the using data is
just the data which is the customer age more than
six months.
Using avalaible data that will be processed with
k-means segmentation and C4.5 classification
model, so how is the accuracy increment of C4.5 to
classify customer solvency which will be applied in
data that has been segmented with k-means
algorithm? Hopely this research can generate a
worthied model for company in company customer
solvency classification.
2
RELATED WORKS
Model that is offered in this research contains
some related objects to generate customer solvency
prediction. One of that is customer solvency itself,
which is insolvency customers are customers who
refuse or can not pay the service they used [4]. A
customer is judged as solvency if pay what service
they used at least 30 days after rate paid.
That insolvency customer will affect company
income and company operational activity, customer
who is considered as insolvency customer is still
can use company service although there is still
penalty for them [14]. This customer solvency can
be seen from payment behavior which has been
done. Knowing who insolvency customer, company
will take approaching and will build effective
relation with customer.
1.
2.
3.
4.
This customer solvency is measured from
customer payment that is done in customer
rate validity period. If customer pay rate
after validity rate ends so customer is
insolvency. If there are stacking rate,
permanent customer will be considered as
solvency customer if he can pay his rate,
although not pay fully. Factors that affect
customer solvency are:
Customer rate amount.
In company will be researched how much
customer spend their money to pay their
rate every month.
Customer balance amount.
Customer balance is the accumulation of
customer overpayment that is noted by
company.
Adjusting.
Adjusting can be promotion cutting or
cash back because overpayment.
5.
Debt.
Customer debt can be considered in
transaction value and company noted this
in month.
6. Ever customer service is downgraded
because do not pay.
7. Ever customer service is stopped because
of does not pay.
8. Complain.
9. Is customer often paid lately?
10. Facility and how often customer use the
service.
Those factors will be a base in data choosing
from company that is researched. Determinants are
also adjusted with data which given by company.
With those factors, hopely data’s attribute that will
be processed has linkages with customer solvency,
so can create the model with high accuracy when
processed with data mining method.
Data mining its selve is an action to do extraction
to get important information that is implisit and
unknown from data. Data mining is defined as
process to find pattern in data. This process is
automatically or (usually) semi-automatically [16].
Pattern is found may precious in other means that
affect some advantages, usualy economic. Data that
is always used is big size. Data mining is an action
to find new meaningful correlation, pattern and
trend with choosing some data which is saved in
repository, using reasoning pattern technology and
statistic technique and math [8].
Data mining has variant of classification
algorithms. Classification in data mining is data
learning method to predict a group attributes value.
Classification algorithm will generate a batch of
rules that is called rule and will be used as indicator
to predict the class from the data that want to be
predicted [15]. Classification is used in many areas,
and as classification algorithm theory is same as
human brain. Human brain can process existing
data as experience to act.
One of related algorithm in data mining concept
is C4.5, where C4.5 is an algorithm to classification
problem in learning machine and datamining [17].
C4.5 was created by J. Ross Quinlan, named like
that because C4.5 is a descent from ID3
approaching that popular in decision tree. Decision
Tree is a batch of question that is arranged
systematically, where every question is created
based on a value of attribute that is testing. The
answer from the question will be continued to other
questions until stop at leaf label that means variable
267
S. Moedjiono et. al / International Journal of Computer Networks and Communications Security, 4 (9), September 2016
label. A batch of this question is illustrated in tree
diagram, which is so simple to understand. In tree
diagram, tree’s root is illustrated as first question,
and every branch will be called tree’s branch which
is consisted of testing of value in attributes in
testing. Existing branch will branch until the last
branch that is called leaf. Leaf is a types of data
label which is been testing, can be called as the
result of classification or the result of data
prediction [16]. C4.5 is an algorithm that is match
to be used for classifying data in bulk into specific
classes based on data pattern [16].
In tree creating algorithm with C4.5, this thing is
important enough to be done is count gain value of
every attributes to decide branch that will be made
decision tree. Attribute with biggest gain value is
the attribute that will be chosen as forming branch
attribute. The formula that is used in creating
decision tree process is as follow:
( )
( )
( )
∑
∑
( )
| |
| |
( )
( )
( )
In grouping algorithm, a data is considered similar
with measure value distance from one data to other
data [11]. Distance measurement process between
these two objects is named Euclidean distance with
this formula:
√∑(
In this research, data mining algorithm is still not
enough to maximize accuracy in to decide
customer potential level value, therefore this needs
a model that analyze customer potential level
which is been a reference as rating to customer
loyalty. A model in customer potential level
measurement is RFM model. RFM gives a
quantitative value as attribute that will be used into
customer
segmentation
algorithm.
This
segmentation will create customer into 5 segments
based on RFM model.
Model RFM is consists of:
1.
2.
In processing big dataset with a various data,
decision tree will have a lot of branches. Branch
that was made by heterogen data is often overall
decrease the accuracy of decision tree, therefore in
decision tree’s branch with is not good enough can
be pruned. This pruning besides increase decision
tree’s accuracy, but also simplify overall of
decision tree’s structure to easy to read. This term
of decision tree’s pruning is called by pruning.
Knowing the weakness of attribute choosing and
decrease accuracy because too much attributes are
used from C4.5 algorithm, so model will be created
will add k-means segmentation algorithm. The
purpose of this segmentation algorithm is with split
every data in dataset to be grouped in homogeny
group. This data group is usually called as segment
or cluster. Every segment which is created will be
consisted of homogeny data and difference with
data in other segments [15]. This grouping is same
as human’s brain works method, which knowledge
is grouped in every area. With this grouping, data
can be processed specifically based on the
research’s purpose.
)
3.
Recency (lastest purchasing time) (R)
R is time interval since customer latest
purchase the product or pay the service.
The small interval is the big R value.
Frequency (purchasing frequency) (F)
F is how often a customer purchase
product, or how long customer use the
service, the often purchasing doing the big
F value.
Monetary (transaction value) (M)
M is how much amount of customer’s
transaction that customer paid in certain
period, the high transaction value, the
good M value.
RFM model application to choose attribute to
customer segmentation will generate a better
segmentation result. After customer segmentation is
created, that result can be used as reference to hold
unloyal customer or a customer that want to churn
and be the reference to more specific data analysis.
To know how good the created prediction by
arranged model, so evaluation and testing have to
do to model, especially classification algorithm that
have been operated. To test prediction result, this
research uses x-validation in 10 steps (10 folds
cross-validation).
With
x-validation,
result
measurement can more accurate because data is
divided into 10 same data, then one by one, that
data is taken to test, and 9 other part is used to the
268
S. Moedjiono et. al / International Journal of Computer Networks and Communications Security, 4 (9), September 2016
training [14]. With cross-validation, accuracy from
data measurement will be guaranted because can
decrease the chance of inconsistent data in
prediction step.
A dataset is divided into 10 parts, and one by one
will be as training data, and the other data will be
used as testing data. This thing will be done
repeatly until 10 times, so the accuracy of model
will be generated then will be averaged so will be
gotten more accurate accuracy in this research.
2.
Table 1: Confusion matrix with good result
True Value
Prediction Result
Yes
No
High
Low
Low
High
yes
no
(
)
(
)
To measure accuracy increment from each
validation result, we use confusion matrix.
Confusion matrix is 2 dimensions matrix that is
illustrated the comparison between two prediction
results with what the true happen.
While ROC curve will be used to measure AUC
(Area Under Curve). ROC curve divide positif
result into y axis and negative result into x axis
[15]. So, the bigger area under curve, the better
predictions result.
With related research helping, this model has a
hypothesis, that:
1.
2.
Be predicted from some latest researches,
C4.5 is algorithm that is used to predict
customer solvency.
Be expected that with using C4.5
classification algorithm that will increase
its accuracy with added k-means
segmentation algorithm can generate
accurate customer solvency prediction.
3.
network to predict customer insolvency
with existing data.
Pinheiro Research Model [12].
Research starts with collecting data from 5
million Customers. That data is took
randomly 5%. Variable will be used to
selection and segmentation with selforganizing maps. Segmentation result will
be created in 5 classes and predicted with
neural network. Prediction result in this
research is 83.95% represent good
customer and 81.25% represent bad
customer.
Ali Research Model [1].
This research result is shown in confusion
matrix in precision form, recall and Fvalue. This research got that data
segmentation
process
before
did
classification algorithm give significant
increment result, and the classification
result by Bayesian Network is 73.9%, but
decision tree 81.9%. In segmentation,
decision tree accuracy increase to 97.5%,
every irrelevant data can be grouped so
decision tree classification algorithm can
process clearer data.
Those three related research have different
model, but in classify insolvency customer,
decision tree classification algorithm can generate
better model then other algorithms. K-means
algorithm can be used to extract feature to generate
more accurate C4.5 algorithm [1]. Those three
related researches can be seen at table below.
Table Error! No text of specified style in document.:
Similar comparison researches
Those related researches are as below:
1.
Daskalaki Research Model [4].
Research starts with problem telling and
research scope, after that collecting
customer information, calling using, rate,
customer payment rate report, termination
report in 17 months for about 100,000
customers. Data is reduced with reduce the
small calling data (smaller than 0.3 euro),
reduce uncomplete data. Data is grouped
into biweekly period. After data is ready,
data mining method using is discriminant
analysis, decision trees, and neural
From a review, this research will use k-means
algorithm to segmentate payment behavior so can
be measured their customer potential level.
Customer potential level will be added as one of
attribute to help solvency classification with C4.5
algorithm. So C4.5 algorithm’s accuracy will be
269
S. Moedjiono et. al / International Journal of Computer Networks and Communications Security, 4 (9), September 2016
better and more suitable based on customer
potential level.
With This research purpose is increase C4.5
algorithm’s accuracy in solvency prediction with
group customer data into segmentation. This
grouping is for decrease data dimension and see
customer potential level based on their payment
behavior. With k-means, customer divide into 5
groups, those are group with high potential level,
middle until low. This customer segment grouping
is based on RFM model.
After the customer segment created, customer
segment will be added as one of attribute and will
be classified based on their loyalty with C4.5
algorithm, those attributes that is used to
segmentation will not be used again because
customer is already known their potential level. So
the remaining attribute will be used into
classification process. After the model is created,
next step is testing with 10 folds cross validation.
Algorithm accuracy will be measured by using
confusion matrix. While AUC will be measured
using ROC Curve. C4.5 prediction result which is
already optimated by k-means will be compared
with C4.5 result which does not use k-means.Those
result will be compared to know how big the
accuracy increment from C4.5 algorithm.
In mind framework, there is no repetition process
after doing testing, because in this testing process
there is just doing the testing or measure the
accuracy based on process result and there is no
failed in data testing process except there are
external factors as uncompatible hardware,
unopened data, or power failure while data
processing. Which those external factors actualy
can be happened in every part of mind framework
that can make the testing process has been repeated
from beginning.
This research contribution is the use of related
data with using customer potential segmentation
based on RFM model, which is in latest researches
has not done yet, so can increase accuracy
percentage in customer solvency classification
research.
3
DISCUSSION
Data is used in this research is primary data that
is took from service provider company’s data.
Observation that did in that company to collect
active customer payment data use cable tv service
or internet. Customer data is collected in beginning
of payment period. In this company, there are two
services that is offered, and those are internet and
cable tv. Customer data which is taking is payment,
rate and customer complain data. To help attribute
choosing, data is took starting from six months
later.
Beginning data is consisted of January 2014 to
December 2014, in every month there is 4 types of
payment’s due date. Every data is compared to get
solvency and insolvency customer to every due
date, and chosen date with highest insolvency
customer ratio (about 25% insolvency customer).
Data attribute in beginning is payment data that is
consisted of 6 months later rate, customer balance
until 6 months later, debt 6 months later, adjust that
is did until 6 months later, payment value until 6
months later, ever disconnect status, service type,
payment type, complain amount that ever did.
Other attributes that are took from customer data
are starting using service date or called customer
subscribe age which is that is one of important
attribute in data segmentation. From existing data,
researcher add status that noted that does customer
pay the rate in that month, latest payment date is
made as label that will be classified.
Table Error! No text of specified style in document.:
Beginning data which has not been processed yet (data
for rate, balance pay and age consist of 6 months)
Which is data that is collected is processed by
soft-computing algorithm to reduce irrelevant data
or data with lost attributes. Processing can also
convert redundant value or a data with many
variants into smaller group to ease model creating.
With research step as below:
1.
2.
3.
4.
5.
Collecting data.
This research begins with collecting data.
That dataset which has a similar like
related research.
First data processing.
Dataset will be processed first.
Model or method which is proposed.
Model or method which is proposed by
researched is C4.5 method with k-mean
segmentation algorithm helps.
Experiment and model testing.
Dataset that will be used after processing
will be tested by proposed model.
Result evaluation and validation.
270
S. Moedjiono et. al / International Journal of Computer Networks and Communications Security, 4 (9), September 2016
After dataset testing has been done, so
accuracy value will be shown. Then that
value will be analyzed and evaluated. With
analysis result, researcher can get the
conclusion.
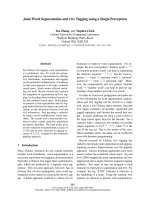
Proposed model in this research starts with
processing dataset until generate customer solvency
classification result, and measure accuracy
increament compared with model without
segmentation. Figure below is illustrated proposed
model which is explained as follow:
Dataset
Data Preprocessing
Transformasi Data
Penyetaraan
Saldo
Penyetaraan
Tagihan
Penyetaraan
Umur
Pelanggan
Penyetaraan
LastPay
Feature Extraction (K-Means)
Jumlah Tagihan,
Saldo
LastPay
Umur Pelanggan
Attribut Baru
Potensial
Training Data
10%
10 Folds Cross Val
Learning Method
Decision Tree (C4.5)
1.
2.
3.
4.
Transform first data with equalize rate,
balance, last pay and customer age. This
four attributes are chosen based on RFM
model and need to be equalized so can be
processed with k-means.
Because balance and rate is collected from
6 latest months, so comparison between
balance amount + rate amount : latest
payment date : customer age is made be 1:
1: 1. After those attributes is synchronized,
segmentation k-means start doing.
Customer will be segmentated into 5
groups. This segmentation result is
customer potential result.
Customer potential level will be used to
change other attributes that create
customer potential level, so data that will
be processed by C4.5 can be reducted.
Other attribute will be reduce like
customer payment tipe which is consist of
full payment, partial payment, and not pay
is accumulated be full payment amount,
and partial payment amount. Customer
debt will be accumulated from 6 months
be max month debt, minimal month debt
and average debt. Other attribute also will
be accumulated is customer complain
which is accumulation from complain and
technition visits.
Data in dataset will be chosen into training
and into testing. With using 10 folds cross
validation, dataset will be divided into
training data (10%) and testing (90%) and
will be repeated 10 times. Created model
will be tested directly with testing dataset
and model accuracy will be averaged.
Potensial
Max, Min, Ave
Age (Hutang)
NotPay
PartialPay
Adjust
(Pemotongan)
DGNP
(Jumlah
disconnect)
DINP
(Jumlah
Downgrade)
Cust Problem
(Keluhan)
Payment
(Label)
Layak
Tidak Layak
Testing Data
90%
Model Evaluation
Confusion Matrix (Accurary)
ROC Curve (AUC)
Fig. 1. Proposed model detail
The process from arranged model is as follows:
1. Customer Potential Segmentation.
Existing data will be segmented with k-means
algorithm, with attribute that will be used are
rate until 6 months later, customer balance
until 6 months later, last payment, and
customer age.
All data value is standardized with min-max
scale. From all existing data, that is took
minimal and maximal value, then every data is
scaled with that minimal and maximal value.
Because of all comparison rate and balance
with last pay and custage have to be 1:1:1 same
as RFM theory, so scale result to rate and
balance is timed one hundred, but lastpay and
cust age scale is timed with 1400.
Table 4: Center point of every segment
Attribut
e
rateNO
W
Balance
NOW
Rate1
Rate2
Rate3
cluste
r_0
7.594
367
4.585
035
7.321
036
7.230
15
7.078
448
cluste
r_1
4.356
739
24.24
704
4.320
701
4.323
026
4.338
526
cluste
r_2
5.671
74
3.818
727
5.635
567
5.593
635
5.650
754
cluste
r_3
7.852
482
4.293
624
7.772
679
7.678
887
7.742
95
cluste
r_4
8.126
008
4.566
758
7.921
956
7.834
718
7.757
297
271
S. Moedjiono et. al / International Journal of Computer Networks and Communications Security, 4 (9), September 2016
Rate4
6.746
599
6.714
208
6.619
499
40.08
429
18.02
442
25.05
501
26.62
417
30.93
11
34.57
337
1378.
678
1167.
819
177
Rate5
Rate6
Balance
1
Balance
2
Balance
3
Balance
4
Balance
5
Balance
6
LastPay
CustAge
Total
Data
4.165
825
4.503
069
4.994
949
51.43
417
31.78
835
35.96
472
35.98
502
38.18
569
40.18
767
1056.
265
171.7
647
170
5.433
084
5.493
992
5.364
581
39.90
542
17.81
404
24.81
821
26.72
197
30.55
372
34.48
082
1370.
94
516.8
503
334
7.298
033
7.180
029
7.084
119
40.17
373
18.10
56
25.18
98
27.02
881
31.08
27
34.76
364
1379.
748
149.2
604
1490
7.467
799
7.398
141
7.280
499
40.34
714
18.28
969
25.05
136
26.94
768
30.94
078
34.70
558
1378.
826
49.47
193
2369
Customer segments analysis is made is as
follows:
a.
Cluster 0 has rate average high, and
old customer, therefore include into
very high potential customer level,
and the number of customer in this
segment are 177 customers.
b. Cluster 1 is about 170 customers with
low rate, and young age customer.
These customers are very low
potential customer level.
c. Cluster 2 has middle rate, good
enough latest payment, and customer
age that older than cluster 1 and
include into low potential customer
level about 334 customers.
d. Cluster 3 has high rate, and middle
customer age, and payment that is did
on the time. There are 1490 customer
in this high potential customer level.
e. Cluster 4 has high rate and on time
payment, and young age customer.
It’s middle potential customer level
about 2369 customers.
2. Solvency Customer Classification.
After segmentation, researcher got 5 segments,
that segments are used as new attribute to ease
data processing in C4.5 algorithm. Attributes
are used to segmentation process do not be
used in solvency classification. So remaining
attributes will be used to customer solvency
classification are adjustment, customer amount
who don’t pay in 6 months later, customer
amount who pay partial in 6 months later.
After we got customer segments, every
segment is used to be classified customer
solvency. Attribute that is chosen are
remaining attribute without the attributes those
are used for segmentation. Which is the
attributes are used to classified are segments,
adjustment, customer amount who don’t pay in
6 months later, customer amount who pay
partial in 6 months later. Average, maximal
and minimal debt in 6 months later, product
type that is used, a number of customer is
called, and status that customer ever
downgrade or disconnect.
Gain value to every attributes is count from
information gain value minus info value (d).
Because the biggest gain value is in
numNotPay attribute so the first branch is
made from numNotPay with value more than
split_point (0.5) is all labeled nonpay, and to
lower value or same as 0.5, all label is pay. So
the created tree with numNotPay attribute
branch with split_point 0.5.
Data that will be processed are about 4540
customer data that is already been segmented
before. To segment customer, the segments are
made are 5 segments same as the expected
potential types. But to get accurate and good
solvency classification model, indicator value
in decision tree generation process can be
adjusted to get maximal result.
Experiment which is did, adjust indicator value
to decision tree. The indicators are maximum
gain and preprunning. Rapid miner application
use maximum gain value about 0.1 and always
use preprunning. After first data process, gain
value is still small, so maximum gain will be
tested from 0 to 0.1. to every maximum gain
value which will be tested, will be compared
between accuracy result model and its pruning.
Experiment detail and result can see as follows:
Table 5: Indicator testing value
The smaller gain value limitation, the bigger too
accuracy model that is created. So decision tree
272
S. Moedjiono et. al / International Journal of Computer Networks and Communications Security, 4 (9), September 2016
result is created is so complex and take a long time
to create. Preprunning process decrease accuracy
value, so created better model if is measured with
AUC.
With pruning a differences between accuracy and
AUC is too big. Because this result purpose is to
create good and accurate model, so gain value that
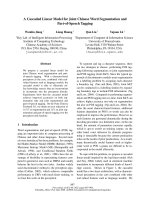
will be chosen is 0.06 with using pruning. Model
that is created is so big. And first branch is created
with potential customer level attribute. Therefore
tree will be divided to every customer segments and
will be shown as below:
Fig. 5. Decision tree for fourth segment
Fig. 2. Decision tree for first segment
Fig. 6. Decision tree for fifth segment
Fig. Error! No text of specified style in document..
Decision tree for second segment
Fig. 4. Decision tree for third segment
Created model can be applied directly to active
customer. To see customer potential level, customer
data attributes as age, rate, balance, latest payment
have to be processed to can be grouped into
potential customer level segment. After find
potential customer level, other attributes and
potential customer level attribute can be used in
model so can know solvency and insolvency
customer.
To know this customer solvency prediction
model a good and reliable model in customer
solvency prediction so researcher has to do
evaluation and validation. Which evaluation and
validation will be done with measuring accuracy
using confusion matrix method and AUC using
ROC curve. That evaluation and validation process
as follow:
1. Confusion Matric Evaluation Model.
Confusion Matrix shows prediction result in
table completely, result prediction is got from
average of applying model that create into
testing data which is chosen with using C4.5
algorithm with dataset which is used
segmented and unsegmented attribute.
273
S. Moedjiono et. al / International Journal of Computer Networks and Communications Security, 4 (9), September 2016
In unsegmented dataset, attributes of dataset
are rateNow, rate1, rate2, rate3, rate4, rate5,
rate6. Balance Now, bal1, bal2, bal3, bal4,
bal5, bal6, adjust, numNotPay, numPartialPay,
maxAge, minAge, average, DGNP, DINP,
product, custProblem, custAge, lastPay.
Prediction class is Pay class that is presented
customer who pay on time and not pay class to
customer who refuse to pay, or do not pay on
time.
From indicator testing result, we can see that
using k-means algorithm in customer
segmentation can increase high enough of
accuracy if compared by data before
segmentation as table below:
Table 6: Indicator testing accuracy value of minimal gain
and pruning
Minim
al
Gain
C4.5 + K-Means
C4.5
0
No
Pruning
80.46%
No
Pruning
75.22%
0.02
80.22%
0.04
79.95%
0.06
80.00%
0.08
80.28%
0.1
79.95%
Prunin
g
80.59
%
79.99
%
78.61
%
77.31
%
72.26
%
56.36
%
74.47%
74.36%
72.77%
70.43%
68.72%
Pruni
ng
76.28
%
75.85
%
77.35
%
59.02
%
56.36
%
56.36
%
With not pay number of prediction truly which is
235, and not pay prediction which is pay is 114
customers. And customer who predicted solvency
or has pay class, 1746 not pay and just 2444
customer who is predicted solvency and truly pay.
Model accuracy can be counted from true
positive prediction plus true negative prediction
divided by all data number. Model accuracy for
unsegmented accuracy is low enough about
59.02%.
Table 7: Confusion matrix table for dataset without
segmentation attribute
Table 8: Confusion matrix table for data with
segmentation attribute
Confusion matrix can be saw in table above,
where customers that is predicted truly insolvency
are 1464 customers. For insolvency customer, but
solvency are 513 customers. But for customers who
are predicted solvency but insolvency are 517
customers. And customers who are predicted
solvency and truly solvency are 2045 customers.
2.
ROC
Curve
(Receiver
Operating
Characteristic).
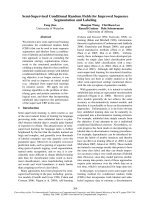
Evaluation is also done using ROC Curve.
AUC value in indicator testing can be seen
in table below. Segmentation process and
prepruning is also proven that those can
increase AUC model value. With see AUC
value and accuracy value, best model is
taken in minimal gain indicator with 0.6
value and with prepruning value. In
unsegmented dataset, AUC value in ROC
curve is 0.537. ROC curve can be seen
below.
Table 9: AUC value of minimal gain and pruning
indicator value
Minim
al
Gain
C4.5 + K-Means
C4.5
0
No
Pruning
0.79
Prunin
g
0.851
No
Pruning
0.634
Pruni
ng
0.68
0.02
0.797
0.844
0.631
0.719
0.04
0.787
0.849
0.641
0.797
0.06
0.787
0.791
0.836
0.793
0.617
0.08
0.59
0.537
0.5
0.1
0.808
0.5
0.53
0.5
274
S. Moedjiono et. al / International Journal of Computer Networks and Communications Security, 4 (9), September 2016
low accuracy. Too much numeric attributes also
can make tree has a lot of duplicated branches.
Table 11: CreatedCustomer segmentation
Fig. 7. ROC Curve for dataset before segmentation
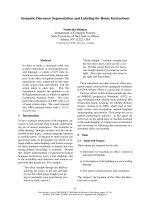
While in segmented dataset, AUC value increase to
0.836. ROC Curve for segmented dataset can be seen at
figure below. From increment accuracy and AUC model
value, we can see that dataset beginning process with
using k-means can generate better model. High enough
increment that is created because of the increment of
accuracy to 18.29% and AUC value be 0.836.
Fig. 8. ROC Curve for dataset after segmentation
Based on processes that have been done so this
research implication is as follow:
Table 10: C4.5 model comparison between before and
after segmentation
Attribut
e
Accurac
y
AUC
C4.5
C4.5 + k-means
26
attributes
59.02%
11 attributes (16 for kmeans)
77.31%
0.537
0.836
Using attributes too much will decrease classification process and accuracy. Attribute with too
low information gain value will be affected the
created decision tree result being complex, and has
Customer segmentation is created by RFM factor
as table above illustrated customer spread suitable
with chosen factor which is balance and rate
number is joined be monetary factor, lastpay as
recency factor. And customer age is chosen as
frequency factor because the higher customer age,
so the more often customer pay.
Segment 1 (177 customers) has average highest
in 3 factors, therefore include into very potential
level. Segment 2 (170 customers) just has high
recency, and categorize as customer with very low
potential level. Segment 3 (334 customers) has
lowest monetary value and categorize as low
potential level. Segment 4 (1490 customers) has
high rate and recency as high potential level. And
last segment (2369 customers) is categorized
middle potential level with high monetary but low
frequency value.
Segmentation process to grouping some numeric
attributes can help create a new attribute and cut
attribute so can increase C4.5 accuracy. With
segmentation process, we can see that accuracy
from classification process is increase from 59.02%
to 77.31%. Besides that AUC also increase from
0.537 to 0.836. Besides that customer segment is
also one of company needed to know its customers,
so insolvency customer approaching, and company
promotion can be applied based on the segments.
4
CONCLUSIONS
Conclusion from research that researcher did
based on chosen model using k-means
segmentation algorithm and C4.5 classification
algorithm that From this research, cut attribute
dimension in customer solvency classification
process proven can increase model accuracy. In
multimedia service company, attributes can be
grouped with data mining algorithm as k-means.
Attribute grouping or feature extraction is so
effective to cut data dimension and create a helpful
attribute.
Model quality increment can be seen from
accuracy increment that can be measured with
using confusion matrix, accuracy for unsegmented
C4.5 algorithm model is 59.02% and AUC is 0.537.
275
S. Moedjiono et. al / International Journal of Computer Networks and Communications Security, 4 (9), September 2016
After did feature extraction with k-means, accuracy
value increase be 77.31% and AUC value be 0.836.
With using feature extraction, data dimension can
be cut, and create represented data to be tested so
can simplify model and increase model accuracy.
Created model can be applied in all customer
data (with enough attributes) so company can see
directly who is solvency and insolvency customers.
Customer solvency level introduction helps
company to arrange the marketing strategy and
decrease company load to keep the service to
insolvency customer.
Although C4.5 algorithm model which is used
already gave a better result, but there is something
that can add for next research:
1.
Because the most of attribute in data is
numeric,
next
research
can
do
discretization so the value can be
processed as nominal value.
2. Can use optimization algorithm to attribute
choosing, or adjust parameter value to get
truly accurate model.
3. Using other algorithm that more suitable in
process numeric data as chi square so the
split point can be got better.
To company, with having model to classify
customer solvency level, we hope company can:
1. Integrated solvency model in choosing
suitable customer with product and
promotion and prevent insolvency
customer.
Can collect and use other customer attributes to
create a better model again.
5
REFERENCES
[1] Ali, S. A., Sulaiman, N., Mustapha, A., &
Mustapha, N. K-Means Clustering to Improve
the Accuracy of Decision Tree Response
Classification.
Pakistan:
Information
Technology Journal 8, 8, 1256-1262, 2009.
[2] Alpaydin, E. Introduction to Machine Learning
(Second Edition). London: The MIT Press,
2010.
[3] Cheng, C. H., & Chen, Y. S. Classifying The
Segmentation of Customer Value Via RFM
Model and RS Theory. Taiwan: Expert System
with Applications, 36, 4176-4184, 2009.
[4] Daskalaki, S., Kopanas, I., Goudara, M., &
Avouris, N. Data Mining for Decision Support
on
Customer
Insolvency
in
Telecommunications
Business.
Greece:
European Journal of Operational Research,
145, 239-255, 2003.
[5] Dawson, C.W. Projects in Computing and
Information Systems a Student’s guide
(Second Edition). Harlow, UK: AddisonWesley, 2009.
[6] Gorunescu, F. Data Mining Concepts, Models,
and Techniques. Berlin: Springer-Verlag, 2011.
[7] Han, J., & Kamber, M. Data Mining: Concepts
and Techniques (Second Edition). San
Francisco: Elsevier Inc, 2006.
[8] Larose, Daniel T. Discovering Knowledge in
Data: An Introduction to Data Mining. Canada:
John Wiley & Sons, Inc., Hoboken, New
Jersey, 2005.
[9] Liao, T. W., & Triantaphyllou, E. Recent
Advances in Data Mining of Enterprise Data:
Algorithms and Applications (Vol.6). USA:
World Scientific Publishing Co. Pte. Ltd, 2007.
[10] Liu Y, & Schumann, M. Data Mining Feature
Selection For Credit Scoring. Germany:
Journal of The Operational Research Society,
1-10, 2005.
[11] Myatt, G. J. Making Sense of Data: A Practical
Guide to Exploratory Data Analysis and Data
Mining. Canada: John Wiley & Sons, Inc.,
Hoboken, New Jersey, 2007.
[12] Pinheiro, C. A., Evsukoff, A. G., & Ebecken,
N. F. Revenue Recovering with Insolvency
Prevention on a Brazilian Telecom Operator.
Brazil: SIGKDD Explorations, 8 (1), 65-70,
2006.
[13] Prasad, P., & Malik, D. L. Generationg
Customer Profiles for Retail Stores Using
Clustering Techniques. India: International
Journal on Computer Science and Engineering,
3 (6), 2506-2510, 2011.
[14] Thiruvadi, S., & Patel, S. C. Survey of Datamining Techniques Used in Fraud Detection
and Prevention. USA: Information Technology
Journal, 10 (4), 710-716, 2011.
[15] Vercellis, C. Business Intelligence : Data
Mining and Optimization for Decision Making.
Canada: John Wiley & Sons, Inc., Hoboken,
New Jersey, 2009.
[16] Witten Ian h, Eibe Franck and Mark A. Hall.
Data Mining Pratical Machine Learning Tools
and Techniques. Third Edition. Burlington:
Elsevier Inc, 2011.
[17] Wu, X., & Kumar, V. The Top Ten Algorithms
in Data Mining. Minnesota: Taylor & Francis
Group, LLC, 2009.
[18] Xu, R., & Wunsch II, D. C. Clustering.
Canada: John Wiley & Sons, Inc., Hoboken,
New Jersey, 2009.