A real-world evaluation of a tertiary care childhood obesity intervention to reduce metabolic risk in a hard-to-reach urban population
Bạn đang xem bản rút gọn của tài liệu. Xem và tải ngay bản đầy đủ của tài liệu tại đây (800.41 KB, 9 trang )
Bayoumi et al. BMC Pediatrics
(2019) 19:378
/>
RESEARCH ARTICLE
Open Access
A real-world evaluation of a tertiary care
childhood obesity intervention to reduce
metabolic risk in a hard-to-reach urban
population
Nagla S. Bayoumi1*, Elizabeth Helzner1, Aimee Afable2, Michael A. Joseph1 and Sarita Dhuper3
Abstract
Background: Research on outcomes associated with lifestyle interventions serving pediatric populations in urban
settings, where a majority have severe obesity, is scarce. This study assessed whether participation in a lifestyle intervention
improved body mass index (BMI) percentile, BMI z-score, blood pressure, and lipid levels for children and adolescents.
Methods: The Live Light Live Right program is a lifestyle intervention that uses medical assessment, nutritional education,
access to physical fitness classes, and behavioral modification to improve health outcomes. Data was analyzed for 144
subjects aged 2–19 who participated for a minimum of 12 consecutive months between 2002 and 2016. McNemar tests
were used to determine differences in the proportion of participants who moved from abnormal values at baseline to
normal at follow-up for a given clinical measure. Paired sample t-tests assessed differences in blood pressure and lipid
levels. Multiple linear regression assessed the change in blood pressure or lipid levels associated with improvement in
BMI%95 and BMI z-score.
Results: The majority were female (62.5%), mean age was 9.6, and 71% were Black. At baseline, 70.1% had severe obesity,
systolic hypertension was present in 44, and 13.9% had diastolic hypertension. One-third had abnormally low high-density
lipoprotein (HDL) at baseline, 35% had elevated low-density lipoprotein (LDL), and 47% had abnormal total cholesterol (TC).
The average difference in percentage points of BMI%95 at follow-up compared was − 3.0 (95% CI: − 5.0, − 1.1; p < 0.003).
The mean difference in BMI z-score units at follow-up was − 0.15 (95% CI: − 0.2, − 0.1; p < 0.0001). Participants with systolic
or diastolic hypertension had an average improvement in blood pressure of − 15.3 mmHg (p < 0.0001) and − 9.6 mmHg
(p < 0.0001), respectively. There was a mean improvement of 4.4 mg/dL for participants with abnormal HDL (p < 0.001) and
− 7.8 mg/dL for those with abnormal LDL at baseline (p = 0.036). For those with abnormal baseline TC, a one-unit
improvement in BMI%95 was associated with a 0.61 mg/dL improvement in TC while holding constant age, contact
hours, and months since enrollment (p = 0.043).
Conclusions: Participation in the program resulted in significant improvements in BMI percentile, BMI z-score, blood
pressure, and lipid levels.
Keywords: Pediatric obesity, Severe obesity, BMI percentile, Metabolic syndrome
* Correspondence:
1
Department of Epidemiology & Biostatistics, SUNY Downstate Medical
Center, School of Public Health, 450 Clarkson Avenue, Brooklyn, NY 11203,
USA
Full list of author information is available at the end of the article
© The Author(s). 2019 Open Access This article is distributed under the terms of the Creative Commons Attribution 4.0
International License ( which permits unrestricted use, distribution, and
reproduction in any medium, provided you give appropriate credit to the original author(s) and the source, provide a link to
the Creative Commons license, and indicate if changes were made. The Creative Commons Public Domain Dedication waiver
( applies to the data made available in this article, unless otherwise stated.
Bayoumi et al. BMC Pediatrics
(2019) 19:378
Background
Pediatric obesity is a grave public health concern and its
prevalence in the United States increased from 14.6% in
1999–2000 to 17.4% in 2013–2014 [1]. The prevalence
in Brooklyn, New York is greater - approximately 22% of
children and adolescents in Brooklyn have obesity [2].
Compared to other regions within Brooklyn, neighborhoods in Central and Eastern Brooklyn have a higher
prevalence [2, 3].
Obesity in childhood is associated with elevated blood
pressure and abnormal lipid and glucose levels [4].
Childhood obesity tracks into adulthood and 85% of
children with obesity become adults with obesity at risk
for developing hypertension, type 2 diabetes (T2DM),
dyslipidemia, and cardiovascular disease (CVD) [5]. This
cluster of diseases and disorders, commonly associated
with adulthood, is identifiable in childhood and is known
as the metabolic syndrome [5]. Most studies define
pediatric metabolic syndrome as the presence of three or
more of the following five factors: an increased waist
circumference (WC), systolic or diastolic hypertension, a
high triglyceride (TG) level, a low high-density lipoprotein (HDL) level, and an elevated fasting glucose concentration [5, 6].
Obesity is a crucial factor for the development of the
metabolic syndrome and early identification can help
target treatment efforts in high-risk individuals [6] [7].
.Weight loss and its maintenance should have the highest priority in treatment efforts since weight loss has
been found to improve blood pressure, serum lipid
levels, and fasting blood glucose values [8]. Even a small
reduction in body mass index (BMI) percentile or BMI
z-score can have beneficial effects on metabolic risk [7].
The treatment of choice for pediatric obesity is a lifestyle
intervention focused on weight reduction and based on
nutrition education, exercise, and behavioral modification [7, 9–11]. The efficacy of this type of intervention
has been proven by several randomized-controlled trials
and synthesized in a meta-analyses [11]. The majority of
those studies included children with obesity and a gap in
the literature exists on the effects of lifestyle interventions on children and adolescents with severe obesity,
particularly those residing in urban settings. Our study
aimed to fill this gap – the majority of subjects in our
study had severe obesity.
Live Light Live Right (LLLR) is a lifestyle modification
intervention that combines a set of multi-disciplinary
services to help modify behaviors of children with overweight and obesity to lead healthier lives [12]. The
program was founded in 2001 and predominantly serves
communities in Central and Eastern Brooklyn [12].
Through medical assessment, nutritional education, access to physical fitness classes, and behavioral modification, LLLR aims to improve health outcomes for youth
Page 2 of 9
with obesity. The purpose of this study was to determine
the impact of the intervention on BMI and metabolic
risk factors for children and adolescents, the majority of
whom have severe obesity. Specifically, this study aimed
to determine whether BMI percentile, BMI z-score,
blood pressure, and serum lipid levels improved for
enrollees who participated in the LLLR program for a
minimum of 12 consecutive months.
Methods
Intervention methods
Live Light Live Right is a comprehensive, lifestyleintervention program. Children between the ages of 2
and 19 with a BMI ≥ 85th percentile for age and sex can
be referred to the program. Families are usually referred
through a child’s pediatrician, though some learn about
the program from social media. Families also learn about
the program from screenings that LLLR conducts at
public schools, housing complexes, and non-profit organizations in the community.
Program participants were enrolled between January
2002 and August 2016. At the initial visit, a child and
his/her parents met with clinic staff and medical histories were obtained. Children underwent a complete
medical exam to assess baseline BMI, body composition,
waist circumference, and blood pressure measures.
Blood samples were taken and lipid levels, liver function,
glucose, and insulin levels were determined. A brief
psychological screening was administered and referrals
for mental health services were arranged when appropriate. Families also met with a nutritionist, who documented dietary habits. A coordinator assessed physical
activity habits and time spent in sedentary activity as
well as motivation to commit to regular medical visits,
counseling sessions, and exercise programs.
The first follow-up visit took place approximately 1
month after the initial appointment. Laboratory test results were reviewed and, based on results of the initial
behavioral screenings, a personalized treatment plan
specifically tailored to the participant’s needs was developed consisting of four components: 1) regular medical
evaluation, 2) nutritional education and counseling, 3)
physical activity, and 4) behavioral modification. Each
child was assigned a care coordinator who discussed the
plan with the child and his/her caretakers, followed up
with appointments, monitored participation and attendance to follow-up visits, and facilitated referrals to other
community programs. At each subsequent follow-up
visit, the plan was modified according to the needs of,
and in collaboration with, the participant and his/her
family.
During follow-up visits, food recalls were conducted
and children and their family members were provided
with nutritional education and counseling sessions with
Bayoumi et al. BMC Pediatrics
(2019) 19:378
certified nutritionists. Among topics discussed within
the nutritional education curriculum were: How to Pack
Your Pantry, Supermarket Sense, Snacking Savvy, and
the Power of Portions. Dietary behavior changes encouraged during counseling sessions included label reading,
reducing the intake of fast food and sugary beverages,
selecting 3 to 5 servings of fresh fruits and 2 or more
servings of vegetables daily, and choosing lean sources of
protein. Events such as cooking workshops and ageappropriate games about healthy food choices were
scheduled and held at community sites. Program participants and their families were invited to attend and
learned where to access fresh and affordable produce
and how to prepare nutritious meals.
Treatment plans included, at the minimum, the recommended 60 min of moderate to rigorous daily physical activity. Weekly physical activity recalls were taken
at follow-up visits and adherence to plan recommendations were assessed. Participation in structured physical
activity was strongly encouraged. The LLLR program
partnered with community recreation sites to provide
participants with opportunities for free, structured, afterschool physical fitness sessions that are supervised by
certified trainers. Recognizing that children need a safe
and supportive environment to exercise and take part in
fitness classes without being ostracized or teased, the
sessions were exclusive to LLLR participants. The afterschool program provided diversity in sporting choices,
including basketball, boxing, aerobics, and dance. In the
summer months, participants could attend a six-week
day camp that included physical fitness activities as well
as education about food insecurity and field trips to
community gardens to learn about the benefits of eating
fruits and vegetables.
When follow-up visits were missed, barriers were addressed and goals were modified as needed. Motivational
interviewing was used to help program participants and
their caregivers determine priorities, consider whether
current behaviors support priorities, and assess barriers
and resources that could influence behavior change.
Additionally, the behavioral modification techniques of
stimulus control and role-playing were used to encourage healthier dietary and activity choices.
The State University of New York Downstate Medical
Center Institutional Review Board approved this study.
Assent and written informed consent were obtained from
participants and their parents/guardians, respectively.
Study methods
Characteristics of the study sample
This study was a single arm, retrospective, pre-post analysis. Data was analyzed for subjects aged 2 through 19
who participated in the LLLR program for a minimum
of 12 consecutive months between the years of 2002 and
Page 3 of 9
2016. To be included in the sample, a follow-up visit
with a complete medical reassessment after 12 consecutive months of enrollment had to have occurred anytime
between 12 and 24 months after the initial visit. During
the study period, 845 children participated in LLLR for a
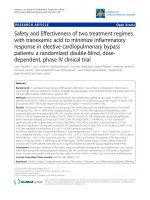
minimum of 12 months. Of these, 144 met the above
inclusion criteria and had no missing values for any
variables of interest (Fig. 1). Though the analytic sample
was slightly younger in age as compared to the overall
LLLR cohort, there were no significant differences in
regards to sex, BMI%95, BMI z-score, and obesity prevalence (Table 1).
Measurement of outcomes
Anthropometric measures and health indicators were
assessed at baseline and at follow-up. All follow-up measures refer to those taken at the first follow-up visit that
included a complete medical reassessment after at least
12 consecutive months of program enrollment. Height
and weight were measured with the participant in light
clothing without shoes. Height was measured to the
nearest tenth of an inch using a Detecto stadiometer.
Weight was measured to the nearest tenth of a pound
using an InBody 270 Body Composition Analyzer
machine. The InBody 270 calculated BMI as weight in
kilograms divided by the square of height in meters.
BMI was then used to determine age and sex-specific
BMI z-scores and percentiles using electronic health
record calculators. Waist circumference was measured
to the nearest tenth of a centimeter just above the iliac
crest using a tape measure. Automated blood pressure
measurement devices (Welch Allyn 4200B-E1 Vital Signs
Monitor and Mindray Passport V Monitor) were used to
measure resting systolic blood pressure (SBP) and diastolic
blood pressure (DBP). Blood pressure was measured while
participants were in the sitting position with the right arm
at rest. Participants sat quietly for a few minutes before
the first measurement was taken. Three measurements
were taken and the average was used. Readings were
recorded to the nearest integer in mmHg units. Fasting
blood samples were collected by venipuncture and included measures for glucose, insulin, total cholesterol
(TC), HDL cholesterol, low-density lipoprotein (LDL)
cholesterol, and triglycerides (TG).
To assess the burden of disease at baseline amongst
sample participants, the age- and sex-specific prevalence
of overweight, obesity, and severe obesity was determined.
Overweight was defined as having a BMI between the
85th and 94th percentile. Obese was defined as having a
BMI ≥ 95th percentile but < 120% of the 95th percentile.
Severe obesity was defined as a BMI ≥ 120% of the 95th
percentile. Abnormalities for WC, blood pressure, and
lipid levels were determined based on reference values
from the National Cholesterol Education Program’s
Bayoumi et al. BMC Pediatrics
(2019) 19:378
Page 4 of 9
Fig. 1 Selection of Analytic Sample (Please see attached file)
Table 1 Baseline descriptive statistics of participants with ≥12 months of participation (n = 845), participants with ≥12 months of
participation that did not have a follow-up that included lab work at least 12 months after the initial visit (n = 264), participants with
≥12 months of participation and a follow-up reassessment including lab work at least 12 months after the initial visit (n = 581), and
the analytic sample which included participants whose nearest follow-up with lab work occurred 12–24 months after the initial visit
and had no missing data (n = 144)
Participants with ≥ 12
months of participation
n = 845
Did not have a follow-up
with lab work at least 12
months after initial visit
n = 264
Had a follow-up with labs
at least 12 months after
initial visit
n = 581
Analytic Sample: nearest follow-up
with labs occurred 12–24 months
after the initial visit and had no
missing data
n = 144
Variable
N (%)
N (%)
N (%)
N (%)
Age in years
mean ± SD
10.5 ± 3.5*
11.3 ± 3.5*
10.1 ± 3.4*
9.6 ± 3.0*
Male
340 (40%)
113 (43%)
228 (39%)
54 (37.5%)
Female
504 (60%)
150 (57%)
353 (61%)
90 (62.5%)
BMI%95
mean ± SD
136.8 ± 25.9
135.7 ± 25.2
137.1 ± 25.9
133.6 ± 22.7
BMI z-score
mean ± SD
2.5 ± 0.5
2.4 ± 0.4
2.6 ± 0.5
2.5 ± 0.6
Healthy weight
2 (0.2%)
0 (0.0%)
2 (0.3%)
1 (0.7%)
Overweight
20 (2.4%)
8 (3.0%)
12 (2.1%)
2 (1.4%)
Obese
202 (23.9%)
68 (25.8%)
136 (23.4%)
40 (27.8%)
Severely Obese
604 (71.5%)
180 (68.2%)
424 (73.0%)
101 (70.1%)
Missing
17 (2.0%)
8 (3.0%)
7 (1.2%)
0 (0.0%)
Sex
Obesity Prevalencea
Overweight: BMI between the 85th & 94th percentile for age & sex
Obese: BMI ≥ 95th percentile & < 120% of the 95th percentile for age & sex
Severely Obese: BMI ≥ 120% of the 95th percentile for age & sex
*Significant differences between groups; p < 0.05
a
Healthy weight: BMI between the 5th & 84th percentile for age & sex
Bayoumi et al. BMC Pediatrics
(2019) 19:378
Pediatric Panel report [13, 14]. Waist circumference ≥
90th percentile for age and sex was defined as abnormal.
The presence of hypertension was defined as SBP or
DBP ≥ 90th percentile for age, sex, and height. Abnormal
lipid levels were defined as follows: TC ≥ 160 mg/dL;
HDL ≤ 40 mg/dL; LDL ≥ 110 mg/dL; and TG ≥ 110 mg/dL
for those 12 yrs. and older or ≥ 90th percentile for age and
sex. An abnormally high glucose level was defined as
≥110 mg/dL. Elevated metabolic risk was defined as the
presence of three or more of the following factors: an
abnormally large WC, systolic or diastolic hypertension,
an abnormally low HDL level, an abnormally high TG
level, and an elevated fasting glucose level.
Measurement of covariates
Demographic factors including age, gender, race and
ethnicity were measured at baseline. Contact hours with
the LLLR program were used as a proxy for treatment
intensity. Contact hours included time spent at the clinic
for initial visits, follow-up visits, nutrition education,
nutritional counseling, physical activity education, and
behavioral counseling. The number of months of program participation was calculated as the number of
months enrolled since the initial visit.
Page 5 of 9
Table 2 Descriptive statistics of sample (N = 144) at baseline
Variable
N (%)
Age in years, mean ± SD
9.6 ± 3.0
Sex
Male
54 (37.5%)
Female
90 (62.5%)
Race
Black
102 (70.8%)
Hispanic
24 (16.7%)
White
1 (0.7%)
Asian
1 (0.7%)
Other/Unknown
16 (11.1%)
a
Obesity Prevalence
Healthy Weight
1 (0.7%)
Overweight
2 (1.4%)
Obese
40 (27.8%)
Severely Obese
101 (70.1%)
Contact hours, mean ± SD
7.6 ± 4.1
Months enrolled since initial visit, mean ± SD
17.2 ± 3.7
Overweight: BMI between the 85th & 94th percentile for age & sex
Obese: BMI ≥ 95th percentile & < 120% of the 95th percentile for age & sex
Severely Obese: BMI ≥ 120% of the 95th percentile for age & sex
a
Healthy weight: BMI between the 5th & 84th percentile for age & sex
Statistical methods
Data were analyzed using IBM SPSS software version 24
[15]. McNemar tests were used to determine differences
in the proportion of participants who moved from abnormal values at baseline to normal at follow-up for a
given clinical measure. Paired sample t-tests were used
to determine whether mean differences in anthropometric measures, blood pressure, lipid levels, and glucose
measures were significantly different at follow-up compared to baseline. Binary logistic regression models were
used to determine the odds associated with a one-unit
improvement in BMI%95 and BMI z-score on the
normalization of blood pressure and lipid levels while
controlling for age, sex, contact hours, and months since
initial visit. Multiple linear regression models were used
to assess the change in blood pressure or lipid levels
associated with a one-unit improvement in BMI%95 and
BMI z-score while controlling for age, contact hours,
and months since initial visit. The significance level was
set at alpha = 0.05.
Results
Descriptive statistics of the study sample at baseline are
shown in Table 2. The majority of participants were
female (62.5%) and the mean age was 9.6 years. About
71% of the sample identified as Black and 16.7% were
Hispanic. The majority of participants had severe obesity
(70.1%). Table 3 shows the number and percentage of
participants with abnormal WC, blood pressure, lipid
levels, and fasting glucose measures at baseline. The
majority of participants had an abnormal waist circumference (92.4%). At baseline, systolic hypertension was
present in 44 and 13.9% had diastolic hypertension.
One-third of the sample had abnormally low HDL levels
at baseline and 25.7% had elevated TG levels. Approximately 5% had an elevated fasting glucose level at baseline.
About 31% of sample subjects (n = 44) were identified as
having three or more components of the metabolic syndrome at baseline.
At follow-up, approximately 62% of participants experienced a reduction in or maintenance of BMI%95 and 68%
had a reduction in or maintenance of BMI z-score. Mean
differences between follow-up and baseline measures of
BMI%95 and BMI z-score for the entire sample are
displayed in Table 4. There were significant reductions in
both BMI%95 and BMI z-score. The average difference in
percentage points of BMI%95 at follow-up compared to
baseline was − 3.0 (95% CI: − 5.0, − 1.1; p < 0.003). The
mean difference in BMI z-score units at follow-up compared to baseline was − 0.15 (95% CI: − 0.2, − 0.1; p <
0.0001).
Table 5 shows changes in mean blood pressure, lipid
levels, and glucose measures for participants who had abnormal levels at baseline. Participants with systolic or diastolic hypertension at baseline had an average improvement
in blood pressure of − 15.3 mmHg (p < 0.0001) and − 9.6
mmHg (p < 0.0001), respectively. Significant improvements
(2019) 19:378
Bayoumi et al. BMC Pediatrics
Page 6 of 9
Table 3 The number and percentage of participants with
abnormal measures at baseline and follow-up and the number
and percentage with normalized measures at follow-up of those
with abnormal baseline measures
Measure
Abnormal
at
Baseline
N (%)
Normalized
Abnormal p value*
measure at follow- at Followup of those with
up
abnormal measure
at baseline
N (%)
Waist
Circumferencea
133
(92.4%)
10 (7.5%)
127
(88.2%)
p=
0.180
Blood Pressureb
64 (44.4%) 33 (51.6%)
55 (38.2%) p =
0.289
Diastolic
20 (13.9%) 18 (90.0%)
blood pressure
15 (10.4%) p =
0.473
Systolic blood
pressure
Lipid Levelsc
Total
cholesterol
67 (46.5%) 16 (23.9%)
65 (45.1%) p =
0.856
High-density
lipoprotein
48 (33.3%) 22 (45.8%)
38 (26.4%) p =
0.121
Low-density
lipoprotein
50 (34.7%) 13 (26.0%)
54 (37.5%) p =
0.585
Triglycerides
37 (25.7%) 18 (48.6%)
39 (27.1%) p =
0.871
Fasting Glucosed
7 (4.9%)
3 (2.1%)
Presence of 3 or
more
components of
the metabolic
syndromee
44 (30.6%) 22 (50.0%)
6 ((85.7%)
p=
0.289
39 (27.1%) p =
0.522
*p-values refer to McNemar tests
a
Waist circumference ≥ 90th percentile for age and sex was defined as
abnormal [14]
b
Hypertension was defined as SBP or DBP ≥ 90th percentile for age, sex, and
height [14]
c
Abnormal lipid levels were defined as: TC ≥ 160 mg/dL; HDL ≤ 40 mg/dL;
LDL ≥ 110 mg/dL; and TG ≥ 110 mg/dL for those 12 yrs. and older or ≥ 90th
percentile for age and sex [14]
d
Abnormally high fasting glucose level was defined as ≥110 mg/dL [14]
e
Defined as presence of 3 or more of the following: increased waist
circumference, systolic or diastolic hypertension, a high TG level, a low HDL
level, or elevated fasting glucose concentration
in HDL and LDL were also observed for participants who
had abnormal levels at baseline. At follow-up, there was a
mean improvement of 4.4 mg/dL for participants with abnormal HDL levels at baseline (p < 0.001) and − 7.8 mg/dL
for those with abnormal LDL levels at baseline (p = 0.036).
Results of the McNemar tests (Table 3) did not yield
significant differences in the proportion of participants
who moved from abnormal values at baseline to normal
at follow-up for a given clinical measure. In binary logistic regression analyses using normalization of blood
pressure and lipid levels as outcomes, change in BMI%95
and BMI z-score were not associated with greater odds
of normalization except in the case of TC (Table 6). For
those with abnormal TC levels at baseline, a one unit increase in BMI%95 was associated with a 7% reduced odds
of normalized TC levels at follow-up while adjusting for
age, sex, contact hours, and months since initial visit
(OR = 0.93, 95% CI: 0.87, 0.99, p = 0.03). Except for TC,
multiple linear regression analyses did not yield significant associations between reductions in BMI%95 and
BMI z-score and improvements in blood pressure or
lipid levels (Table 7). For those with abnormal baseline
TC, a one-unit improvement in BMI%95 was associated
with a 0.61 mg/dL improvement in TC while holding
constant age, contact hours, and months since enrollment (p = 0.043).
Discussion
Participation in the LLLR program for a minimum of 12
consecutive months resulted in significant improvements
in components of the metabolic syndrome. In our study,
50% of participants who had three or more components
of the metabolic syndrome at baseline had less than
three components at follow-up. In the literature, lifestyle
interventions for children and adolescents have been
associated with a significant decrease in the prevalence
of the metabolic syndrome. A study conducted by Reinehr et al. found that the prevalence of the components
of the metabolic syndrome decreased significantly in 288
children with obesity after a 1-year lifestyle intervention
in contrast to the 186 children in the control group
without a lifestyle intervention [16]. The intervention
resulted in a significant decrease of metabolic syndrome
prevalence of 19 to 9% [16]. Similarly, Verduci et al. reported that a 1-year behavioral intervention for children
with obesity resulted in a significant decrease of 17 to
5% from baseline to the end of the intervention [17].
The difference in proportion in our study between the
percentage with three or more components of the metabolic syndrome at follow-up compared to baseline was
not significant. This might be partly explained by the
fact that, unlike the two studies described above, a majority of participants had severe obesity and a greater
Table 4 Change in mean BMI%95 and BMI z-score for the entire study sample
Measure
Baseline Mean ± SD
Follow-up Mean ± SD
Difference (Δ) Mean (95% CI)
p value*
BMI%95
133.6 ± 22.7
130.6 ± 24.2
−3.0 (− 5.0, − 1.1)
p < 0.003
BMI z-score
2.5 ± 0.6
2.4 ± 0.5
− 0.15 (− 0.2, − 0.1)
p < 0.0001
* p-values refer to paired-sample t-tests
Bayoumi et al. BMC Pediatrics
(2019) 19:378
Page 7 of 9
Table 5 Change in mean blood pressure, lipid levels, and fasting glucose measures for participants who had abnormal levels at
baseline
p value*
Measure
Baseline Mean ± SD
Follow-up Mean ± SD
Difference (Δ) Mean (95% CI)
SBP (mm Hg)
122.6 ± 7.6
117.3 ± 11.3
−15.3(− 7.7, − 2.9)
p < 0.0001
DBP (mm Hg)
77.1 ± 7.7
67.6 ± 10.7
−9.6 (− 13.5, − 5.6)
p < 0.0001
TC (mg/dL)
196.0 ± 25.4
192.3 ± 32.0
−3.7 (− 9.8, 2.3)
p = 0.221
HDL (mg/dL)
36.2 ± 4.6
40.6 ± 8.8
4.4 (2.0, 6.8)
p < 0.001
LDL (mg/dL)
134.5 ± 19.4
126.7 ± 29.2
− 7.8 (− 15.1, − 0.55)
p = 0.036
TG (mg/dL)
140.8 ± 58.3
122.0 ± 49.2
−18.9 (− 41.8, 4.0)
p = 0.103
Glucose (mg/dL)
120.7 ± 27.4
91.7 ± 7.7
−29.0 (− 3.9, 0.99)
p = 0.054
* p-values refer to paired-sample t-tests
percentage (30.6%) had three or more components of
the metabolic syndrome at baseline.
The findings of our study are similar to those of a
study by Wickham et al. that included 165 youth with
obesity of which 30.3% had three or more components
of the metabolic syndrome at baseline [18]. After 6
months of lifestyle modification, Wickham et al. did not
find a significant difference in the number of subjects
with three or more criteria of the metabolic syndrome
[18]. Similar to our study, 70.3% of the participants in
the study by Wickham et al. were African American and
the mean BMI z-score at baseline was 2.44 (± 0.31) [18].
Lifestyle modification programs vary in intensity, which
explains variations in results amongst studies. We agree
with Wickham et al. who reasoned that more intense exercise programs were required to see significant changes
in metabolic syndrome prevalence in certain patient
populations [18].
After participation in the LLLR program for a minimum of 12 consecutive months, significant differences
in SBP, DBP, HDL, and LDL were observed for participants with abnormal baseline levels. Wickham et al. did
not find significant differences in mean pre/post blood
pressure measures though TC and LDL decreased significantly from baseline [18]. In a study of 177 youth
with obesity aged 5 to 19 who took part in a behavioral
weight management program, Kirk et al. found significant improvements in blood pressure and LDL levels at
follow-up for subjects who had abnormal levels at
Table 6 Logistic regression model results with normalized total
cholesterol at follow-up as the dependent variable
Model variablesa
β
p value
Exp(β)
95% CI
Table 7 Multivariable linear regression model results with
change in total cholesterol at follow-up as the outcome variable
Model variablesa
Dependent variable: Normalized TC
a
program onset, though improvements in TC were also
observed [19]. In a retrospective cohort study of 282 2through 19-year old youth with obesity who participated
in a primary care-based childhood obesity treatment
program, Dolinsky et al. reported significant improvements at follow-up for patients with elevated SBP, DBP,
TC, and TG levels [20].
A meta-analysis of 15 studies found that lifestyle interventions led to significant improvements in LDL levels
(− 5.4 mg/dL, 95% CI: − 8.1, − 2.7), TG levels (− 2.7 mg/
dL, 95% CI: − 4.32, − 1.26), and blood pressure up to 1
year from baseline though no difference was found for
HDL levels [21]. In comparison, our study found significant mean differences in pre/post measures of blood
pressure and LDL levels though it is important to note
that a significant mean difference in HDL for those with
abnormal levels at baseline was also observed. In
addition to improvements in TG levels, Verduci et al.
found significant increases in HDL levels at the end of
the 1-year intervention (1.1 mg/dL, 95% CI: 0.2, 2.0)
though the magnitude in the difference of HDL found in
our study was greater [17].
Although there were significant mean differences between follow-up and baseline measures of BMI%95 and
BMI z-score, associations between reductions in BMI%95
and BMI z-score and improvements in blood pressure or
lipid levels were only significant for TC. This is most
likely due to relatively fewer numbers of participants
with abnormal baseline measures for blood pressure,
HDL, LDL, and TG compared to TC. Some studies
p = 0.032
β
p value
Change in BMI%95
−0.076
Age
0.015
p = 0.869
1.016
(0.845, 1.220)
Change in BMI%95
0.608
p = 0.043
Sex (male)
− 0.058
p = 0.927
0.943
(0.270, 3.301)
Age
1.124
p = 0.213
0.927
(0.865, 0.994)
Outcome variable: Change in TC (mg/dL) at follow-up
Contact hours
− 0.029
p = 0.749
0.971
(0.811, 1.163)
Contact hours
0.245
p = 0.790
Months since initial visit
− 0.013
p = 0.873
0.987
(0.842, 1.157)
Months since initial visit
0.084
p = 0.915
All variables were entered simultaneously into the model
a
All variables were entered simultaneously into the model
Bayoumi et al. BMC Pediatrics
(2019) 19:378
reported associations between decreases in BMI z-score
and improvements in blood pressure or lipid levels and
others did not. The meta-analysis referenced above
reported that improvements in lipid levels were not uniformly associated with the extent of weight loss or body
fat reduction and that it was unclear whether positive effects were attributable to weight loss per se or to factors
of lifestyle interventions independent of weight loss,
such as an increase in physical activity or a reduction in
saturated fat intake [21]. This is important to note considering studies have reported that lifestyle interventions
in children with obesity have resulted in improvements
in blood pressure and lipid levels with the maintenance
of BMI z-score and in the absence of weight loss or body
composition change [21–24].
This study had some limitations. The number of contact hours included time spent in the clinic on medical
assessments, reassessments, behavioral modification,
education, and counseling. It did not include time spent
at offsite program-sponsored physical activity sessions.
Future research should assess the impact of participation
in program-sponsored fitness classes on the components
of the metabolic syndrome. The lack of a randomized
control group was another limitation and, although that
would have been optimal, it was unlikely that untreated
youth with obesity would improve their relative weight
status or metabolic risk profile. Although baseline characteristics of the analytic sample were similar to those of
the entire sample, the analytic sample was slightly younger. As a result, there was a potential for selection bias.
Findings of this study are not generalizable to all LLLR
participants since the presence of a complete follow-up
reassessment and when that follow-up took place relative to the initial visit could be influenced by factors not
controlled for, such as motivation. Therefore, findings
are generalizable to participants with similar characteristics to the analytic sample. The use of an intervention
duration of 12 months, at minimum, and 24 months, at
maximum, precluded the assessment of longer-term results. Future follow-up studies on the sample will determine if improvements in blood pressure and lipid levels
are maintained over longer durations.
Despite these limitations, confidence in our findings is
strengthened by the variety of outcome indicators used
to assess intervention effectiveness. We assessed pre/
post differences for blood pressure, lipid levels, and
other components of the metabolic syndrome whereas
many studies looked at either changes in blood pressure
or lipid levels, but not both. Another strength was the
definition of severe obesity as BMI ≥ 120% of the 95th
percentile. As this definition for severe obesity becomes
used more widely in research on extreme obesity in
pediatric populations, we expect our findings will be useful for comparative purposes. Data about improvements
Page 8 of 9
in cardiovascular disease risk factors related to obesity
interventions for children and adolescents residing in
Central and Eastern Brooklyn are scarce. This study adds
to the research on a population that is gravely underrepresented within the literature and our findings have
implications for the benefits of lifestyle interventions for
youth with severe obesity.
Conclusion
Participation in the LLLR program resulted in reductions
in BMI%95 and BMI z-score and significant improvements
in blood pressure and lipid levels for participants with abnormal baseline measures. Since obesity is a chronic disease requiring ongoing care, the evaluation of long-term
outcomes of the program are recommended to determine
if improvements are sustained. When resources and assets
are mobilized strategically, a community-based approach
to the treatment of pediatric obesity can directly affect the
health and well-being of children and adolescents.
Abbreviations
BMI: Body mass index; CVD: Cardiovascular disease; DBP: Diastolic blood
pressure; HDL: High-density lipoprotein; LDL: Low-density lipoprotein;
LLLR: Live Light Live Right; SBP: Systolic blood pressure; T2DM: Type 2
diabetes mellitus; TC: Total cholesterol; TG: Triglyceride; WC: Waist
circumference
Acknowledgements
Not applicable
Authors’ contributions
NB conceptualized the research study, performed the literature review,
analyzed the data, and wrote the manuscript. EH, AA, MJ, and SD reviewed
the analyzed data and edited the manuscript. All authors read and approved
the final manuscript.
Funding
No funding was received for this research.
Availability of data and materials
The data analyzed during the study Live Light Live Right’s programmatic
data and are not publicly available.
Ethics approval and consent to participate
The State University of New York Downstate Medical Center’s Institutional
Review Board has approved this study. Assent and written informed consent
were obtained from participants and their parents/guardians, respectively.
Consent for publication
Not applicable
Competing interests
The authors declare that they have no competing interests.
Author details
1
Department of Epidemiology & Biostatistics, SUNY Downstate Medical
Center, School of Public Health, 450 Clarkson Avenue, Brooklyn, NY 11203,
USA. 2Department of Community Health Sciences, SUNY Downstate Medical
Center, School of Public Health, Brooklyn, NY, USA. 3Department of
Pediatrics, SUNY Downstate Medical Center, Brooklyn, NY, USA.
Bayoumi et al. BMC Pediatrics
(2019) 19:378
Received: 28 February 2019 Accepted: 9 October 2019
References
1. Skinner AC, Skelton JA. Prevalence and trends in obesity and severe obesity
among children in the United States, 1999-2012. JAMA Pediatr. 2014;168(6):561–6.
2. Brooklyn Community Needs Assessment. New York City Health Provider
Partnership; 2014.
3. King L, Hinterland K, Dragan KL, et al. Brooklyn Community District 16:
Brownsville. 2015.
4. Ogden CL, Carroll MD, Lawman HG, et al. Trends in obesity prevalence
among children and adolescents in the United States, 1988-1994 through
2013-2014. JAMA. 2016;315(21):2292–9.
5. Weiss RBA, Lustig RH. What is the metabolic syndrome, and why are
children getting it? Ann N Y Acad Sci. 2013;1281(The Year in Diabetes and
Obesity):123–40.
6. Hadjiyannakis S. The metabolic syndrome in children and adolescents.
Paediatr Child Health. 2005;10(1):41–7.
7. Wittcopp C, Conroy R. Metabolic syndrome in children and adolescents.
Pediatr Rev. 2016;37(5):193–202.
8. Anderson JW, Konz EC. Obesity and disease management: effects of weight
loss on comorbid conditions. Obes Res. 2001;9(Suppl 4):326S–34S.
9. Coppock JH, Ridolfi DR, Hayes JF, St Paul M, Wilfley DE. Current approaches
to the management of pediatric overweight and obesity. Curr Treat Options
Cardiovasc Med. 2014;16(11):343.
10. Cornier MA, Dabelea D, Hernandez TL, et al. The metabolic syndrome.
Endocr Rev. 2008;29(7):777–822.
11. Stice E, Shaw H, Marti CN. A meta-analytic review of obesity prevention
programs for children and adolescents: the skinny on interventions that
work. Psychol Bull. 2006;132(5):667–91.
12. Live Light Live Right. 2017; .
13. Falkner B, Cossrow ND. Prevalence of metabolic syndrome and obesityassociated hypertension in the racial ethnic minorities of the United States.
Curr Hypertens Rep. 2014;16(7):449.
14. Cook S, Weitzman M, Auinger P, Nguyen M, Dietz WH. Prevalence of a
metabolic syndrome phenotype in adolescents: findings from the third
National Health and nutrition examination survey, 1988-1994. Arch Pediatr
Adolesc Med. 2003;157(8):821–7.
15. IBM SPSS Statistics for Windows [computer program]. Armonk: IBM Corp.
Released 2016.
16. Reinehr T, Kleber M, Toschke AM. Lifestyle intervention in obese children is
associated with a decrease of the metabolic syndrome prevalence.
Atherosclerosis. 2009;207(1):174–80.
17. Verduci E, Lassandro C, Giacchero R, Miniello VL, Banderali G, Radaelli G.
Change in metabolic profile after 1-year nutritional-behavioral intervention
in obese children. Nutrients. 2015;7(12):10089–99.
18. Wickham EP, Stern M, Evans RK, et al. Prevalence of the metabolic
syndrome among obese adolescents enrolled in a multidisciplinary weight
management program: clinical correlates and response to treatment. Metab
Syndr Relat Disord. 2009;7(3):179–86.
19. Kirk S, Zeller M, Claytor R, Santangelo M, Khoury PR, Daniels SR. The
relationship of health outcomes to improvement in BMI in children and
adolescents. Obes Res. 2005;13(5):876–82.
20. Dolinsky DH, Armstrong SC, Walter EB, Kemper AR. The effectiveness of a
primary care-based pediatric obesity program. Clin Pediatr (Phila). 2012;
51(4):345–53.
21. Ho M, Garnett SP, Baur L, et al. Effectiveness of lifestyle interventions in
child obesity: systematic review with meta-analysis. Pediatrics. 2012;130(6):
e1647–71.
22. Kolotourou M, Radley D, Chadwick P, et al. Is BMI alone a sufficient
outcome to evaluate interventions for child obesity? Child Obes. 2013;9(4):
350–6.
23. Bell LM, Watts K, Siafarikas A, et al. Exercise alone reduces insulin resistance
in obese children independently of changes in body composition. J Clin
Endocrinol Metab. 2007;92(11):4230–5.
24. Watts K, Jones TW, Davis EA, Green D. Exercise training in obese children
and adolescents: current concepts. Sports Med. 2005;35(5):375–92.
Publisher’s Note
Springer Nature remains neutral with regard to jurisdictional claims in
published maps and institutional affiliations.
Page 9 of 9