Development, evaluation and validation of a screening tool for late onset bacteremia in neonates – a pilot study
Bạn đang xem bản rút gọn của tài liệu. Xem và tải ngay bản đầy đủ của tài liệu tại đây (848.07 KB, 9 trang )
Walker et al. BMC Pediatrics
(2019) 19:253
/>
RESEARCH ARTICLE
Open Access
Development, evaluation and validation of
a screening tool for late onset bacteremia
in neonates – a pilot study
Sandra A. N. Walker1,2* , Melanie Cormier1, Marion Elligsen1, Julie Choudhury3, Asaph Rolnitsky3,
Carla Findlater3 and Dolores Iaboni3
Abstract
Background: Clinical and laboratory parameters can aid in the early identification of neonates at risk for bacteremia
before clinical deterioration occurs. However, current prediction models have poor diagnostic capabilities. The
objective of this study was to develop, evaluate and validate a screening tool for late onset (> 72 h post admission)
neonatal bacteremia using common laboratory and clinical parameters; and determine its predictive value in the
identification of bacteremia.
Methods: A retrospective chart review of neonates admitted to a neonatal intensive care unit (NICU) between
March 1, 2012 and January 14, 2015 and a prospective evaluation of all neonates admitted between January 15,
2015 and March 30, 2015 were completed. Neonates with late-onset bacteremia (> 72 h after NICU admission) were
eligible for inclusion in the bacteremic cohort. Bacteremic patients were matched to non-infected controls on
several demographic parameters. A Pearson’s Correlation matrix was completed to identify independent variables
significantly associated with infection (p < 0.05, univariate analysis). Significant parameters were analyzed using
iterative binary logistic regression to identify the simplest significant model (p < 0.05). The predictive value of the
model was assessed and the optimal probability cut-off for bacteremia was determined using a Receiver Operating
Characteristic curve.
Results: Maximum blood glucose, heart rate, neutrophils and bands were identified as the best predictors of
bacteremia in a significant binary logistic regression model. The model’s sensitivity, specificity and accuracy were 90,
80 and 85%, respectively, with a false positive rate of 20% and a false negative rate of 9.7%. At the study bacteremia
prevalence rate of 51%, the positive predictive value, negative predictive value and negative post-test probability
were 82, 89 and 11%, respectively.
Conclusion: The model developed in the current study is superior to currently published neonatal bacteremia
screening tools. Validation of the tool in a historic data set of neonates from our institution will be completed.
Keywords: Neonates, Late onset bacteremia, Screening tool
* Correspondence:
1
Department of Pharmacy E-302, Sunnybrook Health Sciences Centre (SHSC),
2075 Bayview Avenue, Toronto, ON M4N 3M5, Canada
2
Leslie Dan Faculty of Pharmacy, University of Toronto, Toronto, Ontario,
Canada
Full list of author information is available at the end of the article
© The Author(s). 2019 Open Access This article is distributed under the terms of the Creative Commons Attribution 4.0
International License ( which permits unrestricted use, distribution, and
reproduction in any medium, provided you give appropriate credit to the original author(s) and the source, provide a link to
the Creative Commons license, and indicate if changes were made. The Creative Commons Public Domain Dedication waiver
( applies to the data made available in this article, unless otherwise stated.
Walker et al. BMC Pediatrics
(2019) 19:253
Background
The increased risk of late-onset infections (greater than
72 h following birth) in preterm and very low birth
weight (VLBW) neonates is well documented [1]. Despite advancements in care, late-onset sepsis occurs in up
to 20% of VLBW infants, with 28% of septic neonates
experiencing more than one episode [2].
The diagnosis of late-onset neonatal sepsis is reached
using various signs and symptoms, and often leads to
the initiation of empiric, broad spectrum antimicrobial
therapy before laboratory results are available [2]. In a
study by Wirschafter et al., it was found that the ratio of
antibiotic courses administered to the number of confirmed blood stream infections (BSIs) in neonates was
14:1, suggesting that antibiotic overuse is an issue that
needs to be addressed in this patient population [3].
The reason for antibiotic overuse in the neonatal
population is multifactorial. The lack of specificity of
symptoms of bacteremia and the overlap of shared
symptoms among various neonatal conditions produces
an extensive list of differential diagnoses for clinicians to
consider and may lead to the overuse of broad-spectrum
antibiotics. Because the sensitivity of laboratory diagnosis of BSIs in neonates is affected by the small volumes
of blood permissible in blood draws (0.5 mL), clinicians
cannot rely on blood cultures alone, with false negative
rates of up to 60% in low colony count sepsis [4]. Currently, healthcare professionals in the neonatal intensive
care unit (NICU) lack a standardized, validated prediction tool for bacteremia. Published screening tools that
predict bacteremia have deficiencies in their performance metrics (e.g. sensitivity and specificity) which limit
their application in clinical practice [5–14].
In addition to common clinical [15] and laboratory parameters that are used to subjectively predict bacteremia
and sepsis in neonates, acute phase reactants such as Creactive protein (CRP) and procalcitonin (PCT) [16,
17] are being investigated; however, they have limitations
[17] and are either not routinely measured or quickly
available in most hospitals. Similarly, although the intercellular messenger CD64 has been shown to be an accurate diagnostic marker of early- and late-onset
neonatal sepsis [18], it is not routinely measured in clinical practice. Other novel predictors of infection have
also surfaced [16, 19–23], and although the investigation
of these new biomarkers as predictors of neonatal sepsis
is exciting and may be promising in the future, they are
unavailable to clinicians today.
Given the rate of antibiotic use in the NICU, a practical screening tool for bacteremia would enable safer,
more appropriate use of antibiotics. An ideal screening
tool for bacteremia in neonates should provide sufficient
sensitivity to ensure a case of bacteremia is not missed,
with a low negative post-test probability so as to
Page 2 of 9
promote a decrease in empiric, broad spectrum antimicrobials in non-bacteremic neonates. The objective of
this study was to develop, evaluate and validate a screening tool for late onset (> 72 h post admission) neonatal
bacteremia using common laboratory and clinical
parameters.
Methods
Study design
This pilot study was approved with the need for informed consent waived by the Sunnybrook Health
Sciences Centre (SHSC) Research Ethics Board on
January 13, 2015. The study employed a prospective and
retrospective study design. The retrospective cohort of
neonates included all eligible patients admitted to the institution’s 48 bed level 3 NICU from March 1, 2012 to
January 14, 2015. The prospective cohort of neonates
were all eligible patients admitted to the institution’s
NICU from January 15, 2015 to April 30, 2015.
All neonates admitted to the institution’s NICU during
the study period were eligible for study inclusion, regardless of gestational age. Neonates that did not have at
least some relevant laboratory parameters or vital signs
collected during their stay were excluded, as they did
not have data to contribute to the development of the
screening tool. This included neonates admitted to the
NICU for hyperbilirubinemia and hypoglycemia (unrelated to sepsis) who only had laboratory monitoring of
bilirubin and/or blood glucose, as well as neonates staying in the NICU for less than 48 h who did not have
laboratory parameters or vital signs collected, recorded,
or accessible to the team collecting data. Only neonates
with late-onset bacteremia (bacteremia occurring greater
than 72 h after admission to the NICU) were eligible for
study inclusion in the case cohort.
Data collection
Data on 35 clinical parameters and 17 laboratory parameters were collected for bacteremic cases and controls
(retrospective and prospective cohorts) (Additional file 1:
Table S1). These parameters were selected based on previously established and hypothesized potential signs and
symptoms of bacteremia in neonates. Data for the retrospective component of the study were obtained from
archived charts in the SHSC Health Records Office, the
Electronic Patient Record (EPR), and the antimicrobial
stewardship database.
For the prospective component, the clinical and laboratory parameter data were collected daily by a team
of NICU pharmacists for all patients included in the
study from date of NICU admission (day 0) to the date
of first positive blood culture, discharge from the NICU,
or death (whichever came first).
Walker et al. BMC Pediatrics
(2019) 19:253
Following data collection, neonates with documented
bacteremia (cases) were matched to non-infected neonates (controls) to reduce the risk of differences in baseline characteristics with univariate analysis having some
unknown confounding effect on parameters that may
influence the diagnosis of bacteremia. The identification
of significant parameters with univariate analysis and
subsequent confirmation with Pearson’s correlation provided justification of parameter entry into the binary logistic regression. At the point of data entry into the
binary logistic regression there is no further importance
related to matching; and therefore, relevant data from
both matched and unmatched controls were eligible for
tool development using binary logistic regression to
maximize sample size. Control patients were neonates
who did not receive antibiotics during their NICU hospital admission beyond the first 48 h of life and never
had a positive culture at any site. Cases were matched to
controls based on gender (when possible), gestational
age at birth, corrected gestational age at study entry,
weight at study entry, total length of stay in the NICU,
and antibiotic use (yes or no) within the first 48 h of life.
The remainder of control patients were categorized as
unmatched controls.
Neonates were categorized as having late-onset
bacteremia if a blood culture was positive for noncontaminant bacteria more than 72 h into their
NICU admission. Neonates with blood isolates considered to represent contaminants (Corynebacterium
spp., Propionibacterium spp., and Bacillus species other
than B. anthracis [24]) were excluded from further
comparative analysis of bacteremic versus non-bacteremic
patients to avoid any potential confounding. The criteria
for a true coagulase negative Staphylococcus spp. (CONS)
infection in neonates varies [25, 26], therefore for the
purpose of the current study, neonates found to have
blood cultures positive for CONS were included as
bacteremic cases for analysis if the colony count was
reported as greater than 100 colonies or if appropriate
antibiotics were used for 7 or more days in response to
the positive culture and correlated clinical status of the
patient. If the colony count for CONS was less than 10
colonies or antibiotics were used for less than 7 days in
response to the positive culture, the neonate was excluded
from analysis.
At the time of their first positive non-contaminant
blood culture, neonates were classified as cases and
matched one-to-one to controls for analysis. The time of
the positive blood culture represented the time of study
entry for bacteremic cases. In the event that a patient
had multiple positive blood cultures during their NICU
hospital stay, data was only collected in relation to their
first positive blood culture identified > 72 h into their
NICU admission.
Page 3 of 9
The data collected for final analyses were the parameter results closest to but before the date of blood culture collection within the previous 24 h period in cases
and the variable result closest to the matching length of
stay day post-birth within the previous 24 h period for
controls (i.e. if case patient had positive blood culture
96 h after birth, then relevant parameters for case and
their matched control patient were obtained from 72 h
to 96 h after birth). In the case of laboratory parameters
that were infrequently ordered (CRP and lactate), the respective closest value within a period of 96 h before the
blood culture collection date (in cases) or matched days
post-birth (in controls) was recorded. In the case of clinical parameters in which a maximum or minimum value
was needed, the parameters were defined as being the
maximum or minimum within 24 h before the date of
blood culture collection in cases or matched days post
birth in controls. Data on unmatched controls were obtained from the neonate’s worst day in the NICU using
fraction of inspired oxygen (FiO2) as the marker given
the highest priority for determining worst NICU day.
For neonates who were not ventilated and on room air,
the worst NICU day was the day with the most out of
range clinical or laboratory parameters.
Data analysis
Sample size
In the literature, there is currently no standard ratio to
determine how many patients are required per independent variable analyzed in the development of a
screening tool. Traditionally, minimum ratios from 2:1
to 10:1 (patients to variables), and a minimum sample
size of 100–200 patients has been considered acceptable
[27–32]. A target sample size of 100 neonates would
allow for assessment of a maximum of 10 (at a ratio of
10:1) up to 50 (at a ratio of 2:1) variables for association
with bacteremia in the evaluation to create a screening
tool. A total of 52 clinical and laboratory parameters
were included for potential assessment in the current
study. If each of these parameters was significant with
univariate analysis and entered into the iterative binary
logistic regression modelling, a minimal sample size of
104 neonates (for a ratio of 2 patients to 1 variable)
would be required.
Statistics
Descriptive statistics (mean with standard deviation or
median, and range or percentage) were used to describe
patient characteristics. Univariate analyses using a twotailed unpaired t-test (interval data normally distributed),
two-tailed unpaired t-test with Welch correction for
normally distributed data with unequal standard deviations; Mann-Whitney U test (interval data not normally
distributed, or ordinal data), or Fisher’s Exact Test and
Walker et al. BMC Pediatrics
(2019) 19:253
odds ratios with 95% confidence interval (nominal data)
(GraphPad Instat, version 3.05, 32 bit for WIN 95/NT,
created September 27, 2000) were used to compare patient characteristics, clinical parameters, and laboratory
values obtained from cases versus controls. One-way
analysis of variance (ANOVA) (interval parametric data)
and Kruskal-Wallis (interval nonparametric data) were
used when comparing characteristics across > 2 groups
of patients. A Pearson’s Correlation matrix (SPSS version
13.0 for Windows, created September 1, 2004) was
completed to identify clinical and laboratory parameters
(independent variables) associated with bacteremia
(dependent variable) (thereby, confirming the univariate
analyses) and to determine the percentage of patients
with a given measured variable. Any clinical and laboratory parameters available for > 20% of patients and having a p value < 0.05 with both univariate analysis and
Pearson’s Correlation were entered into binary logistic
regression (SPSS version 13.0 for Windows, created September 1, 2004) using an iterative process to identify a
statistically significant model (p < 0.05) in which all independent variables remaining in the model had an odds
ratio of > 1 and which provided the highest sensitivity
and specificity. Only patients with a complete data set
for the identified significant independent variables were
included in the development of the final model. A Receiver Operating Characteristic (ROC) curve was developed to identify the optimal probability breakpoint
representing bacteremia. Classification and Regression
Tree Analysis (CART) (Salford Predictive Modeler 7.0
Pro 32mb) was used to identify breakpoints of each independent variable that remained significant in the final
model. Sensitivity and specificity analysis was conducted
on the best predictive model for bacteremia. The optimal bacteremia screening tool developed was compared
to published tools by mapping the sensitivity and false
positive rate (1-specificity) for all tools to generate a
ROC curve.
Results
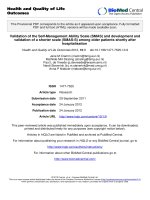
A total of 2214 neonates were admitted to the NICU between March 1, 2012 – March 31, 2015 and 153 of these
neonates (7%) (42 cases, 42 matched controls, 69 prospective unmatched controls, 111 total controls) were
included in this study (Fig. 1). Patient characteristics of
the entire study population (n = 153) and patient characteristics of the sample of patients that had a complete
data set for inclusion in the development of the final
bacteremia screening tool (cases = 31, controls = 30) are
detailed in Additional file 1: Tables S2 and S3, respectively. The overall period prevalence of bacteremia at the
study hospital during the study period was 2% (42/2214).
Six of 111 control patients (5%) (including 3 matched
control patients (3/42, 7%)) had blood cultures drawn
Page 4 of 9
and processed, each of which was negative for any microbial growth. One of these control patients had complete
data and was included in tool development (1/30, 3%).
The majority of organisms isolated in blood samples for
bacteremic cases were Gram Positive bacteria (38 out of
45 isolates, 84%) (Additional file 1: Table S4).
The 26 parameters found to be significantly correlated
with bacteremia by univariate analysis are detailed in
Additional file 1: Table S5. Significant parameters that
were identified in univariate analysis, but were not input
into the iterative binary logistic regression process were:
mortality that was possibly related to bacteremia, survival at the end of NICU stay, number of days in NICU
and number of ventilation days, since these would not
be parameters known to a clinician at the time of using
the screening tool in clinical practice, and therefore
would not be helpful in a predictive tool; maximum
mean arterial pressure (MAP) was excluded because
there is no normal range in babies and it is influenced
by corrected gestational age; all parameters with a significant negative correlation (gestational age at birth,
corrected gestational age at entry, weight at entry, minimum temperature, and maximum serum creatinine)
were excluded because they would not be helpful in a
predictive tool to identify bacteremia. Therefore, of the
original 26 significant parameters identified by univariate
analysis, only 16 parameters were assessed in the iterative binary logistic regression. Sixty-one neonates had a
complete data set for inclusion in the development of
the optimal binary logistic regression model (31 cases,
30 controls). Therefore, the patient to variable ratio for
the iterative binary logistic regression process was 4:1,
which is considered acceptable [27–32]. Of the cases included in the final data set for tool development, 29
were from the retrospective chart review and 2 were
from the prospective chart review. Of the controls included in the final data set for tool development, 2 were
matched controls from the retrospective chart review
and 28 were unmatched controls from the prospective
chart review. The remaining neonates with missing clinical and/or laboratory values were excluded (n = 92; 10
cases, 82 controls).
The optimal binary logistic regression model for the
bacteremia screening tool (Table 1) was Ln (odds of
bacteremia) = − 25.459 + 0.752(Maximum Blood Glucose
[mmol/L]) + 0.119(Maximum Heart Rate [bpm]) + 0.108(%
Bands) + 0.071(Maximum Neutrophils [× 10 〈9〉/L]).
Therefore, odds of bacteremia is the exponential of the
preceding equation and the probability of bacteremia =
Odds of Bacteremia/ (1 + Odds of Bacteremia). Using a
ROC curve, the optimal probability cut-off for
bacteremia (i.e. the threshold above which a neonate
would be deemed to be bacteremic) was found to be >
41.5% with an area under the curve of 89%. The CART
Walker et al. BMC Pediatrics
(2019) 19:253
Page 5 of 9
Fig. 1 Patient Eligibility Flow Chart
determined breakpoints for the parameters in the
bacteremia screening tool are detailed in Table 1.
The optimal model has a sensitivity of 90% (false negative rate of 10%), a specificity of 80% (false positive rate
of 20%), and an overall accuracy of 85%. Positive and
negative likelihood ratios were 4.50 and 0.12 respectively. The screening tool’s positive predictive value
(PPV) was 82%, and the negative predictive value (NPV)
was 89%. At the study population’s pre-test probability
of 51%, the screening tool had a negative post-test probability of 11%. At the overall study period prevalence of
bacteremia of 2%, this translates to a negative post-test
Table 1 Optimal model for Bacteremia in neonates
Binary logistic regression analysis
(significant model p < 0.0001, Nagelkerke Correlation Coefficient 66%;
N = 61 patients with a complete data set)
Ln (Odds Bacteremia (Y / N)) = − 25.459 + 0.752(Maximum Blood Glucose
[mmol/L]) + 0.119(Maximum Heart Rate [bpm]) +
0.108(% Bands) + 0.071(Maximum Neutrophils [× 109/L])
probability of 0.2% (Additional file 1: Table S6). Importantly, Additional file 1: Table S6 could be used by clinicians and investigators: i) to identify the predicted PPV,
NPV, and negative post-test probability of our tool at the
bacteremia prevalence (pre-test probability) in their hospital and ii) to compare our tool to other published tools
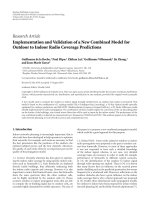
reporting a different bacteremia prevalence. When compared to other screening tools using a ROC curve, our
model had the lowest false-positive rate while maintaining a high sensitivity (Fig. 2 and Table 2).
The screening tool developed in this pilot study was
validated in a small separate retrospective cohort of neonates admitted to the NICU between September 12,
2010 and February 29th, 2012 with a full data set for the
tool parameters (unpublished data) (n = 8; bacteremic
neonates, n = 7; non-bacteremic neonates, n = 1)
(Additional file 1: Table S7). The tool identified all 7
bacteremic neonates and differentiated the nonbacteremic neonate from the group.
Variables in Final Binary Logistic Regression Equation
Independent
Variable
Odds 95%
Ratio Confidence
Interval
CART breakpoint for
association with bacteremia
when parent node is maximum
blood glucose
Maximum
2.121 1.182–3.806 > 6
Blood Glucose
(mmol/L)
Maximum
Heart Rate
(bpm)
1.127 1.040–1.221 > 186
% Bands
1.114 0.574–2.160 > 2.15
Maximum
Neutrophils
(× 109/L)
1.073 0.932–1.236 > 11.7
Discussion
A screening tool that accurately predicts the probability
of late-onset bacteremia in neonates using four parameters (blood glucose, heart rate, bands, and neutrophils)
that are readily available through routine blood work
and monitoring in the NICU was developed. In the developmental cohort, the tool has a sensitivity of 90%
(false negative rate of 10%), a specificity of 80% (false
positive rate of 20%), an accuracy of 85%, a positive and
negative likelihood ratio were 4.50 and 0.12 respectively,
a positive predictive value of 82%, a negative predictive
value of 89%, and at the study population’s pre-test
probability of 51%, the screening tool had a negative
Walker et al. BMC Pediatrics
(2019) 19:253
Page 6 of 9
Fig. 2 Receiver Operating Characteristic Curve Comparing Study Bacteremia Screening Tool to Currently Published Screening Tools [5–14]
post-test probability of 11%. At the overall hospital study
period prevalence of bacteremia during the study period
of 2%, this translates to a negative post-test probability
of 0.2%, meaning that the risk of missing a neonate with
true bacteremia is < 1% at the study bacteremia prevalence. A user-friendly app can be accessed at https://sun
nybrook.ca/content/?page=antimicrobial-stewardshipblood-screening-neo and is available at no charge for
clinical use to provide clinicians with a fast calculation
of the probability of BSI (%) in their patients and make
recommendations for obtaining blood cultures and consideration of empiric antimicrobial management based on
practical probability cut-offs (Additional file 2: Figure S1).
The tool developed in this study had the lowest false
positive rate while maintaining a high sensitivity (Fig. 2)
compared to previously published tools [5–14]. In
addition, when an equal period prevalence was used to
compare the tools, our study tool had a negative posttest probability that was equal to or lower than previously published screening tools with better overall
metrics for sensitivity and specificity [5–14] (Table 2).
Mahieu et al. in 2000, developed a screening tool with
high sensitivity and low negative post-test probability
that assigns points if various clinical and laboratory parameters, including CRP, polymorphonuclear neutrophil
(PMN) fraction, temperature, number of days of Total
Parenteral Nutrition (TPN), and platelet count, exceed a
certain threshold [7]. The model’s performance was
tested at various cut-off points, with a score of 8 or
greater having the highest sensitivity and lowest negative
post-test probability. Despite the screening tool’s excellent sensitivity, its ability to differentiate between
bacteremic and non-bacteremic neonates is poor, with a
specificity of only 43% [7] .
Despite the high sensitivity of some previously developed screening tools [5–8, 11, 13], their low specificity
would result in an inability to differentiate between
bacteremic and non-bacteremic neonates. While the priority is to detect all neonates with bacteremia, a tool that
over-selects for bacteremia is of little use clinically.
Our study was not without limitations. Given that a
portion of our study was retrospective, there is a potential for confounding factors to impact outcomes; however, we hope that the incorporation of a prospective
component has minimized any confounding. Furthermore, we were unable to collect complete data sets for
all neonates due to the observatory nature of the study
design. The inability to collect complete data sets may
have impacted on our ability to evaluate parameters
which were not often obtained (e.g. change in level of
consciousness, liver function tests, arterial lactate, venous lactate, and albumin). Since we only included neonates with full data sets in the final analysis to create
our model, our final sample size was reduced from 153
to 61, which may have influenced our ability to identify significant parameters with Pearson’s correlation (univariate
Walker et al. BMC Pediatrics
(2019) 19:253
Page 7 of 9
Table 2 Performance comparison of study developed tool to currently published screening tools [5–14]
Sensitivity Specificity Period
Positive
Negative Positive
Negative False
False
Study Developed
Prevalence Post-Test Post-Test Likelihood Likelihood Positive Negative Tool Negative PostProbability Probability Ratio
Ratio
rate
Rate
Test Probability at
Citation Bacteremia
Period Prevalence
Study Developed Tool
P value > 0.415
0.90
0.80
0.51
0.82
0.11
4.50
0.12
0.20
0.10
–
Mahieu et al.,
2000 [7]
Score ≥ 8
0.95
0.43
0.41
0.54
0.08
1.67
0.12
0.57
0.05
0.08
Score ≥ 11
0.60
0.84
0.41
0.72
0.25
3.75
0.48
0.16
0.40
0.08
Score ≥ 14
0.26
1.00
0.41
1.00
0.34
9999.00
0.74
0.00
0.74
0.08
Score ≥ 11
plus
positive
culture
0.72
0.87
0.41
0.79
0.18
5.50
0.32
0.13
0.28
0.08
Score ≥ 11
0.84
0.42
0.55
0.64
0.32
1.45
0.38
0.58
0.16
0.13
Score ≥ 11 + 3 RFs
0.82
0.67
0.55
0.75
0.25
2.48
0.27
0.33
0.18
0.13
Mahieu et al.,
2002 [5]
Singh et al.,
2003 [8]
Score ≥ 1
0.87
0.29
0.29
0.33
0.16
1.23
0.45
0.71
0.13
0.05
Score ≥ 2
0.53
0.80
0.29
0.52
0.19
2.65
0.59
0.20
0.47
0.05
Okascharoen et al.,
2005 [9]
Score ≥ 4
0.82
0.74
0.17
0.39
0.05
3.15
0.24
0.26
0.18
0.02
Score ≥ 5
0.70
0.82
0.17
0.44
0.07
3.89
0.37
0.18
0.30
0.02
Score ≥ 6
0.47
0.96
0.17
0.71
0.10
12.00
0.55
0.04
0.53
0.02
0.56
0.71
0.39
0.55
0.28
1.93
0.62
0.29
0.44
0.07
Validation
Cohort
Score ≤ 3
(low risk of
sepsis)
0.97
0.39
0.33
0.43
0.40
1.6
0.07
0.61
0.03
0.06
Validation
Cohort
Score 4–7
(medium
risk of
sepsis)
0.77
0.43
0.33
0.48
0.27
1.35
0.53
0.57
0.23
0.06
Validation
Cohort
Score ≥ 8
(high risk of
sepsis)
0.2
0.98
0.33
0.99
0.85
10
0.82
0.02
0.8
0.06
≥1 clinical
signs
0.90
0.23
0.27
0.30
0.14
1.17
0.43
0.77
0.10
0.04
≥2 clinical
0.52
0.65
0.27
0.36
0.21
1.49
0.74
0.35
0.48
0.04
Dalgic et al.,
2006 [10]
Score = 6–12
Okascharoen et al.,
2007 [6]
Kudawla et al.,
2008 [11]
Walker et al. BMC Pediatrics
(2019) 19:253
Page 8 of 9
Table 2 Performance comparison of study developed tool to currently published screening tools [5–14] (Continued)
Sensitivity Specificity Period
Positive
Negative Positive
Negative False
False
Study Developed
Prevalence Post-Test Post-Test Likelihood Likelihood Positive Negative Tool Negative PostProbability Probability Ratio
Ratio
rate
Rate
Test Probability at
Citation Bacteremia
Period Prevalence
signs
≥2 markers
0.48
0.70
0.27
0.37
0.21
1.60
0.74
0.30
0.52
0.04
≥1 clinical sign +
≥ 2 markers
0.95
0.18
0.27
0.30
0.09
1.16
0.28
0.82
0.05
0.04
Score ≥ 1
0.77
0.50
0.54
0.64
0.35
1.54
0.46
0.50
0.23
0.12
Score ≥ 2
0.42
0.82
0.54
0.73
0.45
2.33
0.71
0.18
0.58
0.12
1 of 4 signs present 0.97
0.37
0.27
0.36
0.03
1.54
0.08
0.63
0.03
0.04
Rosenberg et al.,
2010 [12]
Bekhof et al., 2013 [13]
analysis) and the model development with iterative binary
logistic regression. Lastly, neonates with a positive blood
culture growing CONS, bacteria typically considered to be
contaminants when isolated in the adult population, were
included or excluded from the study based on a combination of culture result and clinical judgement. The partially
subjective nature of this approach to inclusion or exclusion
of a neonate from the study, although not ideal, is difficult
to avoid even in a purely prospective study in neonates, due
to the subjective current approach to treatment of CONS
bacteremia in neonates [25, 26].
Conclusions
A clinical tool that can be used at the bedside to determine the probability that a neonate has late-onset
bacteremia could assist clinicians in the decisionmaking process when it comes to requesting blood
cultures and initiating broad-spectrum antibiotics in
the NICU. The screening tool developed in this
study incorporates four parameters that are readily
available to clinicians through routine monitoring
and standard care. Whereas current screening tools
aim only to detect bacteremia, our tool has the potential capacity to differentiate between bacteremic
and non-bacteremic neonates – a feature that could
be of significant value to clinicians who are deciding
whether to draw blood cultures or initiate broad
spectrum antibiotics in the event of negative blood
cultures. While the results of the preliminary validation of our tool in a small retrospective sample of
neonates were encouraging, prospective validation of
the screening tool in a larger sample size is required
and is planned at the study site.
Additional files
Additional file 1 : Table S1. Clinical and Laboratory Data Collection
Parameters. Table S2. Patient Characteristics of Entire Study Population
(N = 153). Table S3. Characteristics of Patients Included in Final
Bacteremia Tool. Table S4. Microbiological Characteristics in Blood
Cultures. Table S5. Parameters Significantly Associated with Bacteremia
(Univariate Analysis). Table S6. What Would Happen with Bacteremia
Tool if Pre-Test Probability were Different?. Table S7. Patient
Characteristics of Validation Cohort (N = 8). (DOCX 47 kb)
Additional file 2 : Figure S1. Screening tool for early identification of
bloodstream infection in neonates. This figure provides a screenshot of
the screening tool. (TIF 887 kb)
Abbreviations
ANOVA: Analysis of variance; BSI(s): Blood stream infection(s);
CART: Classification and Regression Tree; CONS: Coagulase negative
Staphylococcus spp; CRP: C-reactive protein; EPR: Electronic Patient Record;
FiO2: Friction of inspired oxygen; MAP: Mean arterial pressure;
NICU: Neonatal intensive care unit; NPV: Negative predictive value;
PCT: Procalcitonin; PMN: Polymorphonuclear neutrophil; PPV: Positive
predictive value; ROC: Receiver Operating Characteristic; SHSC: Sunnybrook
Health Sciences Centre; TPN: Total Parenteral Nutrition; VLBW: Very low birth
weight
Acknowledgments
None.
Authors’ contributions
SANW: conceived the project idea, was the senior investigator contributing
to and overseeing all phases of this research (protocol, conduct, data
analysis, manuscript). MC: was involved in all phases of the study (protocol,
conduct, data analysis, manuscript). ME: contributed to the protocol and
manuscript. JC: assisted with data collection, protocol and manuscript. AR:
contributed to the protocol and manuscript. CF: assisted with data
collection, protocol and manuscript. DI: assisted with data collection,
protocol and manuscript. All Authors read and approved the manuscript.
Funding
No funding was obtained for any component of this study.
Walker et al. BMC Pediatrics
(2019) 19:253
Availability of data and materials
The datasets used and/or analysed during the current study are available
from the corresponding author on reasonable request.
Ethics approval and consent to participate
This study was approved with the need for informed consent waived by the
Sunnybrook Health Sciences Centre (SHSC) Research Ethics Board on January
13, 2015.
Consent for publication
Not applicable.
Competing interests
The authors declare that they have no competing interests.
Author details
1
Department of Pharmacy E-302, Sunnybrook Health Sciences Centre (SHSC),
2075 Bayview Avenue, Toronto, ON M4N 3M5, Canada. 2Leslie Dan Faculty of
Pharmacy, University of Toronto, Toronto, Ontario, Canada. 3SHSC, Women
and Babies Program, Toronto, Ontario, Canada.
Received: 13 April 2019 Accepted: 16 July 2019
References
1. Plano LRW. The changing spectrum of neonatal infectious disease. J
Perinatol. 2010;30:S16–20.
2. Stoll BJ, Hansen N, Fanaroff AA, Wright LL, Carlo WA, Ehrenkranz RA, et al.
Late-onset Sepsis in very low birth weight neonates: the experience of the
NICHD neonatal research network. Pediatr. 2002;110(2):285–91.
3. Wirtschafter DD, Padilla G, Wan K, Trupp D, Fayard EES. Antibiotic use for
presumed neonatally acquired infections far exceeds that for central lineassociated blood stream infections: an exploratory critique. J Perinatol. 2011;
31:514–8.
4. Schelonka RL, Chai MK, Yoder BA, Hensley D, Brockett RM, Ascher DP.
Volume of blood required to detect common neonatal pathogens. J
Pediatr. 1996;129(2):275–8.
5. Mahieu LM, De Dooy JJ, Cossey VR, Goosens LL, Vrancken SL, Jespers AY, et
al. Internal and external validation of the NOSEP prediction score for
nosocomial sepsis in neonates. Crit Care Med. 2002;30(7):1459–66.
6. Okascharoen C, Hui C, Cairnie J, Morris AM, Kirpalani H. External validation
of bed side prediction score for diagnosis of late-onset neonatal sepsis. J
Perinatol. 2007;27:496–501.
7. Mahieu LM, De Muynck AO, De Dooy JJ, Laroche SM, Van Acker KJ.
Prediction of nosocomial sepsis in neonates by means of a computerweighted bedside scoring system (NOSEP score). Crit Care Med. 2000;28(6):
2026–33.
8. Singh SA, Dutta S, Narang A. Predictive clinical scores for diagnosis of late
onset neonatal septicemia. J Trop Pediatr. 2003;49(4):235–9.
9. Okascharoen C, Sirinavin S, Thakkinstian A, Kitayaporn D, Supapanachart S. A
bedside prediction-scoring model for late onset neonatal Sepsis. J Perinatol.
2005;25(12):778–83.
10. Dalgic N, Ergenekon E, Koc E, Atalay Y. NOSEP and clinical scores for
nosocomial sepsis in a neonatal intensive care unit (letter). J Trop Pediatr.
2006;52(3):226–7.
11. Kudawla M, Dutta S, Narang A. Validation of a clinical score for the
diagnosis of late onset neonatal septicemia in babies weighing 1000-2500
g. J Trop Pediatr. 2008;54(1):66–9.
12. Rosenberg RE, Ahmed ASMNU, Saha SK, Chowdhury MAKA, Ahmed S, Law
PA, et al. Nosocomial sepsis risk score for preterm infants in low resource
settings. J Trop Pediatr. 2010;56(2):82–9.
13. Bekhof J, Reitsma JB, Kok JH, Van Straaten IHLM. Clinical signs to identify
late-onset sepsis in preterm infants. Eur J Pediatr. 2013;172(4):501–8.
14. Verstraete EH, Blot K, Mahieu L, Vogelaers D, Blot S. Prediction models for
neonatal health care-associated sepsis: a meta-analysis. Pediatrics. 2015;
135(4):e1002–14.
15. Yapicioglu H, Ozlu F, Sertdemir Y. Are vital signs indicative for bacteremia in
newborns? J Matern Fetal Neonatal Med. 2015;28(18):2244–9.
16. Oeser C, Lutsar I, Metsvaht T, Turner MA, Heath PT, Sharland M. Clinical trials
in neonatal sepsis. J Antimicrob Chemother. 2013;68:2733–45.
Page 9 of 9
17. Ng PC. Diagnostic markers of infection in neonates. Arch Dis Child Fetal
Neonatal Ed. 2003;89:F229–F35.
18. Streimish I, Bizzarro M, Northrup V, Wang C, Renna S, Koval N, et al.
Neutrophil CD64 with hematologic criteria for diagnosis of neonatal Sepsis.
Am J Perinatol. 2014;31:21–30.
19. Adly AAM, Ismail EA, Andrawes NG, El-Saadany MA. Circulating soluble
triggering receptor expressed on myeloid cells-1 (sTREM-1) as diagnostic
and prognostic marker in neonatal sepsis. Cytokine. 2014;65:184–91.
20. Sarafidis K, Soubasi-Griva V, Piretzi K, Thomaidou A, Agakidou E, Taparkou A,
et al. Diagnostic utility of elevated serum soluble triggering receptor
expressed on myeloid cells (sTREM)-1 in infected neonates. Intensive Care
Med. 2010;36:864–8.
21. Prashant A, Vishwanath P, Kulkarni P, Sathya NP, Gowdara V, Nataraj SM, et
al. Comparative assessment of cytokines and other inflammatory markers
for the early diagnosis of neonatal sepsis-a case control study. PLoS One.
2013;8(7):e68426. />22. Gokmen Z, Ozkiraz S, Kulaksizoglu S, Kilicdag H, Ozel D, Ecevit A, Tarcan A.
Resistin-a novel feature in the diagnosis of sepsis in premature neonates.
Am J Perinatol. 2013;30(6):513–8.
23. Suguna Narasimhulu S, Hendricks-Munoz KD, Borkowsky W, Mally P.
Usefulness of urinary immune biomarkers in the evaluation of neonatal
sepsis: a pilot project. Clin Pediatr. 2013;52(6):520–6.
24. Weinstein MP. Blood culture contamination: persisting problems and partial
Progress. J Clin Microbiol. 2003;41(6):2275–8.
25. Venkatesh MP, Placencia F, Weisman LE. Coagulase-negative staphylococcal
infections in the neonate and child: an update. Semin Pediatr Infect Dis.
2006;17:120–7.
26. Isaacs D. A ten year, multicentre study of coagulase negative staphylococcal
infections in Australasian neonatal units. Arch Dis Child Fetal Neonatal Ed.
2003;88:F89–93.
27. Anderson T, Rubin H. Statistical inference in factor analysis. Berkeley:
University of California Press; 1956.
28. Everitt BS. Multivariate analysis: the need for data, and other problems. Br J
Psychiatry. 1975;126:237–40.
29. Gorsuch R. Factor analysis. Second ed. Hillsdale: Lawrence Erlbaum
Associates; 1983.
30. Kline P. A handbook of test construction: introduction to psychometric
design. London: Methuen and Co; 1986.
31. Nunnally J. Psychometric theory. Second ed. New York: McGraw-Hill; 1978.
32. Velicer W, Fava J. Effects of variable and subject sampling on factor pattern
recovery. Psychol Methods. 1998;3:231–51.
Publisher’s Note
Springer Nature remains neutral with regard to jurisdictional claims in
published maps and institutional affiliations.