Economic growth and stock market development in Bahrain
Bạn đang xem bản rút gọn của tài liệu. Xem và tải ngay bản đầy đủ của tài liệu tại đây (123.03 KB, 14 trang )
Journal of Applied Finance & Banking, vol. 5, no. 2, 2015, 67-80
ISSN: 1792-6580 (print version), 1792-6599 (online)
Scienpress Ltd, 2015
Economic Growth and Stock Market Development in
Bahrain
Batool K. Asiri 1 and Mohamed A. Abdalla 2
Abstract
This study investigates the relationship between stock market development and economic
growth in the Kingdom of Bahrain over the twenty-five year period of 1990 to 2014.
Using regression analysis, the study analyzes the relationship between economic growth,
measured by GDP growth rate, and stock market indicators, such as size, liquidity,
All-Share Index, turnover, and market capitalization. The first major finding is that stock
markets indicators have influence on economic growth in Bahrain. The most significant
of these variables are All-Share Index, market capitalization, and turnover ratio. This
result indicates that stock market development leads to economic growth in Bahrain.
Secondly, by investigating the effect of economic growth on stock market development,
the study confirms that economic growth, in turn, also leads to development of the stock
market. As such, when the relationship between economic growth and stock market
development indicators is subjected to analysis, findings show that stock market
development indicators explain variation in economic growth rates even at the sector level.
These findings have clear policy implications, in that they provide evidence that
strengthening the growth and reform of the stock market will help enhance economic
growth in the country; therefore, the government should be encouraged to continue its
efforts in this respect
JEL classification numbers: O16, O40
Keywords: Bahrain Bourse, economic growth, financial crisis, stock market indicators
1
2
Associate Professor, Department of Economics & Finance, University of Bahrain.
Assistant Professor, Department of Economics & Finance, University of Bahrain.
Article Info: Received : October 24, 2014. Revised : December 3, 2014.
Published online : March 1, 2015
68
Batool K. Asiri and Mohamed A. Abdalla
1 Introduction
Realizing the depleting nature of oil, Bahrain was one of the first Gulf Cooperation
Council (GCC) countries to make attempts to diversify its economy to generate another
source of income besides oil revenue. In this respect, considerable attention has been
given to the development of a sound financial sector that would make Bahrain the
financial centre of the region. Stock markets play an important role in channeling savings
productively, to the real sector of the economy, and provide a strong link between savings
and investment. Their effectiveness and efficiency influences the volume and quantity of
investment, which in turn facilitate economic growth. A growing body of theoretical and
empirical literature shows how stock markets mobilize savings, allocate resources,
diversify risk and contribute to economic growth. A well-developed stock market
provides savers relatively higher yield, thus working to increase saving rates in the
economy. Stock markets also provide savers with financial instruments that meet their
risk preferences, and thus encourage saving. A better savings mobilization may increase
the overall savings rate in the economy (Livine and Zarvos, 1998). In addition, by
reducing information and transaction costs, stock markets facilitate the transfer of funds
from savers to borrowers. Stock markets provide facilities that allow companies to raise
funds at lower costs, and make them less dependent on bank financing. Many authors, as
will be seen in literature review, argue that there is a strong relationship between the
development of stock markets and economic growth. Well-developed stock markets lead
to higher investment rate, thus increasing economic growth in the country.
Realizing the importance of stock markets, the government of Bahrain has undertaken
many policies to establish the Bahrain stock market (now named the Bahrain Bourse),
which started operation in 1989. Moreover, the government has designed many policies to
develop the financial sector in the country in the hopes of making Bahrain the financial
hub of the region.
Currently, Bahrain is the home of more than 400 licensed financial institutions, as
reported by the Central Bank of Bahrain, CBB (Central Bank of Bahrain 2014),
representing a mixture of international, regional and local institutions who provide a wide
range of financial services. Regulated by the CBB, the financial sector is now the second
most important sector in the economy, after oil, contributing around 16.7% to the GDP of
the country and providing employment for more than 14,000 employees, 66% of who are
Bahrainis. An assessment of GDP growth rate in Bahrain in 2013 drives home this point,
as it rose to 4.79% in 2013 from 4.42% in 2012. The inflation rate simultaneously
declined from 2.81% in 2012 to 2.68% in 2013. Thus, it is worth investigating whether
the stock market development has stimulated economic growth in Bahrain, or whether
economic growth has fueled the development of the stock market. Using data culled from
the period of 1990-2014, the purpose of this paper is to investigate whether stock market
development has contributed to economic growth in Bahrain, or whether economic
growth has contributed to the development of the stock market. The analysis is conducted
using stepwise multiple regression technique. Proceeding from this introduction, the paper
provides a short overview and main features of the stock market in Bahrain in section two.
Section three presents a short review of literature on this subject. Section four discusses
the data and methodology employed in the study, while the results are presented and
assessed in section five. Finally, some concluding remarks are posed in section six.
Economic Growth and Stock Market Development in Bahrain
69
2 Background of the Bahrain Bourse
Bahrain is considered as one of the major financial hubs in the Middle East. Its strategic
geographical position and open-market economy, coupled with the government’s dynamic
economic policy and a well-trained national workforce, have helped Bahrain achieve this
status. Bahrain also has the advantage of a modern and well-planned infrastructure,
together with excellent air, sea and road links. The tax-free economic structure and the
ability to freely remit funds abroad give Bahrain its unique appeal, as well as considerable
advantage in attracting foreign investors to the country.
It was back in 1920 that the first branches of a commercial bank (the Standard Chartered
Bank; then the Eastern Bank) were opened in Bahrain and in the region. The purpose of
this bank was to facilitate the growth of a strong and stable business community. By 1957,
Bahrain had its first public shareholding company: the National Bank of Bahrain.
However, in the late 1980s, Bahrain realized there was a growing need for an organized
stock market due to the economic growth spurred by the oil price boom in the region. As
a result, the government, in cooperation with the International Finance Corporation (IFC),
highlighted the importance of establishing an official stock market in Bahrain. So in 1987,
the Amiri Decree No. 4 was issued, establishing the Bahrain Stock Exchange (BSE),
which officially commenced operations on 17th June 1989 with 29 companies listed on the
Exchange. In 2010, the Bahrain Stock Exchange was renamed the Bahrain Bourse. The
Bahrain Bourse is considered to be one of the most innovative stock markets in the region.
It is continuously upgrading its facilities, and in recent years has relaxed the rules for
foreign investors, thereby opening up the market to all. It aims to enhance the services it
offers to investors while monitoring its standards in accordance with the international
norms employed to improve efficiency and maintain integrity in the market.
Over the years, the Bahrain Bourse has grown to become one of the leading emerging
stock markets in the region, having started with 29 listed companies in 1989, which has
increased to 47 listed companies in 2014. Despite a decrease in government support in
2013, the Bahrain Bourse showed noticeable, wider-ranging growth rates as compared to
the fiscal growth witnessed in 2012, which is a clear indication of its increasing
prevalence. The total assets of the Bourse increased to BD 9,397,052 in 2013, from
BD 8,961,272 in 2012, and its liabilities amounted to only BD 969,517, compared to BD
1,205,617 in 2012. In addition, shareholders’ equity increased from BD 7,755,655 in
2012 to BD 8,427,535 in 2013.
As reported by the Bahrain Bourse website, the Bahrain All-Share Index increased by
17.2% in 2013, and the value of the shares traded increased by 104.88% compared to the
values in 2012. The volume of shares traded rose by 197.55% and the number of
transactions increased by 39.62%. The Commercial Banks sector captured 68.01% of the
total trading value, followed by the Investment sector, which totaled at 14.13%, the
Services sector at 8.7%, the Industrial sector at 2.47%, the Insurance sector at 0.34% and
finally the Hotels and Tourism sector at 0.14%. Market capitalization of the Bahraini
public shareholding companies listed on the Bourse increased from 5.86 billion at the
beginning of the year to BD 6.96 billion at the end, an increase of 18.91%. The Bahrain
Bourse listed a Government Development Sukuk issue of BD100 million, as well as a
Government Development Bonds issue of BD 150 million. In addition, US$ 9.9 million in
mutual funds were also listed on the Bourse.
70
Batool K. Asiri and Mohamed A. Abdalla
3 Review of the literature
Debate about the role of the financial system in achieving higher economic growth is
well-rooted in the history of economic thought. Considerable amount of both theoretical
and empirical research has been undertaken to assess the role a nation’s financial system
plays in its economic growth. Most of these studies, however, concentrate on the
relationship between banks and financial intermediaries and economic growth. Livine
(2005) provides a detailed summary of theoretical and empirical results in this respect. It
wasn’t until the publication of a paper by Livine and Zarvos in 1998 that more attention
was granted to the role of stock markets in the economic growth process. They
investigated whether measures of stock market liquidity, size, volatility, and integration
with world capital markets are robustly correlated with current and future rates of
economic growth, capital accumulation, productivity improvements, and saving rates,
using data collected from 47 countries from 1976 through 1993. Livine and Zarvos (1998)
found that stock market liquidity and banking development both positively predict growth,
capital accumulation, and productivity improvements when entered together in
regressions, even after controlling for economic and political factors.
Antonios (2010) investigated the causal relationship between stock market development
and economic growth in Germany from 1965 to 2007 using a Vector Error Correction
Model (VECM). His results indicated that there is a unidirectional causality between
stock market development and economic growth, with clear direction from stock market
development to economic growth. Ovat (2012) investigated the Nigerian stock market,
using stock market size and stock market liquidity as stock market indicators, and found
that stock market liquidity has dominance over market size. He discovered that while
there is a two-way causation between stock market liquidity and economic growth, with
the strength of causality predominantly coming from stock market liquidity, market size is
found to have little or no effect on growth. His results equally suggested a one-way
causation between financial deepening and growth, with causality flowing from financial
depending to economic growth. In his analysis of the stock market and economic growth
in Kuwait, Bentour (2014) found market capitalization to have a positive impact on the
Gross Domestic Product. Wai Mun et al (2008), working with the Malaysian economy,
found that stock market Granger-caused economic activity had no reverse causality.
Suliman and Dafaalla (2011) investigated stock market development and economic
growth in Sudan, and concluded that the causal relationship between stock market
development and economic growth is sensitive to the proxy used for describing the stock
market development. They found that when the stock market capitalization is used, a
bidirectional causal relationship can be observed between stock market development and
economic growth, and when the stock market liquidity is used, the results exhibit a
unidirectional causal relationship from economic growth to stock market development.
Their overall conclusion is that Granger causality test results suggest that stock market
development in Sudan leads to economic growth. Hossain et al (2013) examined the
co-integration relationship and causality direction between the stock market and the
economic growth of Malaysia using time series quarterly data acquired over nearly two
decades, from 1991 to 2009, and found that there exists a long and short-run correlation
between stock market and economic growth; however, Granger Causality test results
suggest a unidirectional causality relationship.
Ali and Aamir (2014), using panel data from five East Asian countries for the period of
1991 to 2011 concluded that GDP per capita is significantly explained by independent
Economic Growth and Stock Market Development in Bahrain
71
variables, which include stock market size and liquidity, foreign direct investment (FDI) ,
investments, government expenditure as percentage of GDP (EXP) and gross domestic
savings as percentage of GDP (GDS). Shahbaz, et al (2008) investigated causal
relationship between stock market development and economic growth in Pakistan and
found that there exist a very strong relationship between stock market development and
economic growth. They found that Engle-Granger-causality estimation confirms in the
long-run that there is bi-directional causality between stock market development and
economic growth. However, in terms of the short-run, they found only one-way causality,
i.e., from stock market development to economic growth. Rioja and Valev (2014) studied
the effects of stock markets and banks on sources of economic growth, productivity and
capital accumulation, using a large cross-country panel that included high- and
low-income countries. They found that, in low-income countries, while banks have a
sizable positive effect on capital accumulation, stock markets have not contributed to
capital accumulation or productivity growth. Conversely, they found that in high-income
countries, stock markets have sizable positive effects on both productivity and capital
growth, while banks affect only capital accumulation.
Investigating the causal relationship between stock market performance and economic
growth in Kenya for the period of 2001 to 2010, using quarterly secondary data, Olweny
and Kimani (2011) found that the causality between economic growth and stock market
runs unilaterally or entirely in one direction from the share index to the GDP. Wild and
Lebdaoui (2014) investigated the relationship between stock market development and
economic growth in Morocco from 2000 to 2013 on a quarterly basis. As proxies for
stock market development, they used the Morocco All Shares Index (MASI), market
liquidity, market capitalization and a principal component analysis based on the stock
market development index. They found that long-run association exists between stock
market development and economic growth, as do unidirectional Granger-causalities
running from MASI, traded volume and stock market index to the real GDP, but no
evidence confirms the existence of Granger-causality from capitalization to the real GDP.
To the best of our knowledge, no paper attempted to investigate the relationship between
stock market development and economic growth in Bahrain. Abdelbaki (2013) attempted
to investigate the relationship between macroeconomic variables and Bahraini stock
market development using the Autoregressive Distributed Lag model. He found that
income level, domestic investment, banking system development, private capital flows
and stock market liquidity are important determinants of Bahraini stock market
development. This is different than the current paper in that we address the question of
whether stock market development explains the changes in economic growth in Bahrain,
or economic growth rate has stimulated the development of the Bahrain Bourse.
4 Methodology and Data
Time series data are collected for a period of 25 years (1990 - 2014). Data are extracted
from different sources: World Bank Database for economic indicators and Bahrain
Bourse for the stock market indicators. To measure the stock market development
indicators, a set of variables are used following the methodology applied by Levine and
Zervos (1998). These variables along with their definitions are explained below and
listed briefly in Table 1.
72
Batool K. Asiri and Mohamed A. Abdalla
1. Size of the market (SIZE): This is measured by the value of all listed domestic
companies in the Bahrain Bourse divided by the GDP.
2. Liquidity of the market (LIQ): Turnover (TROV) could be used as a liquidity
indicator. This stands as a measure of the volume of domestic companies traded in ratio
to the size of the market. According to Levine and Zervos (1998), high turnover indicates
low transactions costs. In addition, a large stock market is not necessarily a liquid market.
Alternatively, liquidity could be measured as the value of the traded shares of domestic
companies relative to the GDP. Demirguc-Kunt and Levine (1996) showed that value
traded may be significantly different from turnover. Levine and Zervos (1998) argued that
value traded captures trading relative to the size of the economy, and turnover measures
trading relative to the size of the stock market.
3. Stock market All-Share Index (ASI): This measures the overall performance of the
Bahrain Bourse, i.e. the indicator of the average performance of all listed companies.
4. Market capitalization (MKTCAP): This measures the size of the market and its
performance.
5. Sector Index (SECINDEX): This is a measure of market index for individual
sectors.
6. Growth rate in real gross domestic product (GGDP): This is measured as the
economic indicator and is computed by measuring the percentage change in the GDP
from the pervious to the current year.
1
The variables
ASI
2
3
GGDP
LIQ
4
5
6
MKTCAP
SECINDEX
SIZE
7
TROV
Table 1: List of the Variables
Definitions
Bahrain Bourse All-Share Index as a measure of stock market
index
Growth rate of real GDP as measure of economic growth
Value of traded shares relative to real GDP as measure of
Liquidity
Total market capitalization
Sector index by Bahrain Bourse
Value of all listed domestic companies in Bahrain Bourse divided
by GDP
Volume of trades shares relative to size as a measure of Turnover
To test the relationship between stock market indicators and economic growth, two main
models (model 1 and 2) are hypothesised. One model is used for the economic indicator,
i.e. growth rate in the GDP, and the other one is for the stock market indicators, such as:
the All-Share Index, liquidity, market capitalization, size and turnover. Model 1
hypothesises that economic growth rate is affected by the stock market indicators
identified in the study. The hypothesis is formulized as follows:
GGDPt = α + β1 ASI t + β 2 LIQt + β 3 MKTCAPt + β 4 SIZEt + β 5TROVt + ε t
(1)
Where α is the constant, β1, β2 … β5 are standardized coefficients to be estimated, and εt is
a random error term. The null hypothesis proposed here is that βi (i = 1, 2 …, 5) is equal
to zero, meaning that variable i does not affect the dependent variable GGDP at time t.
Model 2 hypothesises that economic growth affects stock market indicators, and stock
Economic Growth and Stock Market Development in Bahrain
73
market indicators change in response to changes in the GDP rather than causing GDP
growth. To capture this relationship, each stock market indicator is considered as a
dependent variable and regressed on GGDP as the independent variable. For example, the
model for the ASI is specified as:
ASI t = α + β1GGDPt + ε t
(2)
The null hypothesis proposed in this respect is that if β1 = 0, then economic growth does
not explain the variable under consideration. Similar models are specified for the other
stock market indicators as follows:
LIQt = α + β1GGDPt + ε t
MKTCAPt = α + β1GGDPt + ε t
(3)
SIZEt = α + β1GGDPt + ε t
TROVt = α + β1GGDPt + ε t
(5)
(4)
(6)
Further analysis will be performed in this study: First, to test the relationship between the
Bahrain Bourse and economic growth sector-wise, and second, to test the effect of
financial crisis on the developed models.
4 Findings and Discussion
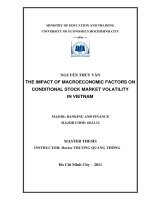
Table 2 highlights the descriptive statistics for each variable used in the models. Figure 1
shows the scatter diagram between the GGDP and the ASI and the GGDP and market
capitalization. Both charts exhibit a positive correlation between market growth and stock
market indicators.
Table 2: Descriptive statistics
Variable
Symbol
Sample
Min
Max
Mean
Std Dev
All-Share Index
ASI
133
1,040.26 2,794.30 1,769.93
633.74
Growth rate in
GGDP
133
1.91
8.29
4.87
2.06
GDP
Liquidity
LIQ
105
19,928
642,786
137,100
162,856
Market
MKTCAP
84
5,094.47 10,185.22 7,007.585 1,418.861
capitalization (in
ml)
Real GDP (in ml)
GDPR
133
1,720.26 5,250.24 3,080.44
996.77
Size
SIZE
84
469
1,197
750
199
Turnover ratio
TROV
91
0.12
17.43
2.89
2.52
74
Batool K. Asiri and Mohamed A. Abdalla
Figure 1: Economic and Stock Market Indicators
Table 3 presents an indication of the relationship between economic growth and stock
market indicators through the correlation matrix. It highlights that all stock market
variables used in this study are positively correlated with the GDP growth rate. They are,
moreover, all significant at 1% level. The highest correlation coefficient (r = 0.717) is
with size, followed by the All-Share Index (0.614), and then the liquidity variable (r =
0.546). Observing the correlation between stock market indicators such as the All-Share
Index, size, turnover and liquidity, the strength of the relationship is found to be very high
(r = 0.872) between size and liquidity. This high correlation is explained by the fact that
increasing the size of the stock market increases its liquidity. This result is consistent with
findings of Demirgucs-Kunt and Levine (1996), which state that large stock markets
measured by equity capitalization are more liquid. As a result, both variables should not
be included in the same model to avoid the possibility of multicollinearity. The other two
high correlations are between size and market capitalization (r = 0.866) and liquidity and
market capitalization (0.775).
To test the significance of stock market variables in explaining the economic growth rate,
or GGDP, four models are used to gather estimates using stepwise multiple regression.
The results are summarized in Table 4. Model 1 in Table 4 indicates that two variables,
All-Share Index and size, are highly significant at 1% level, while turnover is significant
at 5% level and liquidity is insignificant. Due to the high correlation between liquidity
and size, liquidity was dropped by the stepwise regression and deemed to be insignificant
to the model. Market capitalization and size are also highly correlated (r = 0.866), and as
a result, market capitalization was also dropped from the model through the stepwise
regression. The relatively high R2 (0.733) indicates a high degree of relevance. The
relative importance of each variable, as indicated by its coefficient, indicates that the
All-Share Index exerts more effect on growth rates in the GDP (GGDP) than the other
two variables. Durban-Watson (DW) is 2.07, which is an indication of no serial
correlation.
Economic Growth and Stock Market Development in Bahrain
75
Table 3: Correlation Matrix
MKTCAP
TROV
SECINDEX
GGDP
ASI
SIZE
LIQ
MKTCAP
1
*** significant at 1%,
TROV
0.123
1
SECINDEX
0.093
0.140
1
GGDP
0.406***
0.340***
0.260***
1
ASI
0.231**
0.252**
0.355***
0.614***
1
SIZE
0.866***
0.245**
0.235**
0.717***
0.636***
1
LIQ
0.775***
0.241**
0.226**
0.546***
0.583***
0.872***
1
** significant at 5%
Models 2 and 3 in Table 4 estimate the effects of liquidity and market size on economic
growth. Liquidity is statistically significant at 5% when used with All-Share Index.
Market size becomes highly significant at 1% level when used as a separate single
independent variable. Model 4 investigates the importance of All-Share Index by itself in
explaining variation in economic growth, which seems to be highly significant, with an
even higher coefficient compared to Model 1 in the same table. Naturally, the value of R2
decreases when there are fewer independent variables. As discussed, we can conclude that
the null hypothesis is rejected, and therefore stock market indicators do explain changes
in real GDP growth rates. Out of these four models, we can conclude that Model 1 is the
most accurate when it says that 73.3% of the variation in the development of the
economic growth in Bahrain is explained by the following variables: the All-Share Index,
stock market turnover ratio, and market size.
Table 4: Stock Market Indicators and GDP Growth Rate (GGDP)
Models
Constant
1
-1.270
(-2.834)
2
0.151
3
-0.012
4
-0.072
ASI
0.582
(7.847)***
0.637
(7.930)***
Independent variables
LIQ
SIZE
0.317
(4.282)***
0.175
(2.173)**
0.717
(9.306)***
TROV
0.123
(2.078)**
0.614
(8.898)***
R2
DF
DW
0.733
83
2.07
0.557
104
2.13
0.508
84
0.372
132
Dependent Variable: GGDP
t-values in parenthesis, *** significant at 1%, ** significant at 5%
To analyze the second hypothesis, which is the effect of economic growth on the stock
market, in other words whether changes in the real GDP cause changes in stock market
activities, we developed four models. These models are reported and summarized in Table
5, with the real GDP growth rate as an independent variable and each stock market
indicator as a dependent variable. It is clear from the results expressed in these models
that that changes in the economic growth rate of a nation affect stock market indicators,
since all coefficients haven been proven highly significant at 1% level, with the exception
of size.
76
Batool K. Asiri and Mohamed A. Abdalla
Table 5: GDP Growth Rate and Stock Market Indicators
Dependent
Models
Constant
Independent variable: GGDP
Variable
1139.304
0.614
1
ASI
(13.929)***
(8.898)***
-101,719
0.546
2
LIQ
(-2.643)***
(6.617)***
366,098,856
0.717
3
SIZE
(8.307)
(9.306)
0.340
4
TROV
0.739
(3.406)***
t-values in parenthesis, *** significant at 1%
R2
DF
0.372
132
0.291
104
0.508
83
0.105
90
As a new contribution to the current literature, we attempted to analyze the relationship
between economic growth and stock market development indicators sector-wise. For each
sector, we estimated the relationship between real GDP growth rate and stock market
variables to observe the effect in each sector, rather than developing a uniform assessment
of aggregate economic activity. Results of estimation are represented in Table 6. The
results indicate that for the commercial banks sector, investment sector and services
sector, only the sector index variable is statistically significant at 1% level. For the
industrial and the insurance sector, sector index and market capitalization are significant
at 1% and 5% level, respectively. For the hotels and tourism sector, it is the market
capitalization and turnover ratio that are significant, at 1% and 5% level, respectively. The
overall conclusion is that stock market development indicators do, indeed, explain
variation in economic growth rates, even at the sector level. Moreover, real growth in
GDP affects the sector index, as presented in Table 6.
To investigate the effect of GDP growth on each sector index, we estimated regression
equations using GDP growth rate as the independent variables and each sector index as
dependent variables; the results are presented in Table 7. As indicated in the table, while
growth in GDP stimulates growth of commercial banks, insurance and services sectors,
other sectors do not seem to be affected by GDP growth.
Table 6: Sector analysis - GGDP as Dependent Variable
Sectors
Commercial
Banks
Hotels & Tourism
Industrial
Insurance
Investment
Services
Constant
-1.776
MKTCAP
-0.803
0.689
(3.878)***
0.762
(4.211)***
0.477
(2.282)**
-2.612
-5.801
1.625
-2.592
SECINDEX
0.831
(4.726)***
TROV
0.66
0.451
(2.539)**
0.443
(2.449)**
0.493
(2.355)**
0.758†
(3.678)***
0.794
(4.133)***
R2
0.654
0.643
0.632
0.533
0.594
t-values in parenthesis, *** significant at 1%, ** significant at 5%, * significant at 10%
Economic Growth and Stock Market Development in Bahrain
77
Table 7: Sector Analysis - SECINDEX as Dependent Variable
R2
Sectors
Constant
GGDP
0.653
Commercial Banks
1,189
0.393
(3.555)***
0.648
Insurance
1,369
0.386
(3.508)***
0.603
Services
1,266
0.327
(3.119)***
t-values in parenthesis, *** significant at 1%
DF
18
18
18
To assess the impact of the 2007 – 2008 financial crisis, we separated the data into three
periods: 1990 to 2006 to represent the period pre-financial crisis, 2007 to 2008 to
represent the period during the crisis, and 2009 – 2014 to represent the post-crisis period.
Results of estimation are presented in Table 8. Results indicate that both liquidity and size
are statistically significant at 1% level, while the All-Share Index is significant at 5%
level, indicating that economic growth is affected by these variables. Since the crisis,
however, the All-Share Index and liquidity have become highly significant, while market
capitalization no longer seems to enter the equation. During the crisis, no significant
models were found, indicating that financial crisis caused variables and the economy to
function differently and unexpectedly; therefore, we cannot reject the null hypothesis that
there is no statistically significant difference between the period of crisis and pre crisis.
Table 8: Financial Crisis and Economic Growth
Status
Constant
ASI
LIQ
SIZE
Before the
0.258
-0.641
1.078
-1.420
Crisis
(2.326)**
(-4.032)***
(6.776)***
After the
-0.475
1.110
5.813
Crisis
(-6.001)***
(14.041)***
Dependent Variable: GGDP
t-values in parenthesis, *** significant at 1%, ** significant at 5%
R2
DF
0.639
34
0.855
34
Using the All-Share Index as the dependent variable and the growth rate of the GDP as
the independent variable for the period before the financial crisis, Table 9 highlights this
significant relationship at 1% level. This means that the growth rate of the GDP was
leading to the development of the stock market before the year 2007. But, running the
same model after the crisis, i.e. after 2008, all coefficients measured in at insignificant
levels, and the GDP growth rate could not give any explanation to the decreased utility of
the stock market indicators. Changing the dependent variable to size, a better
explanation is given, and a model can be adequately developed at 5% level of
significance.
78
Batool K. Asiri and Mohamed A. Abdalla
Table 9: Financial Crisis and Bahrain Bourse
Status
Dependent Variable
Constant
GGDP
Before the
1,597
0.457
ASI
Crisis
(19.095)***
(4.657)***
After the
576,844,905
0.372
SIZE
Crisis
(15.124)***
(2.305)**
t-values in parenthesis, *** significant at 1%, ** significant at 5%
R2
DF
0.199
83
0.139
34
5 Conclusion
This study investigates the relationship between stock market development and economic
growth in the Kingdom of Bahrain. Using stepwise multiple regression techniques, and
data that covers the twenty-five year period of 1990 to 2014, our investigation has
identified a number of stock market development indicators and used them to analyze
how the stock market affects economic growth in Bahrain, and vice versa. These
indicators include: Value of traded shares relative to the real GDP as measure of market
liquidity; volume of traded shares relative to size as a measure of turnover; the Bahrain
Bourse All-Share Index as a measure of stock market index; total market capitalization to
GDP as size; and market capitalization.
For the purposes of this study, economic growth is determined according to the real GDP
growth rate. To test the significance of stock market variables in explaining the economic
growth rate, we developed a number of regression models. The analysis produced various
findings. First, it determined that stock market indicators have substantial influence on
economic growth in Bahrain. The most significant variables include the All-Share Index,
size, and turnover. These results indicate that stock market development does, indeed,
stimulate economic growth in Bahrain. Secondly, investigating the effect of economic
growth on stock market development, results confirm that economic growth does cause
development of the stock market development. Thus, we have presented evidence
implicating a positive symbiotic relationship between the growth of the stock market and
the health of the economy in the Kingdom of Bahrain. This information may be valuable
in the future as we face economic booms as well as financial crises, or periods of
economic stagnation.
Generally, our results are consistent with the majority of theoretical and empirical studies
conducted on both developed and developing economies. However, our results indicate
that stock-market development has a stronger effect on economic growth than GDP
growth has on stock market indicators. This suggests that, in order to facilitate economic
growth in Bahrain, the government should be encouraged to promote policies that support
stock market expansion and financial sector development.
As a new contribution to the established body of literature, we have attempted to provide
an in-depth analysis of the relationship between economic growth and stock market
development indicators according to sector. We estimated the relationship between real
GDP growth rate and stock market indicators in each individual sector in order to observe
the effect on each sector separately, rather than grouping all the sectors together and
making blanket estimates of the effect on the aggregate economy. The overall conclusion
in this respect is that stock market development indicators play a significant role in
creating variation in economic growth rates, even at the sector level. To assess the impact
Economic Growth and Stock Market Development in Bahrain
79
of the 2007–2008 financial crisis, we separated the data into three periods: pre-crisis,
crisis, and post-crisis. Results indicate that stock market indicators do explain variation in
GDP growth before and after the crisis, while no significant models were proven relevant
during the crisis period, indicating the severe effect the crisis had on the economy. Hence,
we could not manage to find any relationship between the stock market and economic
growth during this period.
References
[1]
[2]
[3]
[4]
[5]
[6]
[7]
[8]
[9]
[10]
[11]
[12]
[13]
[14]
H. H. Abdelbaki, “Causality relationship between macroeconomic variables and
stock market development: Evidence from Bahrain”, The International Journal of
Business and Finance Research, 7(1), (2013), 69 - 84.
M. A. Ali and N. Aamir, “Stock market development and economic growth:
Evidence from India, Pakistan, China, Malaysia and Singapore”, International
Journal of Economics, Finance and Management Sciences. 2(3), (2014), 220 - 226.
A. Antonios, “Stock market and economic growth: An empirical analysis for
Germany”, Business and Economics Journal, 1, (2010), 1 - 5 BEJ-1.
E. Bentour, “Stock markets and economic growth in oil exporting countries:
Evidence from Kuwait”, MPRA Paper No. 55997, posted 26. May (2014), 1-11.
Central Bank of Bahrain (CBB): “Financial sector fact sheet,
www.cbb.gov.bh/page-p-financial_sector_fact_sheet.htm, 2014.
A. Demirgucs-Kunt and R. Levine, “Stock markets, corporate finance, and
economic growth: An overview,” World Bank Economics Review, 10(2), (1996),
233 - 239.
H. Wai-Mun, E. Chun-Siong, and T. Chai-Thing, “Stock market and economic
growth in Malaysia: Causality test”, Asian Social Science, 4(4), April (2008), 86 92.
M. K. Hossain, A. Hossain and R. Sadi, “An examination of the relationship
between stock market and economic growth: A study in Malaysia”, Journal of
Transformative Entrepreneurship, 1(2), (2013), 124 - 133.
R. Levine, “Finance and growth: Theory and evidence.” In Handbook of Economic
Growth, ed. Philippe Aghion and Steven N. Durlauf, Amsterdam: Elsevier, 865 –
934, 2005.
R. Levine and S. Zervos, “Stock markets, banks, and economic growth” The
American Economic Review, 88(3), June (1998), 537 - 558.
T. O. Olweny, and D. Kimani, “Stock market performance and economic growth:
Empirical Evidence from Kenya using Causality Test Approach” Advances in
Management & Applied Economics, 1(3), (2011), 153 - 196.
O. O. Ovat, “Stock market development and economic growth in Nigeria: Market
size versus liquidity”, Canadian Social Science, 8(5), (2012), 65 - 70.
F. Rioja and N. Valev, “Stock markets, banks and the sources of economic growth
in low and high income countries”, Journal of Economic Finance, 38, (2014), 302 –
320.
M. Shahbaz, N. Ahmed and L. Ali, ”Stock market development and economic
growth: Ardl causality in Pakistan”, International Research Journal of Finance and
Economics, 14, (2008), 182 - 195.
80
Batool K. Asiri and Mohamed A. Abdalla
[15] Z. S. Suliman, and H. A. Dafaalla, “Stock market development and economic
growth in Sudan (1995-2009): Evidence from Granger causality test”, Journal of
Business Studies Quarterly, 3(2), (2011), 93 - 105.
[16] J. Wild, and H. Lebdaoui, “Stock market performance and economic growth in
Morocco”, Global Advanced Research Journal of Management and Business
Studies, 3(5), May (2014), 207 - 216.