Lecture Principles of economics (Asia Global Edition) - Chapter 13
Bạn đang xem bản rút gọn của tài liệu. Xem và tải ngay bản đầy đủ của tài liệu tại đây (606.77 KB, 39 trang )
The Environment,
Health, and Safety
Chapter 13
McGrawHill/Irwin
Copyright © 2015 by McGrawHill Education (Asia). All rights reserved.
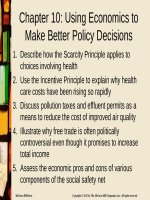
Learning Objectives
1.
2.
3.
4.
Use economic analysis to show how U.S.
health care system can be improved
Compare and contrast the ways in which
taxes and tradable permits can be used to
reduce pollution
Apply the Cost-Benefit Principle to improve
workplace safety
Show how economic analysis contributes to
debates regarding public health and domestic
security spending
132
Introduction
•
In the United States, Carter Administration
proposed response to oil shocks (1979)
–
•
Policy would
–
–
–
•
Add 50 cents/gallon to gas tax and rebate
proceeds by reducing Social Security taxes
Reduce gas consumption and dependence on
foreign oil
Reduce air pollution
Reduce traffic congestion
Opponents won by arguing that consumers
would buy the same amount of gas due to
rebates
133
Health Care Delivery
•
In the United States, health care spending has
grown faster than income
–
–
–
Up from 4% of national income in 1940 to 17% in
2010
Part of the increase is due to improved quality of
tests, procedures, drugs, etc.
Part is due to the third-party payment system
•
Growth in use of insurance for payments
–
Employer-provided and government-provided
134
Health Care Delivery
•
Cost-benefit test assures efficient allocation of
health care
–
•
•
Perform a service only if the benefit exceeds the
cost
Costs are easy to measure
Benefits are complicated
–
Usual measure is willingness to pay marginal cost
•
Some patients are unable to pay for basic services
–
–
Society assumes some responsibility via governmentprovided insurance
Confused by third-party payment system
135
Health Care for the Employed
•
Employer pays insurance
on behalf of employee
–
•
Medical provider cares
for patient / employee
–
•
Medical
Provider
Insurance
Company
Patient /
Employee
Patient co-pay
Medical provider bills insurance
–
•
Employees pay part of
the insurance premiums
Employer
Insurance pays provider
Insurance periodically reviews employer's
policy and adjusts rates
136
•
Price of hospital room is
$300 per day
–
–
–
Price ($/day)
Example: The Demand for
Hospital Care
3
0
0
If David pays, MC to
him is $300
D
David equates marginal
cost and marginal
1
3
Length of hospital stay (days)
benefit and stays
one day
If insurance pays, MC to David is zero
•
He stays 3 days
137
Full Insurance Coverage
Creates Waste
•
If David pays, stay is
1 day
If insurance pays,
stay is 3 days
–
–
–
Extra benefit of 2nd
and 3rd day to
David is $300
Extra cost is 2 days
times $300 per day
= $600
$300 surplus lost
Benefit from
extra stay
D
Lost surplus
from extra stay
S
300
Price ($/day)
•
Cost of
extra stay
1
3
Length of hospital stay (days)
138
Alternative Coverage Scheme
Insurance company pays
David $700
–
•
Insurance company
saves $200 compared
to a 3-day stay
David stays 1 day
–
–
3
0
0
Pays hospital $300
David keeps $400
•
•
Price ($/day)
•
D
1
3
Length of hospital stay (days)
The $300 benefit he would get from staying 3 days
PLUS $100 pure surplus
Total surplus increases $300
139
Insurance, Demand, and Waste
•
•
Amount of waste from full insurance depends
on the price elasticity of demand for medical
services
Research compared patients with first dollar
coverage to those with $1,000 deductibles
–
–
–
First-dollar coverage pays all expenses for the
insured's health care
$1,000 deductible pays all expenses after the
patient has paid $1,000
Deductible patients spent 40 – 50% less on
health care and had the same health outcomes
1310
Policy Implications
•
•
Research shows that when individuals pay for
their health care, they consume less
An more efficient system can be designed
–
–
•
Adopt a system of high deductible health
insurance
Use stipend payments for the poor
An efficient policy will increase the size of the
health care pie
1311
Health Maintenance
Organization (HMO)
•
An HMO is a group of physicians that provides
health services for a fixed annual fee
–
Reduced incentives to prescribe expensive tests
•
•
The doctor receives no additional fee for
prescribing and interpreting tests
In most cases, diagnoses and treatment will be
the same with conventional health insurance
and with an HMO
–
HMO costs less than conventional health
insurance
1312
U.S. Health Insurance
In 2009, 50 million Americans had no health
insurance…WHY?
•
Unregulated private insurance markets
–
Employers expenditures for health insurance were
nontaxable, but conditional on insurance being made
available to all employees irrespective of any preexisting medical conditions
•
•
–
Private insurance companies are reluctant to issue
individual policies to people with serious health problems
Employer-provided insurance market is lucrative without
as much risk
Employer-provided insurance is cheaper for employees
than private insurance, which would be purchased with
income that had already been taxed
1313
The Problem of Adverse Selection
•
Insurance tends to be purchased disproportionally
by those who are most costly for companies to
insure
As a result insurance premiums are raised and a
downward spiral ensues resulting in unaffordable
health care
•
•
Employer-provided insurance kept adverse
selection at bay, but it is now beginning to unravel
–
–
Medical costs have risen
Insurance premiums taking more out of worker’s
paycheck and heightened competition; some
companies are offering higher wages instead of
health care coverage
1314
The Affordable Care Act of 2010
•
Three main provisions
–
–
–
Nondiscrimination on the basis of preexisting
conditions
A mandate that all individuals would need to buy
health care coverage
Subsidies to low-income families
1315
Price Incentives and the
Environment
•
•
Goods with negative externalities tend to be
overproduced
Social objective is to reduce pollution by half
from its unregulated level
–
The most efficient solution is one where the
marginal cost of pollution abatement is the same
for all polluters
•
–
Cost data are not available to government
One solution is to have all reduce pollution by the
same proportion
•
Uneven distribution of costs
1316
Price Incentives and the
Environment
•
One policy option is to tax pollution
–
•
Businesses decide how much pollution to
produce
2 firms, 5 production processes each
–
Production differs by cost and amount of pollution
Cost of Production and Amount of Smoke Emitted
Process
(smoke)
A
(4 T/day)
B
(3 T / day)
C
(2 T/day)
D
(1 T/day)
E
(0 T/day)
Sludge Oil
($/day)
$100
$200
$600
$1,300
$2,300
NW Lumber
($/day)
$300
$320
$380
$480
$700
T = ton
1317
Price Incentives and the
Environment
•
If there are no regulations, each firm produces
at its lowest cost, production method A
–
•
Each firm produces 4 tons of smoke per day
Government wants to cut pollution by half
–
–
Option 1: Set maximum pollution limits
Option 2: Tax smoke at a rate of $T per ton
•
•
Determine T to reduce pollution by half
Each option has costs to society that must be
considered
1318
Reducing Pollution by
Regulation
•
Each firm moves to production process C
–
Costs increase $500/day for Sludge and $80/day
for NW Lumber
•
Total cost to society of this plan is $580/day
Cost of Production and Amount of Smoke Emitted
Process
(smoke)
A
(4 T/day)
B
(3 T / day)
C
(2 T/day)
D
(1 T/day)
E
(0 T/day)
Sludge Oil
($/day)
$100
$200
$600
$1,300
$2,300
NW Lumber
($/day)
$300
$320
$380
$480
$700
1319
Taxing Pollution
•
•
•
If tax is $T per ton, the firms will reduce
pollution as long as the cost of reductions is
less than $T
A tax of $101 moves Sludge to B and NW
Lumber to D
Total cost is $100 for Sludge + $180 for NW =
$280/day
–
Net savings of $300/day over regulation
Process
(smoke)
A
(4 T/day)
B
(3 T / day)
C
(2 T/day)
D
(1 T/day)
E
(0 T/day)
Sludge Oil
($/day)
$100
$200
$600
$1,300
$2,300
NW Lumber
($/day)
$300
$320
$380
$480
$700
1320
Price Incentives and the
Environment
•
Taxing pollution concentrates pollution reduction
in firms that can accomplish it at the least cost
–
–
•
Cost – Benefit Principle
Cost of the last ton of smoke removed is the same
for all firms
It can be difficult to determine the optimal tax
rate
–
–
Set the tax too high and you get too little reduction
Set the tax too low and you get too much reduction
•
Marginal cost exceeds marginal benefit to society
1321
Auctioning Pollution Permits
•
Set a target level for total pollution allowed
–
•
Auction 4 permits to allow 4 tons/day
Determine price of a permit, who buys them,
and the total cost of pollution reductions
Cost of Production and Amount of Smoke Emitted
Process
(smoke)
A
(4 T/day)
B
(3 T / day)
C
(2 T/day)
D
(1 T/day)
E
(0 T/day)
Sludge Oil
($/day)
$100
$200
$600
$1,300
$2,300
NW Lumber
($/day)
$300
$320
$380
$480
$700
1322
Auctioning Pollution Permits
Cost of Production and Amount of Smoke Emitted
Process
(smoke)
A
(4 T/day)
B
(3 T / day)
C
(2 T/day)
D
(1 T/day)
E
(0 T/day)
Sludge Oil
($/day)
$100
$200
$600
$1,300
$2,300
NW Lumber
($/day)
$300
$320
$380
$480
$700
Benefit of Permits
# permits
1
2
3
4
Sludge Oil
($/day)
$1,000
$700
$400
$100
$220
$100
$60
$20
NW Lumber
($/day)
1323
Auctioning Pollution Permits
•
At a price of $90, 6 permits are demanded
–
•
•
•
4 for Sludge and 2 for NW Lumber
At a price of $100, 5 permits are demanded
At a price of $101, 4 permits are demanded
Sludge uses process B and NW uses process
D
# permits
1
2
3
4
Sludge Oil
($/day)
$1,000
$700
$400
$100
$220
$100
$60
$20
NW Lumber
($/day)
1324
Advantages of the Auction
•
Utilizes low cost pollution control
–
–
•
•
Permit fees can offset other taxes
Total cost same as with tax; administratively simple
Predictable operating and investing environment
Citizens can lobby government to set target
pollution
Cost of Production and Amount of Smoke Emitted
Process
(smoke)
A
(4 T/day)
B
(3 T / day)
C
(2 T/day)
D
(1 T/day)
E
(0 T/day)
Sludge Oil
($/day)
$100
$200
$600
$1,300
$2,300
NW Lumber
($/day)
$300
$320
$380
$480
$700
1325