The assessment of share investments portfolio theory and the return on risk-adjusted capital
Bạn đang xem bản rút gọn của tài liệu. Xem và tải ngay bản đầy đủ của tài liệu tại đây (17.05 MB, 9 trang )
RESEARCHES & DISCUSSIONS
In this article the main features of portfolio theory will be outlined and illustrated by
a simple numerical example. For purposes of clarity a few assumptions will be adopted.
This is fol-lowed by the deduction of simple share investment strategies. Then it will be
shown that, with the help of Return on Risk adjusted Capital (RoRaC), an improved evaluation of equity portfolios and investment strategies are more possible then with the
Sharpe Ratio. This will be illustrated by an example. Finally, by means of the RoRaC,
general recommendations for the handling of investments in Vietnam will be derived. In
doing so, the insights derived from the portfolio theory for shares can also be applied to
real investments in Vietnam.
Keywords: Beta Factor, Component Value at Risk, Correlation Coefficient, Expected Return, Inefficient, Investment Strategies, Portfolio Theory, Return on Risk-adjusted Capital, Risk-averse, Risk-taking, Sharpe Ratio, Transformation Curves, Value at Risk, Vietnam Portfolio, Volatility
1. Basics of the portfolio theory
For a demonstration of the portfolio theory we
shall assume an investment of only two Ger-man
shares, those of the automobile manufacturer
BMW and of MAN, the commercial vehicle manufacturer. The insights from the portfolio theory for
these two shares can be assigned to any number
of different shares. But, due to the necessary matrices, the calculation effort will be increased considerably and the deductions will no longer be
quite so clear and easy to comprehend. This would
not be helpful for the aims of this article [for details on the following remarks see Elton et al.,
2002].
Historical share prices constitute the basic
principles of the portfolio theory. First, the corresponding share return is calculated from the historical share price rt:
Thus the return is rt and the price is kt for
the point in time t. From the historical share returns the average share return r can now be calculated:
* Berlin School of Economics and Law
Where T is the number of historical share price
returns. On the basis of the average share price
return r, the accompanying empirical variance s2
can now be calculated:
In the portfolio theory volatility is computed
instead of the variance. Volatility s is the square
root of the variance. Finally, the empirical covariance s1,2 between the two price returns share 1
and share 2 is needed:
With the help of the covariance the accompanying correlation coefficient k1,2 is calculated as
follows:
Compared to the covariance the correlation coefficient can be interpreted more easily and better. Details of this will be handled later in this
article.
At the heart of the portfolio theory are the socalled transformation curves. These transfor-ma-
Economic Development Review - April 2011
9
RESEARCHES & DISCUSSIONS
tion curves specify the accompanying returns–risk
combination for every possible portfolio combination of the two shares 1 and 2. The returns are
measured by the average share return, the risk by
the volatility. The combination possibilities range
from 100% in share 1 and 0% in share 2 to 50%
in both shares 1 and 2, to 100% in share 2 and 0%
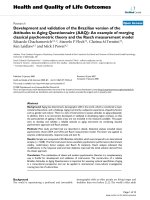
in share 1. In Figure 1 the accompanying transformation curves are delineated for three different
correlation coefficients. In the process, the data
from BMW and MAN are drawn upon, which is
the aggregated portfolio level additional information and calculations are necessary.
It is assumed that an investor has purchased
10 BMW shares at a price of €37.00 and 10 MAN
shares at €45.00. The portfolio weight for BMW
amounts to 45.12 and 54.88% for MAN. Its portfolio value comes to €820 (100%).
The average daily share price returns for BMW
amount to: rBMW = 0.042% and rMAN = 0.175% for
MAN. The calculation of the portfolio return is as
follows:
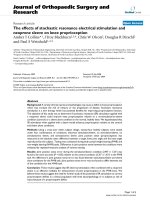
Figure 1: Basic principles of portfolio theory – transformation curves
why we turn next to the explanation for the examples of the BMW and MAN shares.
2. Example of the portfolio theory
For the calculation of the ratios the daily historical share prices from 2005 (257 trading days)
for BMW and MAN were taken as the basis. In
order to be able to specify the essential values of
10
Economic Development Review - April 2011
Here wi is the weight of share i in the whole
portfolio while ri is the accompanying return for
share i. The sum of all of the weights must always
be 1. The result for the BMW-MAN portfolio is rp
= 0.115%.
RESEARCHES & DISCUSSIONS
The volatilities s of the individual shares
amount to sBMW = 1.031% and sMAN = 1.386%. The
portfolio volatility is calculated as:
The
correlation coefficient amounts to
kBMW,MAN = +0.36. For the BMW-MAN portfolio
the yield is sp = 1.025%.
Table 1 shows the resulting key figures for
2005.
Asset
Risk
Portfolio
position exposure weights
Average
share
Volatility
return
BMW
€370.00
45.12%
0.04%
1.03%
MAN
€450.00
54.88%
0.18%
1.39%
Portfolio
€820.00
100.00%
0.11%
1.03%
Table 1: Key figures for BMW and MAN shares for
2005 on the basis of daily trade data.
In Figure 1 the average share returns and
volatility are clearly visible in the transformation
curve. The above formulas can be used to calculate
the accompanying returns and volatility for every
other combination.
Now the transformation curves in Figure 1 can
be interpreted. The blue transformation curve begins in the top right for the portfolio that consists
of 100% MAN shares. Portfolio returns and
volatility reflect the individual MAN share. Analogous to this, the other end of the dashed curve
of transformation reflects the portfolio consisting
only of BMW shares (see Figure 1 and Table 1).
Finally, the portfolio values of the above portfolio
example (45.12% BMW and 54.88% MAN shares)
are shown in Figure 1.
From Figure 1 it is also clear that there is a
portfolio combination in which the portfolio volatility is minimal. This portfolio can be calculated
as follows:
The empirical covariance amounts to sBMW,MAN
= 0.00005159. The accompanying portfolio proportion of the BMW shares amounts to wmvBMW =
71.98% while the accompanying minimal portfolio
volatility is smvp = 0.954%.
The transformation curve exhibits another es-
sential quality. For transformation curves with a
correlation coefficient smaller than one, there is
a so-called inefficient area of portfolio combinations. A portfolio is inefficient when there is another portfolio combination that has higher
returns for the same risk. For the dashed curve of
transformation in Figure 1 (kBMW,MAN = +0.36) the
inefficient area extends from the portfolio with the
minimal volatility (wmvBMW = 71.98%, see above)
to a portfolio which consists only of BMW shares
(wBMW = 100%). By selling BMW shares and purchasing MAN shares (restructuring), a portfolio
manager who manages a portfolio of 80% BMW
shares and 20% MAN shares could package a new
portfolio that would have the same portfolio risk
(portfolio volatility) but a higher portfolio return
than the original portfolio.
Next, with the help of these important features
of the transformation curves, a few simple investment strategies can be deduced.
3. Derivative of simple investment strategies
The first general purpose strategy can be derived directly from the above-mentioned inefficiency and is “Inefficiency portfolios are to be
avoided.”
But in this context the transformation costs
that are accrued by the restructuring of an inefficient portfolio need to be considered. A restructuring only makes sense when the necessary
transaction costs are not higher than the achieved
advantage in profit.
For a risk-averse investor the strategy is:
“Choose the portfolio combination with the minimal portfolio volatility!”
For the example in Figure 1 with correlation
coefficients of k = + 0.36 this would mean se-lecting the portfolio with the minimal volatility, i.e.
wmvBMW = 71.98% and with smvp = 0.954%. With a
(assumed theoretically) correlation coefficient of k
= +1 (black transformation curves in Figure 1) this
means investing completely in the portfolio which
consists of the share with the least risk (volatility). In the above example the investor would
therefore only keep BMW shares (i.e. wBMW =
100%).
For a risk-taking investor the strategy is
“Choose the portfolio which consists only of a
share with the highest individual returns.”
For every theoretical correlation coefficient the
Economic Development Review - April 2011
11
RESEARCHES & DISCUSSIONS
investor would therefore purchase MAN shares
(wMAN = 100%) exclusively. He would achieve the
highest portfolio returns (rMAN = rP = 0.175%). At
the same time the portfolio risk would also be the
highest (sMAN = sP = 1.386%).
Now it is obvious that an extreme risk-averse
or extreme risk-taking investor would be the exception. The question of which portfolio an investor who is willing to take an average amount
of risk (between extreme risk-aversion and extreme risk-taking) should choose, is much more interesting. The answer to this question cannot be
derived directly from the transformation curves.
This is because the risks increase along with
higher returns. So the application of additional
key figures is now necessary in order to derive appropriate strategies.
4. The Return of Risk-Adjusted Capital (RoRaC)
For the evaluation of share portfolios and individual positions with respect to returns and risks,
the Sharpe Ratio is often applied in connection
with the portfolio theory. For the share position i,
the Sharpe Ratio (SRi) is defined as follows:
Here rrf is the risk-free interest rate. An investor who does not invest his capital in investments fraught with risk can invest the capital in
risk-free bonds, e.g. German government bonds
[see Wolke (2011a)]. The risk-free interest rate reflects opportunity costs that arise from an investment fraught with risks. These must be deducted
from the returns (here: ri) fraught with risks.
If a risk-free interest rate of 3% p.a. is assumed
[see Wolke (2011a)], one must consider that the
most influential factors of the Sharpe Ratio all
refer to the same period of time. Returns and risk
in the above example represent daily trade data.
This is the reason why risk-free interest must be
spread across 256 trading days (3% / 256 days =
0.01172%). Now the portfolio example of the accompanying Sharpe Ratios (Table 2) can be calculated:
The investment in MAN shares is therefore
much more attractive than an investment in BMW
shares as the Sharpe Ratio is about three times
as high. In other words: With MAN shares at the
same level of risk, an investor achieves a return
12
Economic Development Review - April 2011
Table 2: Sharpe Ratios for BMW and MAN shares for
2005 on the basis of daily trade data.
Asset
position
Risk-free Average
Volatility
share
interest
(si)
rate (rrf) return (ri)
Sharpe
Ratio
(SRi)
BMW
0.01172%
0.042%
1.031%
0.02937
MAN
0.01172%
0.175%
1.386%
0.11781
Portfolio
0.01172%
0.115%
1.025%
0.10076
that is three times higher. Or, in other words: he
achieves the same profit with one third of the
risk.
However, the Sharpe Ratio reflects a few grave
weaknesses [for details see Wolke, 2008].
- The return consists of average price returns
only. Other possible profit components, in particular dividend payments, are disregarded.
- Among other things the risk attitude of the
investor is not explicitly considered.
- The consideration of the diversification effect
emerges only on the portfolio level. Partial consideration of the diversification effect on the level
of individual share positions is not undertaken.
- Finally, the Sharpe Ratio refers to relative
(percentage) factors of influence. But this does not
however mean that there is a connection to a necessary equity capital burden of the investors (for
his investment fraught with risks).
These weaknesses of the Sharpe Ratio were
the reason why a ratio was developed in the 1990s
which more or less corrects these weaknesses.
This involves the so-called Return on Risk-Adjusted Capital (RoRaC). The RoRaC can be defined
as follows:
Average price return + other income – risk-free interest payments
Component Value at Risk
In contrast to the Sharpe Ratio, all of the influencing variables of the RoRaC are expressed in
currencies (e.g. €). The average gain in capital in
the example of an average daily investment return
corresponds with ri. The average price return can
however apply to profits of bonds and other securities. The other earnings are e.g. dividend payments or coupon interest payments. As in the
above example, the risk-free interest payments
are 3% p.a., but they will have to be converted into
currencies. The numerator of the RoRaC only differs from the Sharpe Ratio by consideration of
RESEARCHES & DISCUSSIONS
other earnings instead of merely the average price
returns and the currency data. The decisive difference is in the application of the Component Value
at Risk (CoVaR) instead of volatility. In this way
the RoRaC becomes much more significant than
the Sharpe Ratio. For this reason the Component
Value at Risk is explained in greater detail below
[for specific details of the CoVaR see Jorion, 2007
and Wolke, 2008].
The basis of the Component Value at Risk
stems from the Value at Risk (VaR) for the position i, which is calculated as follows [for an outline
see also Wolke (2011b), for greater detail see also
Jorion (2007) and Wolke (2008)]:
with:
RPi: amount of risk position of i in euro,
a: number of standard deviations (from the
standard normal quantile),
si:
volatility of i,
T:
liquidation period in days,
average return (expected value).
ri:
For the liquidation period of one trading day
and a level of confidence of 99%, which is the
equivalent of 2.33 standard deviations, the following VaR for the sample portfolio would result in:
The VaR for e.g. BMW can be interpreted as
follows: With a probability of 99% the expected
loss in BMW shares from one trading day to the
next would not be greater than €8.73.
The investor’s risk propensity is reflected in
the confidence level. A risk-averse investor selects a high level of confidence (e.g. 99%) and a
risk-taking investor chooses a lower level (e.g.
95%). The higher the level of confidence, the
higher the VaR will be.
If the VaR of the individual positions (€8.73 +
€13.74 = €22.47) is added together, and if the VaR
of the portfolio is then deducted, the outcome is a
value of €3.83. This value quantifies the diversification effect. Now the diversification effect can be
quantified on the portfolio level, albeit not the proportionate diversification effect for the individual
risk positions BMW and MAN. The individual positions also cannot really be compared with each
other. With the help of the Component Value at
Risk this diversification effect can be determined,
which is calculated for the risk position i as follows:
with
The value si,p is the covariance between the
daily return of position i and the daily return of
the portfolio. The beta factor (bi) measures the influence of the individual risk positions and the entire portfolio risk. The higher the beta factor, the
higher the influence will also be on the portfolio
risk. This aspect will play an important role later.
The beta factors for BMW and MAN are
With the help of these beta factors the accompanying CoVaR can now be calculated:
The sum of the CoVaR must yield the VaR of
the portfolio exactly. The proportionate diversification effect is then €8.73 - €6.11 = €2.62 for BMW
and €13.74 - €12.53 = €1.21 for MAN. The proportionate diversification effect of the MAN shares is
much lower than those of BMW shares. This may
be a surprise initially, since the influence of the
MAN shares on the portfolio risk is clearly higher
(higher beta factor). However, if we look at the formula for the CoVaR more carefully, it becomes
clear that a higher beta factor and a high portfolio
weight will bring about a higher CoVaR. A higher
CoVaR means that the diversification effect will
be lower proportionately (as the difference between the VaR of the individual positions and the
CoVaR will be less)! In addition, the beta factor
also has another important feature. A higher beta
factor means that the portfolio risk will be reduced
dramatically if the accompanying share position
is sold. So if the portfolio risk is too high, the portfolio VaR can be lowered considerably when the
MAN shares are disposed. Both of these features
Economic Development Review - April 2011
13
RESEARCHES & DISCUSSIONS
play a role when ap-plied to real investments in
Vietnam.
Now the four weaknesses of the Sharpe Ratio
mentioned above (taking into account dividend
payments, proportionate diversification effect, risk
propensity of the investor, risk measurement in
currencies through VaR) have been solved.
Next, with the help of the RoRaC or CoVaR,
strategies for our portfolio example can be drawn.
5. RoRaC Example for the BMW-MAN Portfolio
MAN: €192.61 / €200.48 = 0.96
Portfolio: (€36.08+€192.61) / €298.24 = 0.767
For the deduction of possible investment
strategies it now makes sense to illustrate the various portfolio weights in the tables that follow. In
Table 3 the individual VaR, the Component Value
at Risk and the accompanying RoRaC values for
BMW and MAN are shown. In Table 4 the VaR
and RoRaC values are shown for the portfolio.
With the help of the results from Table 3 and
To begin with, in taking
Weight BMW = CoVaR
Single
CoVaR
Single
RoRaC
RoRaC
dividend payments into ac- 1-Weight MAN BMW VaR BMW MAN VaR MAN BMW
MAN
count, assumptions about
0.00%
€0.00
€0.00
€25.05
€25.05
n. d.
0.876
the estimated amount of
10.00%
€0.80
€1.94
€22.49
€22.54
0.624
0.878
distributions can be made.
In this way the annual div20.00%
€1.89
€3.87
€19.80
€20.04
0.53
0.886
idend payment will amount
30.00%
€3.30
€5.81
€16.99
€17.53
0.454
0.904
to 2% p. a. for BMW and
40.00%
€5.07
€7.74
€14.06
€15.03
0.395
0.936
1% for MAN with respect
€13.75
€6.11
€8.73
€12.53
0.96
0.369
45.12%
to the risk position. The
50.00%
€7.18
€9.68
€11.08
€12.52
0.348
0.99
risk-free interest rate will
again be 3% p.a. For the
60.00%
€9.57
€11.61
€8.15
€10.02
0.313
1.077
final calculation of the
70.00%
€12.13
€13.55
€5.42
€7.51
0.288
1.213
RoRaC all amounts will
80.00%
€14.71
€15.48
€3.07
€5.01
0.272
1.427
have to be converted in cur90.00%
€17.15
€17.42
€1.24
€2.50
0.262
1.768
rencies and be fixed within
a specific timeframe. The
100.00%
€19.35
€19.35
€0.00
€0.00
0.258
n. d.
time frame of one year has Table 3: Component Value at Risk and the accompanying RoRaC values for
been chosen for this examBMW and MAN
ple (the timeframe selected
Total portfowill be insignificant for the RoRaC
Weight BMW =
Portfolio Portfolio
RoRaC
lio profit p.
result). The following total p.a. earn1-Weight MAN
volatility
VaR
Portfolio
y.
ings for BMW and MAN are:
0.00%
€350.96
1.39%
€25.05
0.876
BMW: 0.042%.€370.256 days
10.00%
€323.86
1.29%
€23.29
0.869
(price return) + 2%.€370 (dividend) –
20.00%
€296.76
1.20%
€21.69
0.855
3%.€370 = €36.08
30.00%
€269.66
1.12%
€20.29
0.831
MAN: 0.175%.€450.256 days
(price return) + 1%.€450 (dividend) –
40.00%
€242.56
1.05%
€19.13
0.793
3%.€450 = €192.61
€228.69
1.03%
€18.64
0.767
45.12%
Finally, the Component Value at
50.00%
€215.46
1.00%
€18.26
0.738
Risk needs to be calculated for a full
60.00%
€188.36
0.97%
€17.72
0.664
year:
The result is now reflected in the
following RoRaC values:
BMW: €36.08 / €97.76 = 0.369
14
70.00%
€161.26
0.95%
€17.56
0.574
80.00%
€134.17
0.96%
€17.79
0.471
90.00%
€107.07
0.99%
€18.39
0.364
100.00%
€79.97
1.03%
€19.35
0.258
Table 4: VaR, and RoRaC for different portfolio weights for
Economic Development Review - April 2011
the entire portfolio
RESEARCHES & DISCUSSIONS
4, a few mechanisms can now be observed. From
Table 3 it becomes apparent that the proportionate diversification effect for BMW shares is much
higher than for the MAN shares. This is due to
the respective weighting in the portfolio and the
beta factor. Only with a very high number of
BMW shares in the portfolio (above 70%) will the
diversification effect of the MAN shares – depending on the amount - be greater (and analogous
with high numbers of MAN shares).
From Table 3 a much more significant feature
can be deduced from the RoRaC values. In this
way the RoRaC values sink with increasing
weighting in the portfolio. This is based on a decreasing proportionate diversification effect. The
lower the proportionate diversification ef-fect, the
higher the CoVaR is, which means that the
RoRaC will decrease. Due to the above average
gain compared to the risk, the RoRaC of the MAN
shares will be higher than that of the BMW
shares. This could lead to the assumption that it
only makes sense to buy MAN shares. But this
would mean neglecting the respective risk of MAN
shares and the lower (or no) diversification effect
associated with them. So, in the next step the risk
can be taken into account at the portfolio level.
The RoRaC of the portfolio always lies between
the two RoRaC values of the individual positions
(a weighted average). The RoRaC is the highest
for 100% MAN shares and the lowest for 100%
BMW shares. This is due to the above average
gains of the MAN shares.
For amounts of more than 70% BMW shares
the portfolio is inefficient, i.e. the portfolio volatility begins to increase again, while the portfolio
returns decline (due to the high weighting of the
BMW shares).
Next, the question is which weighting an investor should choose between 0% and 70%.
This question can be answered according to: (1)
the risk propensity of the investor; and (2) the
amount of available equity capital.
A risk-taking investor who can finance the
portfolio with much more than €25 equity capital
should invest in 100% MAN shares, although in
doing so he will not realize a diversification effect
(see above discussion).
A risk-taking investor with less than €25 equity capital should only invest in the number of
MAN shares that maintains the portfolio VaR
which is lower than his/her equity. If the investor only has €19 in equity capital, he should not
have more than 50 MAN shares.
A risk-averse investor should choose a portfolio
with a minimal amount of volatility (71.98% BMW
shares, see above). Depending on his risk disposition, if he has much more than €18 in equity capital, he can invest in a portfolio with less than
70% BMW shares to achieve a higher RoRaC.
For the application of the portfolio theory and
the RoRaC in real investments in Vietnam, it
should be kept in mind that the amount of equity
capital is much lower than the portfolio VaR. In
this case there are two possibilities: (1) An increase in equity capital, or (2) A reduction of the
portfolio VaR.
An increase in equity capital is usually not immediately feasible and has something to do with
aspects that are not within the scope of this article. What is left is the reduction of the portfolio
VaR. Here again, the beta factor comes into play.
If the portfolio VaR should be reduced as much as
possible, this can be achieved by the sale of shares
with a high beta factor. In our example this would
mean the sale of MAN shares and the investment
of this return of sale in risk-free or almost riskfree investments.
Next, the previous explanations can be applied
to real investments in Vietnam.
6. Applications and implications for real investments in Vietnam
For the previously mentioned deductions, it
will be necessary to make a number of assumptions which are not achieved in real investments.
Here are the most important assumptions as follows:
- The calculation of covariances, returns and
volatilities by means of historical data,
- The permanence of returns and volatilities,
or the restructuring of portfolios,
- The realization of random portfolio weights,
etc.
Nevertheless, in order to derive recommendations for real investments, returns, beta factors,
Value at Risk values and correlations must all be
estimated from plausible assumptions or comparable investments.
The first key assumption concerns the risk
Economic Development Review - April 2011
15
RESEARCHES & DISCUSSIONS
propensity of the investors. For the most part investments in Vietnam can be undertaken by:
- Foreign private investors (firms, investment
companies),
- Vietnamese private investors (firms, individuals) and
- The Vietnamese government (state institutions).
The deduction or assumption in terms of a consistent risk attitude of all three investor types is
not possible. The conditions under which the various investors evaluate their possible real investments are much too different to find a common
denominator amongst them. Another possible approach consists of forming or analysing portfolios
of real investments on different aggregation levels. In this way one can try to apply the portfolio
theory on the company level. The different products and business areas of a firm are considered
as investments that, all together, make up the
portfolio of the company. The equity capital of the
company then forms the ceiling for the portfolio
VaR of the company. But this does not solve the
problem of de-ducing assumptions about risk attitudes. This is only possible at the highest aggregation level.
If one looks at the portfolio at the highest aggregation level, this is the portfolio of the entire
Vietnamese economy. This is an overview of all
real investments of the entire Vietnamese state.
Various fields (tourism, real estate, services, industrial production, and agriculture, etc.) reflect
the individual positions of the “Vietnam Portfolio”.
If one now looks at the develop-mental risks of the
Vietnamese economy, as for example: (1) a possible bursting of the real-estate bubble; (2) a substantial sinking of US$ reserves (currently only
US$14 billion) of the Vietnamese state bank; (3)
a high import dependency and accompanying high
trade deficit; and (4) a flat value chain, there can
be in my opinion only one recommendation: for
current and future real investments in Vietnam,
risks should be avoided at all costs! In other words
investors should follow a risk-averse attitude with
respect to Vietnam portfolios [for details on the
risks and problems of the entire Vietnamese economic see Herr/Stachuletz, 2010].
With the help of portfolio theory, beta factors
and the RoRaC, a few basic recommendations can
now be made.
16
Economic Development Review - April 2011
In Figure 1 it has become clear that a high risk
reduction is possible when the correlations between the individual positions are very negative
where possible. A highly diversified Vietnam portfolio should also be aimed for. In Figure 1 it has
also become apparent that with a correlation coefficient of -1, the portfolio return will be about as
high as in risk-averse portfolios with much higher
correlation coefficients (e.g. for k=+0.36, see Fig
1). A stronger diversification therefore does not
add up to significant losses with respect to returns.
A stronger diversification in Vietnam can, for
example, be achieved by means of more investments in highly developed technological production sites. In this way and at the same time, a
deeper value chain can be developed. An excellent
example for this is the investment of
“Pepperle&Fuchs” in HCMC. Pepperle&Fuchs is a
German company for ultrasound and laser metrology. With its high-tech products, this company
plays a leading role in the world. With the construction of a production site in Vietnam, a stateof-the-art technology is carried to Vietnam and at
the same time it creates highly-skilled jobs. There
is also the advantage that this branch can be correlated negatively with other heavy weights of the
Vietnamese portfolio. Since the proportion of this
type of investment in the portfolio is probably still
small, the proportionate diversification effect (see
Table 3 above) will be very high. This means that
for this type of investment a higher RoRaC can be
achieved. However, it will probably be quite difficult in the medium term to carry substantial stateof-the-art technology from foreign companies to
Vietnam. This is why several additional recommendations are needed.
If one looks at the current developments in the
Vietnam portfolio, two main streams are striking:
The tourism field and the real-estate sector. Both
sectors have, to a certain extent, a strong positive
correlation to each other (due to real-estate in
tourism) and reflect high levels of growth. One example for this can be seen in the touristic developments in Nha Trang and the construction of
numerous new commercial high-rise buildings in
HCMC. Both fields promise high returns in future,
albeit significant risks as well. The real-estate
bubble could burst, which would bring about a considerable destruction of wealth and far-reaching
RESEARCHES & DISCUSSIONS
consequences for Vietnam. But tourism also has
significant risks (e.g. environmental pollution,
changing preferences of tourists, and new trends
in tourism, etc.). All of this leads to the legitimate
assumption that both sectors have a high beta factor and therefore a strong influence on the level
of risk in the whole portfolio. At the same time
the two fields only have a low diversification effect, which is also a disadvantage (lower RoRaC,
see the previous explanations).
What will happen if the real-estate bubble
bursts can currently be seen very clearly in the example of Spain. Consequences include a steep increase in unemployment and public debt as well
as a massive destruction of wealth. The consequences for Spanish tourism are substantial. No
tourist wants to stay in unoccupied housing estates
and the capital for operating tourist facilities has
been reduced significantly, or totally destroyed.
Similar developments with almost identical structures (numerous large villas with golf courses and
luxury hotels) as in Spain have unfortunately already been observed in Vietnam. One example for
this is “Sealinkscity“ in Phan Thieát. I sincerely
hope that the real-estate bubble in Vietnam will
not burst, as in contrast with Spain, Vietnam has
no European Union to help out in times of crisis.
So, what can be recommended?
The portfolio risk of Vietnam can be lowered
quickest in the positions that exhibit the highest
beta factor and a high portfolio proportion, i.e. the
tourism and real-estate branches. Although probably impossible, a more cautious development, accompanied by a few precautionary measures, could
help. In foreign investments great care should be
taken in both fields to determine whether foreign
investors have sufficient equity base. In times of
crisis, only when an investor possesses ample equity capital, which clearly exceeds that of the
Value at Risk of the investment or the portfolio,
can the far-reaching negative consequences for the
whole country be held in check. Investments of
foreign investors with an equity base of less than
5% should be avoided.
For the development in tourism I recommend
following a cautious development which is linked
first and foremost to the natural resources of this
country, i.e. no luxury hotels or golf courses. One
possible perspective would be to foster and develop a sustainable eco-tourism in Vietnam. These
measures could lead to the lowering of both fields
in Vietnam’s portfolio, which would allow the diversification effect to increase (see above).
If at the same time it were possible to attract
foreign state-of-the-art technology (especially, for
example, in renewable power generation, e.g. wind
power generation), a well-diversified Vietnam
portfolio that would yield satisfactory portfolio returns could be put in place. It is of course clear to
me that these recommendations presuppose quite
a number of assumptions which for the moment
are not very realistic for Vietnam. However, I see
no reason why the potential risk in Vietnam cannot be limited in the medium-to-long term, so that
a well-diversified Vietnam portfolio will be able to
achieve positive development and prosperity in
Vietnamn
References
1. Elton, Edwin J. et al. (2002), Modern Portfolio Theory and Investment Analysis, Wiley.
2. Herr, Hansjörg & R. Stachuletz (2010), Vietnam am
Scheideweg – Analysen einer Ökonomie auf dem Drahtseil, German, Friedrich Ebert Stiftung, Internationale Entwicklungszusammenarbeit, Referat Asien und Pazifik,
Dezember 2010
3. Jorion, Philippe (2007), Value at Risk – The New
Benchmark for Managing Financial Risk, 3rd Edition, McGraw-Hill.
4. Wolke, Thomas (2008), Risikomanagement, 2nd
Edition, German, Oldenbourg, München, Wien.
5. Wolke, Thomas (2011a), “The Functioning of Government Bonds - The Example of Greece and Vietnam”,
Economic Development Review, Vietnam, HCMC, January, 2011
6. Wolke, Thomas (2011b), “Towards a Better Understanding of the Current Financial Crisis: The Problems of
Measuring Credit Default Risk and the Corresponding
Equity Requirements for Banks”, Economic Development
Review, Vietnam, HCMC, February, 2011
Economic Development Review - April 2011
17