Adapting a measure of socially responsible consumption in France to the Vietnamese context: A Study in Ho Chi Minh city
Bạn đang xem bản rút gọn của tài liệu. Xem và tải ngay bản đầy đủ của tài liệu tại đây (122.2 KB, 11 trang )
VNU Journal of Science: Economics and Business, Vol. 32, No. 2 (2016) 58-68
Adapting a Measure of Socially Responsible Consumption
in France to the Vietnamese Context
A Study in Ho Chi Minh City
Le Thi Thanh Xuan*, Lai Van Tai
School of Industrial Management, Hochiminh City University of Technology (VNU),
B10 Building, 268 Ly Thuong Kiet St. Dist. 10 Hochiminh City
Abstract
The major aim of this study is to employ the measure of socially responsible consumption (SRC) developed
by Francois-Lecompte and Roberts (2006) to empirically explore the level of Vietnamese consumers’ awareness
of SRC. Consumers in Ho Chi Minh City were approached in order to distribute questionnaires in stores,
supermarkets, shopping malls, traditional markets, etc. Data gathered from the survey was processed by SPSS 21
software. In analysis of the data, exploratory factor analysis technique is applied to explore the correlations of
variables and factors formation. Principle component analysis with the Promax rotation method is used in this
process. Reliability of measurement scales presented in each factor is tested by Cronbach’s Alpha. And,
ANOVA analysis is also applied to test the differences of SRC behaviors between customers of demographic
profiles. Research findings have shown some salient points. Firstly, the order of SRC factors in Vietnamese
consumers’ perspectives is different from that in France. Secondly, 17 of 20 variables to measure SRC factors
can be used to conduct a SRC study in Vietnam. However, it is necessary to conduct a qualitative study to
develop a measure more appropriate to Vietnamese consumers.
Received 24 March 2016, revised 9 June 2016, accepted 28 June 2016
Keywords: Socially responsible consumption, ethical consumption, Vietnam.
1. Introduction *
levels of consumption have been increasing
dramatically. According to The Saigon Times,
two third of the GDP in Vietnam is recently
contributed to by individual consumption [1].
Moreover,
individual
consumption
is
considered as the main factor not only to
degrade the environment, but also to
encourage companies to behave in a
responsible manner [2, 3].
There are studies conducted on socially
responsible consumption in some advanced
economies such as France, the U.S., UK, Spain,
and some emerging ones such as India, China,
Morocco [2, 4, 5, 6, 7, 8, 9, 10, 11]. The point
highlighted in these studies is that SRC cannot
With the development of an economy,
especially an emerging economy like Vietnam,
growths of many aspects are increasing
dramatically.
Among
these
aspects,
consumption is one having significant growth.
However, any development also has its own
down side with many problems and concerns,
which, if not paid enough attention, will lead
to many negative consequences. In Vietnam,
accompanying rapid economic development,
_______
*
Corresponding author. E-mail: 84-903393406
E-mail:
58
L.T.T. Xuan, L.V. Tai / VNU Journal of Science: Economics and Business, Vol. 32, No. 2 (2016) 58-68
be enforced by government, but there is need
for consumers to have self-realization and selfregulation to minimize any bad or negative
influence on the society and the environment [2,
10]. In other words, it is a personal project [11].
However,
In
Vietnam,
frequently
mentioned terms are smart consumption and
green purchasing which are used to describe
how to smartly spend money on consumption
and to consider impacts on the environment.
Therefore, the purpose of this study is (1) to
empirically explore the level of socially
responsible concerns among Vietnamese
consumers; (2) to analyze differences of
Vietnamese consumers’ concerns of SRC
across demographic factors; and (3) to
discuss implications for marketers and policy
makers regarding how to improve SRC in
Vietnamese consumers.
2. Research background
2.1. Consumption and socially responsible
consumption (SRC)
Consumption is a marketing concept;
however, it has attracted as well the attention of
many researchers in other fields such as
economics, politics science, sociology and
philosophy [12]. According to Marinas (2001,
2007), consumption is considered as the way
consumers perform to satisfy their needs and
they try to make it a never-ending process [12].
In other words, consumption is described as the
way in which individuals live by using different
types of products and services from different
producers/providers [2, 12]. From their
capabilities and understanding, consumers will
combine these types of products and services in
different ways. However, these combinations
can lead to different consequences as they are
impacted by four factors, namely: price, other
goods’ prices, consumer’s economic capacity,
and a person’s likings [12].
In their study, Lebzar, Sidmou et al. (2012)
summarized different ways to define
59
consumption and identified its components,
which include: the emotional dimension
(consumption is a “source of emotion and
experience of pleasure”), the functional
dimension (consumption utilities meet goals
and practices), the aesthetic dimension
(consumption is sought for “beauty and
expression”),
the
epistemic
dimension
(consumption allows consumers to “satisfy
curiosity, the desire for knowledge”) and
finally, the social dimension (consumption
allows consumers to structure their identify and
position themselves in relation to a group) [7].
However, consumption is also defined in
another way. “Consumption means to consume,
waste, squander or destroy”; or, it is concerned
as an aspect of social representations of the
economy [5, 13]. These considerations of
consumption drove researchers to thinking
about and doing research on SRC [13]. There
are many SRC definitions; however, the very
first one documented by Webster in 1975 is
with two main issues [5, 14]. Firstly, a
consumer’s concern about public consequences
due to his/her consumption. Secondly,
consumers want to make some changes in
society by their purchasing power.
Mohr, Webb et al. (2001) identify socially
responsible consumers by their actions of
avoiding buying products/services from
companies that harm society and actively
seeking out ones from companies that help
society [2]. Similarly, Díaz-méndez (2010)
highlighted that SRC is a buying decision based
on a product’s origin, manufacturing process,
labor working conditions, environmental
impact, and manufacturer’s social responsibility
[12]. Later, Pedrini and Ferri (2014) also
defined SRC as consumers’ considerations of
social and environmental implications related to
their purchasing decisions [10].
Among SRC definitions, the one developed
by Roberts (1995), which is employed and cited
in many other empirical studies [4, 5, 7, 13], can
be considered as the most-used SRC definition. In
his study, Roberts (1995) defines SRC as
consumer behaviors taking into account the
60
L.T.T. Xuan, L.V. Tai / VNU Journal of Science: Economics and Business, Vol. 32, No. 2 (2016) 58-68
impact on the environment of private
consumption decisions or using purchasing power
to express current social concerns [4].
2.2. Factors influencing customers in SRC
First
of
all,
socio-demographic
characteristics have their influences on SRC,
such as age, education, and income; meanwhile
gender does not impact SRC positively [10].
These research findings help managers to segment
their markets, and to better define marketing mix
[9, 10]. Besides the socio-demographic indicators
mentioned above, the factors which have their
influences on consumers in their SRC can be
divided into two groups: drivers and obstacles. In
the literature, some studies explore these factors.
In their study, Mohr, Webb et al. (2001)
point out a contradiction of a common
assumption that SRC is based only on
consumers’ self-interest [2]. Their findings
suggest some important issues relating to
drivers for consumers to consume responsibly.
Firstly, the more knowledge about social
responsibility customers have, the more
positive consumption they have. Moreover,
such knowledge also creates a positive
relationship between customers’ beliefs and
behaviors in SRC. Lastly, customers likely
practice SRC when they recognize their
purchasing power, which can impact companies’
behaviors. From these findings, it can be seen that
drivers to promote consumers consuming
responsibly are started from the way companies
behave and from their purchasing power.
One study conducted in Hong Kong
investigates the term “sustainable consumption”
which can be referred to SRC [15]. In this
study, Lee (2014) proposed and tested 3 factors
driving the behavior of sustainable consumption,
including: parental influences, attitudes towards
sustainable development efforts, and supportive
behaviors for environmental organizations [15].
Similarly, the study of Chia-Ju (2013) also found
a positive relationship between SRC and
environmental concerns [16].
Regarding obstacles preventing socially
responsible consumption, in his study, Carmen
(2008) identified three groups of obstacles
which created a considerable gap between the
attitudes and actual behaviors of customers
[17]. These three groups are: motivational,
cognitive and behavioral obstacles.
Motivational obstacles can be considered
as willingness to make political statements or
actions in the marketplace and depend on selfidentity and perceived efficacy [17]. The first
obstacle is from consumers’ perspectives of
self-perception of citizenship and of corporate
social responsibility (CSR). The main point
mentioned is that, although good people, not
all consumers are good citizens who are
concerned about others’ welfare; and they
have different conceptualized understandings
of CSR. The second obstacle is from their
understanding of their purchasing power and
from sources information they have. Carmen
(2008) found that “… if consumers believe
that their purchase decision may make a
difference, they are more likely to buy
responsibly…” and this is used to express their
expectation of society [17, 18].
Cognitive obstacles are described as
opportunities to get information and ability to
process, store and recall information about
brands [17]. This kind of obstacle refers to the
information consumers have about corporate
impact on social welfare [17, 19]. It also
refers to the availability of this information to
customers [2, 17].
Behavioral obstacles are the likely
opportunity and ability to find a fair brand to
purchase [17]. Actually, according to Shaw and
Clarke (2008), customers can not be responsible
in consuming if they cannot find good
producers/manufacturers [17]. The other
behavioral obstacle is the cost of spending for
responsibly consumption, including higher
prices, travelling a certain distance to find good
manufacturers, and so on.
2.3. Measures of socially responsible consumption
Even though the concept SRC is mentioned
and has been studied since 1975, the measures
of SRC have not been properly developed.
Many scales are borrowed from sociology,
therefore they do not have items related to
consumer behavior and are not well suited in
L.T.T. Xuan, L.V. Tai / VNU Journal of Science: Economics and Business, Vol. 32, No. 2 (2016) 58-68
the marketing and management context [5].
Moreover, Francois-Lecompte and Robert
(2006) also point out that SRC is only put in the
context of the environment [5].
In their study, Mohr, Webb et al. (2001)
conducted a qualitative study to develop items
to measure SRC [2]. Their research findings
suggested 5 items. However, their proposal
needs to be tested quantitatively and sub-items
developed for SRC studies. Among studies
conducted in developing countries, a study
conducted in China by Chen and Kong (2009)
developed and used a scale of 7 items to
measure SRC [6]. However, the process of
developing these items is not described clearly
to illustrate their reliability.
Haws, Winterich et al. (2014) also
developed and tested a scale to measure green
consumption behaviors [20]. This scale aims to
measure consumption behaviors of customers
through their concern about environmental
protection. Even though SRC also includes
issues on the environment, this scale is not
appropriate to study SRC.
In their study conducted in France,
Francois-Lecompte
and
Robert
(2006)
developed a scale of 5 constructs to measure
SRC, including: a firm’s behavior with 5
factors; cause-related products with 4 items;
small businesses with 4 items; geographic
origin with 4 items; and consumption volume
with 3 items [5].
In our study this 20 item-scale of is
developed by qualitative study with methods to
collect data such as in-depth interviews and focus
groups. Then, this measurement is confirmed by a
quantitative study. That is the reason our study
employs the scale developed by FrancoisLecompte and Robert (2006) as a base.
3. Methodology
The main purpose of this study is to
empirically explore the level of socially
responsible concerns among Vietnamese
consumers. Therefore, the main method used to
61
collect data is through a questionnaire used to
conduct a survey among consumers. The
employed questionnaire is adapted from
Francois-Lecompte and Robert (2006). In this
questionnaire, there are five factors with 20
items, namely: firms’ behaviors (consumption
acts related to irresponsible corporate
behaviors) - (BF), cause-related products
(preferences for cause-related products, including
purchase) - (CRP), small businesses (desire to
help small businesses) - (SB), geographic origin
(the purchasing of local products) - (GO) and
consumption
volume
(reducing
one’s
consumption to what is only necessary to not
badly impact the environment - (CV).
The factors and items from the study of
Francois-Lecompte and Roberts (2006) are
adjusted for their appropriateness to the
research and consumption context in Vietnam.
To construct the questionnaire, a group of 6
people of different gender, ages, occupations,
and incomes was gathered together to discuss
the meaning of SRC. At first, it was a free
discussion about the meaning of SRC, to warm
up and learn what people think about SRC.
Then, the scale of Francois-Lecompte and
Roberts (2006) was raised to discuss and clarify
what should be included and adjusted to be
accepted in the case of Vietnam. After
consensus on using these 19 variables (omitting
1 variable relating to political matters), a pilot
survey was conducted with a small sample (20
respondents) to adjust the questions to be more
clear and understandable for Vietnamese
customers. The questionnaire was then finalized
and used for the survey with a large sample in
order to get data for analysis. After adjustment,
there were 5 constructs and 19 items which are
presented as follows:
Factor 1: Firms’ behaviors (FB)
1. I pay attention not to buy products from
companies that are close to illegal.
2. I try not to buy products from companies
that employ children
3. I try not to buy products from companies
that don’t respect their employees
62
L.T.T. Xuan, L.V. Tai / VNU Journal of Science: Economics and Business, Vol. 32, No. 2 (2016) 58-68
4. I try not to buy products from companies
that strongly harm the environment
(In Vietnam, there is only one political
party, therefore, the origin item “I try not to buy
products from companies or shoppers that are
narrowly linked to political parties that I
condemn” in the study of Francois-Lecompte
and Roberts (2006) has been removed from the
questionnaire).
Factor 2: Cause-related products (CRP)
1. I buy some products of which a part of
the price is transferred to a humanitarian cause.
2. I buy some products of which part of the
price goes to developing the country.
3. I buy products of which part of the price
is given to a good cause.
4. I buy fair trade products
Factor 3: Small businesses (SB)
1. I avoid doing all my shopping in big
businesses (large retailers).
2. I buy in small businesses (bakeries,
butcher’s trade, book shoppers) as often as
possible (small shopkeepers).
3. I help the storekeepers of my quarter to
live through my purchases.
4. I go to small markets to support fruit and
vegetable small producers.
Factor 4: Geographic origin (GO)
1. When I have the choice between a
Vietnamese product and an imported product, I
choose the local one.
2. I buy preferably Vietnamese products
(like cosmetics…).
3. I buy fruits and vegetables grown in
Vietnam.
4. I buy products made in my country Vietnam.
Factor 5: Consumption volume (CV)
1. I try to reduce my consumption to what I
really need.
2. In a general manner, I try to reduce my
consumption.
3. I try not to buy objects that I can do by
myself.
Convenience sampling is chosen, and the
participants in this study are consumers who are
over 18. Totally, 258 respondents were
approached to answer the questionnaire at
supermarkets, convenience stores, markets,
book stores and shopping malls. The data is
cleaned and processed by using exploratory
factor analysis (EFA technique) in SPSS
software. Principle component analysis (PCA)
with the Promax rotation method are used to
adapt with the method used in the study of
Francois-Lecompte (2006). In fact, using the
PCA method is a reasonable process to reduce a
number of variables in a data set by using
orthogonal transformation to convert them into
linearly uncorrelated variables; it is especially
suitable with the case of using measurement
scales built by a previous researcher for a
specific case. Before applying the EFA method,
the reliability of the scales has been tested by
using Cronbach’s alpha criteria; it should be at
least 0.6 to be accepted (Nunnanly and
Burnstein, 1994). Then, the EFA technique is
applied with data exploration and variable
reduction steps. The EFA process is accepted
with the threshold of KMO measure higher than
0.5 and Bartllett’s test of Sphericity significant
at 5%, Eigenvalues larger than 1, Factor
loadings of each variable should be at least 0.5
and there is no high cross loading at two or
more factors with two different factor loading
higher than 0.3 (Hair et al., 2006). Besides, the
difference between groups of customers
distinguished by demographic variables are
considered by ANOVA analysis.
4. Data analysis and findings
The percentage of men and women in the
valid sample are 57 and 43, respectively. Most
of the respondents are in the age group of 24-31
(63.6 percent). There are 28 percent for the age
of 18-23 and 9 percent for over 32. The ranges
of age also suit with the occupation status,
including: office staff, managers and engineers,
students, workers and housekeepers at 47, 15,
28 and 10 percent, respectively. The ranges of
L.T.T. Xuan, L.V. Tai / VNU Journal of Science: Economics and Business, Vol. 32, No. 2 (2016) 58-68
respondents’ incomes are relevant to the
occupations with 46 percent of them earning
from 5-10 million VND; more than 35 percent
getting less than 5 million VND; and about 19
percent receiving a salary higher than 10
million VND.
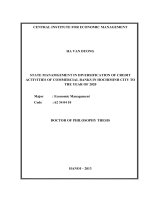
Most of the variables are dispersed in the
Likert 5 scales with the mean and mode from 3
(neutral) to 4 (agree) (Table 1). That means the
customer’s perceptions of SRC described by
these variables are not high, just slightly
agreeing with what is mentioned about socially
responsible consumption, especially for
variables measuring firm behaviors and small
business groups. This could be due to the fact
that the information of Vietnam enterprises is
not transparent and their communication with
customers is not so good. Therefore, consumers
seem to have not thought much about the
responsibility to help small businesses as well
as corporations that have practiced social
responsibility. Furthermore, due to low
incomes, consumers tend to consume lowprice-products or think about the products that
bring most benefits to them, rather than share
with a firm’s difficulties. These might
contribute to form their consumption attitude.
Variables in the CRP group seem to have the
highest concern from customers if they know
that a part of a product’s price will be used for
humanitarian purposes, charity or developing
the country, especially after the call from the
government ‘For Hoang Sa and Truong Sa’ to
contribute to Hoang Sa and Truong Sa, or the
campaign for using Vietnamese products
‘Vietnamese consumes Vietnamese products’.
The variables of GO also express concerns
since the scare relating to some products from
China which may affect negatively their health
and the campaign about boycotting unhealthy
Chinese products that have been emerging in
recent years.
Testing the reliability of the scales, all 5
primary factors receive a Cronbach’s Alpha
from 0.712 (for SB) to 0.876 (for FB),
satisfying the condition mentioned above.
63
Therefore, all of these variables will be used in
the EFA step.
Taking the EFA for 19 variables, they are
divided into five factors the same as the
proposed model of Francois-Lecompte (2006).
Even the sequence of factors and variables in
each factor has been changed from the EFA
result. All criteria such as KMO, Bartlett’s test
of Sphericity, and Eigenvalues meet the
requirements of the EFA process mentioned in
the methodology, and factor loading for each
variable is also higher than 0.5. However, there
are high cross-loadings at variable CRP1 (I buy
some products of which a part of the price is
transferred to a humanitarian cause) with the
loading difference between the two loading
factors less than 0.3 and the cross-loading low
at variable SB2 (I buy in small businesses bakeries, butcher’s trade, book shoppers - as
often as possible) with the highest factor
loading value 0.385. Therefore, they are
dropped out one by one from the next EFA
steps. The process also satisfies the KMO
criteria and factor loadings requirements. This
action also helps to increase the total variance
explained from 71.8% to 74.14%. The final
components matrix and the result of testing
reliability of the new factors are represented in
Table 2.
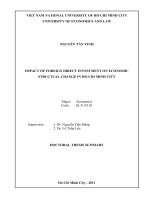
Table 2 shows that the factor loading of all
variables gets a value between 0.670 and 0.896,
with most variables loading above 0.7. This has
shown that the variables of each factor have a
strong correlation to each other. All variables in
the FB factor correlate higher than 0.5 within
the group and correlate too low (less than 0.3)
with the other variables in the model; As a
result, the FB factor has the highest Eigenvalue
and is the factor have strongest meaning to
SRC; This factor explains 25.5% of the
variance, and is the most important factor to
measure the meaning of SRC suggested for the
case of Vietnam. Cronbach’s alpha of this
factor is also the top at 0.876. For the variables
of the GO factor, if we look at the correlation
matrix, although the variable GO3 has a high
correlation with the other variables in the group,
64
L.T.T. Xuan, L.V. Tai / VNU Journal of Science: Economics and Business, Vol. 32, No. 2 (2016) 58-68
it also shows a slightly high correlation with
variables in the CRP group (0.45); however,
after EFA, the loading value of this variable in
the CRP is less than 0.3 and the difference in
the values of cross loading is higher than 0.3,
the variable GO3 is still present in the t GO
factor after the EFA even though it receives the
lowest loading value in the group. The GO
factor contributes about 19% in explanation for
the variance when combined with the other
factors and take the second position in the list
of factors to measure SRC. Cronbach’s alpha is
also high and reaches 0.842. For the factors of
CRP and SB, they rank 3 and 4 in the list and
contribute about 12% and 10% to each factor,
h
explaining for the variance, respectively. The
CV factor comes at the end of the list with 7.6%
of variance explained. This order is greatly
different with that in the study of FrancoisLecompte and Roberts (2006), i.e. CRP factor
at first, FB-2nd, SB-3rd, GO-4th and CV-the last.
Customer
attitude
from
different
demographic groups
Based on the variables remaining after
EFA, the score of each factor will be computed
by taking the average score of the belonging
variables, and then used to test whether there is
a difference in the attitude between the
demographic groups for each factor of SRC by
using ANOVA.
Table 1: Descriptive Statistics for measurement scales of SRC
Valid
Minimum
Mean
Median
Mode
5
3.480620
3.5
3
1.184448
1
5
3.503876
3
3
0.990257
258
1
5
3.329457
3
3
1.031113
258
1
5
3.468992
3
3
1.261681
258
1
5
4.027132
4
4
0.999261
258
1
5
4.011628
4
4
0.680798
CRP3
258
1
5
3.848837
4
4
0.766944
CRP4
258
1
5
3.782946
4
4
0.707568
SB1
258
1
5
3.387597
3
3
0.853075
SB2
258
1
5
3.073643
3
3
1.134633
SB3
258
1
5
3.430233
3
3
0.557370
SB4
258
1
5
3.395349
3
3
0.629083
GO1
258
1
5
3.596899
4
4
0.887461
GO2
258
1
5
3.519380
4
3
0.974331
GO3
258
2
5
3.887597
4
4
0.683814
GO4
258
1
5
3.713178
4
4
0.680059
CV1
258
2
5
3.643411
4
4
0.821766
CV2
258
1
5
3.360465
3
3
0.916252
CV3
258
1
5
3.577519
4
4
0.813034
FB1
258
1
FB2
258
FB3
FB4
CRP1
CRP2
Maximum
Variance
L.T.T. Xuan, L.V. Tai / VNU Journal of Science: Economics and Business, Vol. 32, No. 2 (2016) 58-68
65
Table 2: EFR and reliability testing result
Component
1
FB3 - I try not to buy products from companies that
don’t respect their employees
FB1 - I pay attention not to buy products from
companies that are close to illegal
FB2 - I try not to buy products from companies that
employ children
FB4 - I try not to buy products from companies that
strongly harm the environment
GO2 - I buy preferably Vietnamese products (like
cosmetics…)
GO1 - When I have the choice between a Vietnamese
product and an exported product, I choose the local
one
GO4 - I buy products made in my country – Vietnam
GO3 - I buy fruits and vegetables grown in Vietnam.
CRP3 - I buy products of which part of the price is
given to a good cause
CRP2 - I buy some products of which part of the price
goes to developing the country
CRP4 - I buy fair trade products
SB4 - I go to small markets to support fruits and
vegetables small producers
SB1 - I avoid doing all my shopping in big businesses
(large retailers)
SB3 - I help the storekeepers of my quarter to live
through my purchases
CV1 - I try to reduce my consumption to what I really
need
CV3 - I try not to buy objects that I can do by myself
CV2 - In a general manner, I try to reduce my
consumption
Extraction Method: Principal component analysis.
Rotation Method: Promax with Kaiser Normalization
2
3
4
5
Cronbach’s Cumulative of
Alpha
total variance
explained
.896
.885
0.876
25.5
0.842
44.3
0.789
56.8
0.759
66.5
0.752
74.1
.883
.726
.870
.844
.843
.670
.886
.820
.758
.839
.833
.724
.821
.811
.787
y
With the gender variable, only GO factors
receive different attitudes between men and
women - significant at 5%. Women evaluate
these factors higher than men.
There is no significant difference between
the age groups of age, statistically. However, on
average, the younger people give lower scores
than the older people in most groups and factors
except groups in the SB factor.
For the income variable, the average scores
of the low income and high income groups are
slightly lower than that of the middle income
group. This is due to the fact that most people
from the low income group are students who
are still receiving support from their families
and are still young and have not much
experience as well as choice in consuming
products. For the high income people, they tend
to consume by convenience. However,
excepting for the groups in the SB factor, which
is significantly different by income, the
difference between groups in other factors is
66
L.T.T. Xuan, L.V. Tai / VNU Journal of Science: Economics and Business, Vol. 32, No. 2 (2016) 58-68
not high and the confidence level is not
achieved at 95% testing.
In regard to the occupation variable, most
factors are satisfied for the test for
distinguishing between groups at 1 percent,
only the FB factor shows the test significant at
8 percent. Groups of staff in the office and
managers seem to have a higher responsibility
than the other groups by showing a high score
in most factors except SB. Workers care much
about GO and VC, housekeepers care about
GO, while the Engineer group shows to be the
least responsible group with the lowest score
given to all the factors mentioned in the SRC.
5. Discussion
This study is adapted from the study of
Francois Lecomple and Roberts (2006) (who
developed the measurement scale of SRC for
use in France) to test whether it could be used
for the Vietnamese context. The analysis has
shown that the suggested scales ensure
reliability and convergence in measuring the
factors of SRC. Only 3 variables, that are not
suitable with the context of Vietnam should
be dropped out. In the study of FrancoisLecompte and Roberts (2006), 20 variables
are divided into 5 factors [5]. Similarly, in the
present study, 17 variables are also divided
into these 5 factors.
In comparison, the mean score between
demographic groups of customers including
gender, income and occupation groups have a
statistical significance at 5%. Especially the
groups of occupation present differences in all
kinds of responsibility. This is a hint for
companies to have suitable marketing campaigns
and the government to have a reasonable policy to
improve companies’ performance.
This research could be considered as a
pioneer research in this field in Vietnam. It has
taken place under circumstance where
Vietnamese customers are afraid of using some
low cost but harmful products from China.
Vietnamese customers are also getting angry
with a series of scandals about the environment
being degraded/destroyed by unfaithful and
irresponsible producers. Consumers are more
concerned about social responsibility when
making consumption decisions. Therefore,
when conducting the present study, the
researchers also received expressions of
much concern from customers. However,
there were some variables in the
questionnaire not easy for customers to
answer due to them lacking information,
apparently. That might be the reason leading
to some of the consumers to not think about
SRC when making buying decisions.
As mentioned above, even though SRC has
been raised since the 1970s, it is understood
differently in different markets and cultures.
Therefore, when applying this SRC measure to
research in Vietnam, the suggested measure
seems still strange and does not receive the high
concern of Vietnamese customers. Respondents
still think that they are responsible consumers
but the score they get from the survey has
shown that they are not concerned much for
their responsibility. That’s because the income
of Vietnamese people is still low with two
thirds of their income used for consumption.
Therefore, the scale about supporting SB or
CRP seems not to be welcome.
Furthermore, Vietnam is a developing
country with an incomplete legal system, and
lacking in market information. This point
creates more difficulties for consumers in
realizing which firms are socially responsible to
perform their socially responsible consumption.
This study has shown that, the measure of
Francois-Lecompte and Roberts (2006) is not
properly appropriate for the Vietnamese
context. It is needed to develop another measure
L.T.T. Xuan, L.V. Tai / VNU Journal of Science: Economics and Business, Vol. 32, No. 2 (2016) 58-68
more appropriately, from which consumers can
have enough information or more easily
understand how to evaluate factors.
6. Implications and limitations
Even though some factors in the measure of
Francois-Lecompte and Roberts (2006) are still
strange for Vietnamese customers, it is useful to
improve their thinking and awareness of SRC.
On the one hand, this contributes to increase
their social responsible awareness when
performing consuming behavior in the future.
On the other hand, businesses may improve
their performance to adapt to new requirements
from customers.
The demographic origin factor receives the
highest concern as well as being the most
important factor to measure SRC. As mentioned
above, this could be the consequence of the
threat and danger of some products from China
as well as the campaign of the government with
the slogan of “Vietnamese consume Vietnamese
products”. People understand and react well
with this factor. The government should focus
on this to increase the SRC of customers and
Vietnamese companies should benefit from this
chance to develop and improve their businesses.
In particular, they should concentrate on
women, managers, and staff who show that they
are ready to encourage Vietnamese firms.
Moreover, companies should show the same
concern for their own behavior - the second
factor in the list of factors after EFA, even
though the score of variables in this factor is not
as high as that of the demographic origin factor.
Meanwhile, the government should improve the
information system to deliver more information
about firms to customers to help them make
better decisions on consumption and on having
a chance to improve their SRC.
For the small business support factor, the
score is not high and there are no significant
differences between demographic groups of
customers. Beside the reason of low income as
mentioned above, small businesses have still
67
not created prestige in doing business and
customers do not trust them due to the low
quality or expensive products. This also is an
alert for them in changing their performance
and improving themselves to attract customers.
With the responsibility on the CRP factor,
although getting a slightly high score from
customers, the convergence of this factor is not
high, correlation between variables is loosened
in some cases and it ranks in the last position in
the EFA. Thus, it should be considered to adjust
variables to be more suitable with the
Vietnamese case.
However, this research also suffers from
some limitations. Firstly, due to limited
knowledge and information, the employed scale
may not adapt well with Vietnamese
consumers’ perspectives; and some things they
understand as SRC are not included in the
questionnaire and vice versa. That is the reason
why respondents have tried to complete the
questionnaire without properly understanding it
in some circumstances. This limitation is also
mentioned in the study of Roberts (1995) [4].
Therefore, it is necessary to conduct a
qualitative study to explore constructs to
measure SRC in the Vietnamese context.
Secondly, the survey is conducted in Ho Chi
Minh City only. Even though this is the biggest
city and one of the most important economic
and trading centers in Vietnam, the survey
cannot cover the whole market of consumption
in Vietnam. Moreover, convenience sampling
also creates limits of the data representation.
Consequently, the findings cannot be
generalized for the Vietnamese market. Further
studies should be conducted and data collected
in many other areas in Vietnam to have a better
understanding of Vietnamese customers’
awareness of SRC.
References
[1] Phuc, H., “Drafting "characteristics" of
Vietnamese consumers”, The Saigon Times, 07
Sep
2014,
< />
68
L.T.T. Xuan, L.V. Tai / VNU Journal of Science: Economics and Business, Vol. 32, No. 2 (2016) 58-68
[2] Mohr, L. A., Webb, D. J., Harris, K. E., “Do
consumers expect companies to be socially
responsible? The impact of corporate social
responsibility on buying behavior”, The Journal
of Consumer Affairs, 35 (2001) 1, 45-72.
[3] Singh, N., “Exploring socially responsible
behaviour of Indian consumers: an empirical
investigation”, Social Responsibility Journal, 5
(2009) 2, 200-211.
[4] Roberts, J. A., “Profilling levels of socially
responsible consumer behavior: A cluster
analytic approach and its implications for
marketing”, Journal of Marketing Theory &
Practice, 3 (1995) 4, 97.
[5] Francois-Lecompte, A., Roberts, J. A.,
“Developing a measure of socially responsible
consumption
in
France”,
Marketing
Management Journal, 16 (2006) 2, 50-66.
[6] Chen, H., Kong, Y., “Chinese consumer
perceptions
of
socially
responsible
consumption”, Social Responsibility Journal, 5
(2009) 2, 144.
[7] Lebzar, B., Sidmou, M. L., Jahidi, R., “Social
Responsibility of Consumer Case of Products from
the Social Economy in Morocco”, International
Business Research, 5 (2012) 7, 56-62.
[8] Cabrera, S. A. Williams, C. L., “Consuming for the
Social Good: Marketing, Consumer Citizenship,
and the Possibilities of Ethical Consumption”,
Critical Sociology, 40 (2014) 3, 349.
[9] Caruana, R., Chatzidakis, A., “Consumer Social
Responsibility (CnSR): Toward a Multi-Level,
Multi-Agent Conceptualization of the 'Other CSR'”,
Journal of Business Ethics, 121 (2014) 4, 577.
[10] Pedrini, M., Ferri, L. M., “Socio-demographical
antecedents of responsible consumerism
propensity”, International Journal of Consumer
Studies, 38 (2014) 2, 127-138.
[11] Valor, C., Carrero, I., “Viewing Responsible
Consumption as a Personal Project”, Psychology
& Marketing, 31 (2014) 12, 1110-1121.
[12] Díaz-Méndez, M., “Ethics and consumption: a
difficult balance”, International Review on
Public and Non - Profit Marketing, 7 (2010) 1,
1-10.
[13] Gonzalez, C., Korchia, M., Menuet, L., Urbain,
C., “How do Socially Responsible Consumers
Consider Consumption? An Approach with the
Free Associations Method”, Recherche et
Applications en Marketing, 24 (2009) 3, 25-41.
[14] Özçaglar-Toulouse, N., “What Meaning do
Responsible Consumers Give to Their
Consumption? An Approach by Narratives”,
Recherche et Applications en Marketing, 24
(2009) 3, 3-22.
[15] Lee, K., “Predictors of Sustainable Consumption
among Young Educated Consumers in Hong
Kong”, Journal of International Consumer
Marketing, 26 (2014) 3, 217-238.
[16] Chia-Ju, L., “An Empirical Study on the
Antecedents
of
Socially
Responsible
Consumption
Behavior”.
in
Complex,
Intelligent, and Software Intensive Systems
(CISIS), 2013 Seventh International Conference
on, 3-5 July 2013 2013, 654-660
[17] Carmen, V., “Can consumers buy responsibly?
Analysis and solutions for market failures”,
Journal of Consum Policy, 31 (2008), 315.
[18] Brinkmann, J., “Looking at Consumer Behavior
in a Moral Perspective”, Journal of Business
Ethics, 51 (2004) 2, 129.
[19] Öberseder, M., Schlegelmilch, B., Gruber, V.,
“Why Don't Consumers Care About CSR?: A
Qualitative Study Exploring the Role of CSR in
Consumption Decisions”, Journal of Business
Ethics, 104 (2011) 4, 449-460.
[20] Haws, K. L., Winterich, K. P., Naylor, R. W.,
“Seeing the world through GREEN-tinted
glasses: Green consumption values and
responses to environmentally friendly products”,
Journal of Consumer Psychology, 24 (2014) 3,
336-354.