Ebook Fundamentals of economics (4th edition): Part 2
Bạn đang xem bản rút gọn của tài liệu. Xem và tải ngay bản đầy đủ của tài liệu tại đây (10.94 MB, 269 trang )
Part Three
The National and Global Economies
CHAPTER 9
An Overview of the National and International Economies
1.
2.
3.
4.
5.
What is a household, and what is household income and spending?
What is a business firm, and what is business spending?
How does the international sector affect the economy?
What does government do?
How do the three private sectors—households, businesses, and the international
sector—interact in the economy?
6. How does the government interact with the other sectors of the economy?
CHAPTER 10
Macroeconomic Measures
1.
2.
3.
4.
5.
CHAPTER 11
Unemployment, Inflation, and Business Cycles
1.
2.
3.
4.
5.
CHAPTER 12
How is the total output of an economy measured?
What is the difference between nominal and real GDP?
What is the purpose of a price index?
How is money traded internationally?
How do nations record their transactions with the rest of the world?
What is a business cycle?
How is the unemployment rate defined and measured?
What is the cost of unemployed resources?
What is inflation?
Why is inflation a problem?
Macroeconomic Equilibrium: Aggregate Demand and Supply
1.
2.
3.
4.
What is aggregate demand?
What causes the aggregate demand curve to shift?
What is aggregate supply?
Why does the short-run aggregate supply curve become steeper as real GDP
increases?
5. Why is the long-run aggregate supply curve vertical?
6. What causes the aggregate supply curve to shift?
7. What determines the equilibrium price level and real GDP?
CHAPTER 13
Fiscal Policy
1.
2.
3.
4.
CHAPTER 14
How can fiscal policy eliminate a GDP gap?
How has U.S. fiscal policy changed over time?
What are the effects of budget deficits?
How does fiscal policy differ across countries?
Money and Banking
1.
2.
3.
4.
5.
6.
What is money?
How is the U.S. money supply defined?
How do countries pay for international transactions?
Why are banks considered intermediaries?
How does international banking differ from domestic banking?
How do banks create money?
185
Chapter 9
?
Fundamental
Questions
1. What is a household,
and what is
household income
and spending?
2. What is a business
firm, and what is
business spending?
3. How does the
international sector
affect the economy?
4. What does
government do?
5. How do the three
private sectors—
households,
businesses, and the
international sector—
interact in the
economy?
6. How does the
government interact
with the other
sectors of the
economy?
An Overview of the National
and International Economies
Y
ou decide to buy a new Toyota, so you go
to a Toyota dealer and exchange money
for the car. The Toyota dealer has rented
land and buildings and hired workers in order to make cars available to you and
other members of the public. The employees earn income paid by the Toyota dealer
and then use their incomes to buy food from the grocery store. This transaction
generates revenue for the grocery store, which hires workers and pays them incomes that they then use to buy groceries and Toyotas. Your expenditure for the
Toyota is part of a circular flow. Revenue is received by the Toyota dealer, who
pays employees, who, in turn, buy goods and services.
Of course, the story is complicated by the fact that the Toyota is originally manufactured and purchased in Japan and then shipped to the United States before it
can be sold by the local Toyota dealer. Your purchase of the Toyota creates revenue
for the local dealer as well as for the manufacturer in Japan, which pays Japanese
autoworkers to produce Toyotas. Furthermore, when you buy your Toyota, you
must pay a tax to the government, which uses tax revenues to pay for police protection, national defense, the legal system, and other services. Many people in different areas of the economy are involved.
An economy is made up of individual buyers and sellers. Economists could discuss the neighborhood economy that surrounds your university, the economy of the
city of Chicago, or the economy of the state of Massachusetts. But typically it is the
national economy, the economy of the United States, that is the center of their attention. To clarify the operation of the national economy, economists usually group
individual buyers and sellers into sectors: households, businesses, government, and
the international sector. Since the U.S. economy affects, and is affected by, the rest
of the world, to understand how the economy functions, we must include the international sector. In this chapter we examine basic data and information on each individual sector and examine how the sectors interact. ■
Preview
1. HOUSEHOLDS
household: one or more
persons who occupy a unit of
housing
186
A household consists of one or more persons who occupy a unit of housing. The
unit of housing may be a house, an apartment, or even a single room, as long as it
Part Three / The National and Global Economies
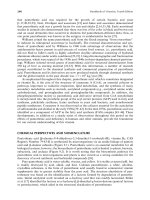
The graph reveals that householders aged 35 to 44 make
up the largest number of
households, and householders aged 45 to 54 earn the
highest median annual
income.
Source: U.S. Department of
Commerce, Income in the
United States: 2005,
.
30
Total Households (millions)
Age of Householder,
Number of Households, and
Median Household Income
in the United States
70
Median Income
25
60
50
20
Total Households
40
15
30
10
20
5
10
15 – 24
25 – 34
35 – 44
45 – 54
55 – 64
Median Annual Income (thousand dollars)
Figure 1
65 +
Age of Householder
constitutes separate living quarters. A household may consist of related family
members, like a father, mother, and children, or it may comprise unrelated individuals, like three college students sharing an apartment. The person in whose name
the house or apartment is owned or rented is called the householder.
?
1. What is a household,
and what is household
income and spending?
1.a. Number of Households and Household Income
In 2005, there were more than 112 million households in the United States.
The breakdown of households by age of householder is shown in Figure 1. Householders between 35–44 and 45–54 years old make up the largest number of households. Householders between 45 and 54 years old have the largest median income.
The median is the middle value—half of the households in an age group have an income higher than the median, and half have an income lower than the median.
Figure 1 shows that households in which the householder is between 45 and 54
years old have a median income of about $62,000, substantially higher than the
median incomes of other age groups. Typically, workers in this age group are at the
peak of their earning power. Younger households are gaining experience and training;
older households include retired workers.
Thirty-three percent of all households are two-person households. The stereotypical household of husband, wife, and two children accounts for only 14 percent
of all households. There are relatively few large households in the United States.
Of the more than 112 million households in the country, only about 1 percent have
seven or more persons.
1.b. Household Spending
consumption: household
spending
Household spending is called consumption. Householders consume housing,
transportation, food, entertainment, and other goods and services. Household
spending (also called consumer spending) is the largest component of total spending in the economy—rising to about $9.3 trillion in 2006.
Chapter 9 / An Overview of the National and International Economies
187
R E C A P
?
2. What is a business firm,
and what is business
spending?
1. A household consists of one or more persons who occupy a unit of
housing.
2. An apartment or house is rented or owned by a householder.
3. As a group, householders between the ages of 45 and 54 have the highest median incomes.
4. Household spending is called consumption.
2. BUSINESS FIRMS
A business firm is a business organization controlled by a single management. The
firm’s business may be conducted at more than one location. The terms company,
enterprise, and business are used interchangeably with firm.
2.a. Forms of Business Organizations
multinational business: a
firm that owns and operates
producing units in foreign
countries
Firms are organized as sole proprietorships, partnerships, or corporations. A sole proprietorship is a business owned by one person. This type of firm may be a one-person
operation or a large enterprise with many employees. In either case, the owner receives all the profits and is responsible for all the debts incurred by the business.
There is no separation between the owner and the firm in that the owner has unlimited liability for the firm’s debts, and profits are taxed at the owner’s individual income tax rate. However, the owner also has sole control over business decisions.
A partnership is a business owned by two or more partners who share both the
profits of the business and responsibility for the firm’s losses. The partners could be
individuals, estates, or other businesses. Partners owning a firm have unlimited liability for firm debts and are taxed at individual tax rates.
State law allows the formation of corporations. A corporation is a business whose
identity in the eyes of the law is distinct from the identity of its owners. A corporation is
an economic entity that, like a person, can own property and borrow money in its own
name. The owners of a corporation are shareholders. If a corporation cannot pay its
debts, creditors cannot seek payment from the shareholders’ personal wealth. The corporation itself is responsible for all its actions. The shareholders’ liability is limited to
the value of the stock they own. Corporations are taxed at corporate income tax rates. In
many corporations there are many shareholders who exercise no control over the firm.
A separation of ownership and control may occur when the professional managers of
the firm are different individuals than those who own large amounts of stock.
Many firms are global in their operations even though they may have been founded
and may be owned by residents of a single country. Firms typically first enter the international market by selling products to foreign countries. As revenues from these
sales increase, the firms realize advantages by locating subsidiaries in foreign countries. A multinational business is a firm that owns and operates producing units in
foreign countries. The best-known U.S. corporations are multinational firms. Ford,
IBM, PepsiCo, and McDonald’s all own operating units in many different countries.
Ford Motor Company, for instance, is the parent firm of sales organizations and assembly plants located around the world. As transportation and communication technologies progress, multinational business activity will grow.
2.b. Business Statistics
There are far more sole proprietorships than partnerships or corporations in the
United States. The great majority of sole proprietorships are small businesses, with
revenues under $25,000 a year. Similarly, more than half of all partnerships also
188
Part Three / The National and Global Economies
have revenues under $25,000 a year, but only 23 percent of the corporations are in
this category.
The 68 percent of sole proprietorships that earn less than $25,000 a year account
for only 9 percent of the revenue earned by proprietorships. The 0.4 percent of proprietorships with revenue of $1 million or more account for 19 percent. Even more
striking are the figures for partnerships and corporations. The 58 percent of partnerships with the smallest revenue account for only 0.4 percent of the total revenue
earned by partnerships. At the other extreme, the 5 percent of partnerships with the
largest revenue account for 88 percent of total partnership revenue. The 23 percent of
corporations in the smallest range account for less than 0.1 percent of total corporate
revenue, while the 18 percent of corporations in the largest range account for 94
percent of corporate revenue.
Big business is important in the United States. There are many small firms, but
large firms and corporations account for the greatest share of business revenue.
Although there are only about one-third as many corporations as sole proprietorships, corporations have more than 15 times the revenue of sole proprietorships.
2.c. Firms Around the World
Big business is a dominant force in the United States. Many people believe that because the United States is the world’s largest economy, U.S. firms are the largest in
the world. Figure 2 shows that this is not entirely true. Of the ten largest corporations in the world (measured by sales), four are outside the United States. Big business is not just a U.S. phenomenon.
2.d. Business Spending
investment: spending on
capital goods to be used in
producing goods and services
Figure 2
Investment is the expenditure by business firms for capital goods—machines,
tools, and buildings—that will be used to produce goods and services. The economic meaning of investment is different from the everyday meaning, “a financial
transaction such as buying bonds or stocks.” In economics, the term investment
refers to business spending for capital goods.
Rank Firm (country)
The World’s Ten Largest
Public Companies
1
Exxon Mobil (U.S.)
As shown in the chart, large
firms are not just a U.S.
phenomenon.
2
Wal-Mart Stores (U.S.)
312
3
Royal Dutch/ Shell Group (Netherlands)
307
4
British Petroleum (U.K.)
249
5
General Motors (U.S.)
193
6
Chevron (U.S.)
185
7
Ford Motor (U.S.)
178
8
DaimlerChrysler (Germany/U.S.)
177
9
Toyota Motor (Japan)
173
10
ConocoPhillips (U.S.)
162
$328
0
50 100 150 200 250 300 350
Sales (billions)
Source: “The Forbes 2000,” . Reprinted by permission of Forbes
Magazine. Copyright © 2007 Forbes LLC.
Chapter 9 / An Overview of the National and International Economies
189
Investment spending in 2006 was $2,218 billion, an amount equal to roughly
one-fifth of consumption, or household spending. Investment increases unevenly,
actually falling at times and then rising very rapidly. Even though investment
spending is much smaller than consumption, the wide swings in investment spending mean that business expenditures are an important factor in determining the economic health of the nation.
R E C A P
?
3. How does the international sector affect the
economy?
1. Business firms may be organized as sole proprietorships, partnerships, or
corporations.
2. Large corporations account for the largest fraction of total business
revenue.
3. Business investment spending fluctuates widely over time.
3. THE INTERNATIONAL SECTOR
Today, foreign buyers and sellers have a significant effect on economic conditions
in the United States, and developments in the rest of the world often influence
U.S. buyers and sellers. We saw in previous chapters, for instance, how exchange
rate changes can affect the demand for and supply of U.S. goods and services.
3.a. Types of Countries
The nations of the world may be divided into two categories: industrial countries
and developing countries. Developing countries greatly outnumber industrial countries (see Figure 3). The World Bank (an international organization that makes
loans to developing countries) groups countries according to per capita income
(income per person). Low-income economies are those with per capita incomes
of $755 or less. Lower-middle-income economies have per capita incomes of
$756 to $2,995. Upper-middle-income economies have per capita incomes of
$2,996 to $9,265. High-income economies—oil exporters and industrial market
economies—have per capita incomes of greater than $9,266. Some countries
are not members of the World Bank and so are not categorized, and information
about a few small countries is so limited that the World Bank is unable to classify
them.
It is readily apparent from Figure 3 that low-income economies are heavily concentrated in Africa while lower-middle-income economies are heavily concentrated
in Asia. Countries in these regions have a low profile in U.S. trade, although they
may receive aid from the United States. The U.S. trade is concentrated with its
neighbors Canada and Mexico, along with the major industrial powers.
3.a.1. The Industrial Countries The richest industrial market economies are
listed in the bar chart in Figure 4. The countries listed in Figure 4 are among the
wealthiest countries in the world. Not appearing on the list are the high-income oilexporting nations like Libya, Saudi Arabia, Kuwait, and the United Arab Emirates,
which are considered to still be developing.
The economies of the industrial nations are highly interdependent. As conditions
change in one nation, business firms and individuals looking for the best return or
interest rate on their funds may shift large sums of money from one country to others. As they do, economic conditions in one country spread to other countries. As a
result, the industrial countries, particularly the major economic powers like the
United States, Germany, and Japan, are forced to pay close attention to each other’s
economic policies.
190
Part Three / The National and Global Economies
imports: products that a
country buys from other
countries
exports: products that a
country sells to other countries
3.a.2. The Developing Countries Referring back to Figure 3, we see that the
developing countries (sometimes referred to as the less-developed countries, or
LDCs) are classified as low or middle income. These countries differ greatly in
terms of the provision of basic human needs to the average citizen. A major way that
such countries can raise living standards is by selling goods to the rest of the world.
The United States tends to buy, or import, primary products such as agricultural
produce and minerals from the developing countries. Products that a country buys
from another country are called imports. The United States tends to sell, or export,
manufactured goods to developing countries. Products that a country sells to another
country are called exports. The United States is the largest producer and exporter of
grains and other agricultural output in the world. The efficiency of U.S. farming relative to farming in much of the rest of the world gives the United States a comparative advantage in many agricultural products.
3.b. International Sector Spending
trade surplus: the situation
that exists when imports are
less than exports
trade deficit: the situation
that exists when imports
exceed exports
net exports: the difference
between the value of exports
and the value of imports
R E C A P
Economic activity of the United States with the rest of the world includes U.S.
spending on foreign goods and foreign spending on U.S. goods. Figure 5 shows how
U.S. exports and imports are spread over different countries. Trade with Western
Europe, Canada, and Japan accounts for about half of U.S. trade.
When exports exceed imports, a trade surplus exists. When imports exceed
exports, a trade deficit exists. Figure 5 shows that the United States is importing
much more than it exports.
The term net exports refers to the difference between the value of exports and
the value of imports: net exports equals exports minus imports. Positive net exports
represent trade surpluses; negative net exports represent trade deficits. In 2006,
U.S. net exports were −$762 billion.
1. The majority of U.S. trade is with the industrial market economies.
2. Exports are products sold to foreign countries; imports are products bought
from foreign countries.
3. Exports minus imports equals net exports.
4. Positive net exports signal a trade surplus; negative net exports signal a trade
deficit.
4. OVERVIEW OF THE U.S. GOVERNMENT
?
4. What does government
do?
When Americans think of government policies, rules, and regulations, they
typically think of Washington, D.C., because their economic lives are regulated and
shaped more by policies made there than by policies made at the state and local levels.
Who actually is involved in economic policymaking? Important government institutions that shape U.S. economic policy are listed in Table 1. This list is far from inclusive, but it does include the agencies with the broadest powers and greatest influence.
Economic policy involves macroeconomic issues like government spending and control of the money supply and microeconomic issues aimed at providing public goods
like police and military protection and correcting problems such as pollution.
4.a. Government Policy
The government has been given many functions in the economy. These include providing some goods, regulating some firm behaviors, and promoting competition via
laws restricting the ability of business firms to engage in certain practices.
Chapter 9 / An Overview of the National and International Economies
191
Figure 3
World Economic
Development
The colors on the map identify low-income, middleincome, and high-income
economies. Countries have
been placed in each group
on the basis of GNP per
capita and, in some instances, other distinguishing
economic characteristics.
N o r t h
A m e r i c a
Source: World Bank,
S o u t h
A m e r i c a
Low-income economies
$755 or less
Lower-middle-income economies
$756 to $2,995
Upper-middle-income economies
$2,996 to $9,265
High-income economies
$9,266 or more
No data
monetary policy: policy
directed toward the control of
money and credit
Federal Reserve: the central
bank of the United States
fiscal policy: policy directed
toward government spending
and taxation
192
Most attention is given to the government’s monetary and fiscal policies.
Monetary policy is policy directed toward the control of money and credit. The
major player in this policy arena is the Federal Reserve, commonly called the Fed.
The Federal Reserve is the central bank of the United States. It serves as a banker
for the U.S. government and regulates the U.S. money supply.
The Federal Reserve System is run by a seven-member Board of Governors. The
most important member of the board is the chairman, who is appointed by the president for a term of four years. The board meets regularly (from 10 to 12 times a
year) with a group of high-level officials to review the current economic situation
and set policy for the growth of U.S. money and credit. The Federal Reserve exercises a great deal of influence on U.S. economic policy.
Fiscal policy, the other area of macroeconomic policy, is policy directed toward
government spending and taxation. In the United States, fiscal policy is determined
by laws that are passed by Congress and signed by the president. The relative roles
of the legislative and executive branches in shaping fiscal policy vary with the political climate, but usually it is the president who initiates major policy changes.
Presidents rely on key advisers for fiscal policy information. These advisers include cabinet officers such as the Secretary of the Treasury and the Secretary of
State as well as the Director of the Office of Management and Budget. In addition,
the president has a Council of Economic Advisers made up of three economists—
Part Three / The National and Global Economies
A s i a
E u r o p e
A f r i c a
A u s t r a l i a
usually a chair, a macroeconomist, and a microeconomist—who, together with
their staff, monitor and interpret economic developments for the president. The
degree of influence wielded by these advisers depends on their personal relationship with the president.
4.b. Government Spending
transfer payments: income
transferred from one citizen
who is earning income to
another citizen who may
not be
Federal, state, and local government spending for goods and services between 1959
and 2004 is shown in Figure 6. Except during times of war in the 1940s and 1950s,
federal expenditures were roughly similar in size to state and local expenditures
until 1970. Since 1970, state and local spending has been growing more rapidly
than federal spending.
Combined government spending on goods and services is larger than investment
spending but much smaller than consumption. In 2006, combined government
spending was $2,526 billion, investment spending was $2,218 billion, and consumption was $9,271 billion.
Besides government expenditures on goods and services, government also serves
as an intermediary, taking money from taxpayers with higher incomes and transferring this income to those with lower incomes. Such transfer payments are a part
of total government expenditures, so the total government budget is much larger
than the expenditures on goods and services reported in Figure 6. In 2006, total
Chapter 9 / An Overview of the National and International Economies
193
Figure 4
Country
The Industrial Market
Economies
Norway
Switzerland
United States
Denmark
Japan
Sweden
Ireland
United Kingdom
Finland
Austria
Netherlands
Belgium
Germany
France
Canada
Australia
Hong Kong
Italy
Singapore
Spain
New Zealand
Israel
Portugal
The bar chart lists some of
the wealthiest countries in
the world. Ironically, highincome oil-exporting countries such as Libya, Saudi
Arabia, Kuwait, and the
United Arab Emirates do not
appear on the list because
they are still considered to be
developing.
$51,810
49,600
41,440
40,750
37,050
35,840
34,310
33,630
32,880
32,280
32,130
31,280
30,690
30,370
28,310
27,070
26,660
26,280
24,760
21,530
19,990
17,360
14,220
0
5
10
15
20
25
30
35
40
45
50
55
Income per Person (thousands of 1998 U.S. dollars)
Source: World Bank, World Development Report, 2006;
/>
budget surplus: the excess
that results when government
spending is less than revenue
budget deficit: the shortage
that results when government
spending is greater than
revenue
194
expenditures of federal, state, and local government for goods and services were
$2,526 billion. In this same year, transfer payments paid by all levels of government were $1,593 billion.
The magnitude of federal government spending relative to federal government
revenue from taxes has been a major issue in recent U.S. national elections. Figure
7 shows that the federal budget was roughly balanced until the early 1970s. The
budget is a measure of spending and revenue. A balanced budget occurs when federal spending is approximately equal to federal revenue. This was the case through
the 1950s and 1960s. If federal government spending is less than tax revenue, a
budget surplus exists. Until 1998, the U.S. government last had a budget surplus
in 1969. By the early 1980s, federal government spending was much larger than
revenue, so a large budget deficit existed. The federal budget deficit grew very
rapidly to well over $200 billion by the early 1990s. When spending is greater than
revenue, the excess spending must be covered by borrowing, and this borrowing
can have effects on investment and consumption as well as on economic relationships with other countries. In the late 1990s, the budget deficit dropped rapidly as
strong economic growth generated tax revenues that grew more rapidly than expenditures, and a surplus was realized by 1998. However, by 2002, the budget had returned to a deficit.
Part Three / The National and Global Economies
Figure 5
Direction of U.S. Trade
Canada accounts for about 44 percent of U.S. exports and
38 percent of U.S. imports.
This chart shows that a trade deficit exists for the United
States, since U.S. imports greatly exceed U.S. exports. The
chart also shows that trade with Japan, Mexico, and
Source: Economic Report of the President, 2006;
www.census.gov/foreign_trade.
Industrial Countries:
Canada
Japan
Western Europe
Other
Other Countries
Mexico
China
Oil Exporters
$844
U.S. Exports to:
$1,643
U.S. Imports from:
0
100
200
300
400
500
600
700
800
900
1,000 1,100 1,200 1,300 1,400 1,500 1,600
Billions of U.S. Dollars
Table 1
Institution
U.S. Government Economic
Policymakers and Related
Agencies
Fiscal policymakers
Role
President
Provides leadership in formulating fiscal policy
Congress
Sets government spending and taxes and
passes laws related to economic conduct
Monetary policymaker
Federal Reserve
Controls money supply and credit conditions
Related agencies
Council of Economic Advisers
Monitors the economy and advises the
president
Office of Management
and Budget
Prepares and analyzes the federal budget
Treasury Department
Administers the financial affairs of the federal
government
Commerce Department
Administers federal policy regulating industry
Justice Department
Enforces legal setting of business
Comptroller of the Currency
Oversees national banks
International Trade
Commission
Investigates unfair international trade practices
Federal Trade Commission
Administers laws related to fair business
practices and competition
Chapter 9 / An Overview of the National and International Economies
195
Figure 6
In the 1950s and early 1960s,
federal government spending
was above state and local
government spending. In
1971, state and local expenditures rose above federal
spending and have remained
higher ever since.
Source: Data are from the
Economic Report of the President, 2005.
1,200
U.S. Government Spending (billion dollars)
Federal, State, and Local
Government Expenditures
for Goods and Services
State and Local
1,000
800
Federal
600
400
200
0
1962 '65 '68 '71 '74 '77 '80 '83 '86 '89 '92 '95 '98 '01 2004
Year
R E C A P
1. The microeconomic functions of government focus on issues aimed at providing public goods like police and military protection and correcting problems like pollution.
2. Macroeconomic policy attempts to control the economy through monetary
and fiscal policies.
3. The Federal Reserve conducts monetary policy. Congress and the president
formulate fiscal policy.
4. Government spending is larger than investment spending but much smaller
than consumption spending.
5. When government spending exceeds tax revenue, a budget deficit exists.
When government spending is less than tax revenue, a budget surplus exists.
5. LINKING THE SECTORS
private sector: households,
businesses, and the
international sector
Now that we have an idea of the size and structure of each private sector—
households, businesses, and international—and the government, also known as the
public sector, let’s discuss how the sectors interact.
public sector: the government
5.a. The Private Sector
Households own all the basic resources, or factors of production, in the economy.
Household members own land and provide labor, and they are the entrepreneurs,
stockholders, proprietors, and partners who own business firms.
Households and businesses interact with each other by means of buying and
selling. Businesses employ the services of resources in order to produce goods and
services. Business firms pay households for their services of resources.
Households sell their resource services to businesses in exchange for money
payments. The flow of resource services from households to businesses is shown
196
Part Three / The National and Global Economies
Figure 7
The budget deficit is equal to
the excess of government
spending over tax revenue. If
taxes are greater than government spending, a budget surplus (shown as a negative
deficit) exists. The United
States has run a budget
deficit for all but two years
in the period 1959 to 1997.
Starting in 1998, a budget
surplus appeared for four
years.
U.S. Federal Budget Deficits (billion dollars)
U.S. Federal Budget Deficits
300
200
100
0
–100
–200
–300
–400
–500
r
60 962 964 966 968 970 972 974 976 rte 978 980 982 984 986 988 990 992 994 996 998 000 002 004 006
1 1 1 1 1 1 1 1 ua 1 1 1 1 1 1 1 1 1 1 1 2 2 2 2
q
on
iti
ns
a
Tr
19
Year
Source: Data are from the Economic Report of the President, 2005.
?
5. How do the three private
sectors—households,
businesses, and the
international sector—
interact in the
economy?
circular flow diagram: a
model showing the flow of
output and income from
one sector of the economy
to another
by the blue arrow beneath the sectors of households, government, and firms shown
in Figure 8. The flow of money payments from firms to households is shown by the
gold arrow under Resource Services. Households use the money payments to buy
goods and services from firms. These money payments are the firms’ revenues. The
flow of money payments from households to firms is shown by the gold arrow near
the top of the diagram. The flow of goods and services from firms to households is
shown by the blue arrow under Payments for Goods and Services. There is, therefore, a flow of money and goods and services from one sector to the other. The payments made by one sector are the receipts taken in by the other sector. Money,
goods, and services flow from households to firms and back to households in a circular flow.
Households do not spend all of the money they receive. They save some fraction of
their income. In Figure 8, we see that household saving is deposited in financial intermediaries like banks, credit unions, and savings and loan firms. A financial intermediary accepts deposits from savers and makes loans to borrowers. The money that is
saved by the households reenters the economy in the form of investment spending as
business firms borrow for expansion of their productive capacity.
To simplify this circular flow diagram, let’s assume that households are not directly engaged in international trade and that only business firms are buying and
selling goods and services across international borders. This assumption is not far
from the truth for the industrial countries and for many developing countries. We
typically buy a foreign-made product from a local business firm rather than directly
from the foreign producer.
The lines Net Exports and Payments for Net Exports connect firms and foreign countries in Figure 8. Notice that neither line has an arrow indicating the
direction of flow as do the other lines in the diagram. The reason is that net exports
of the home country may be either positive (a trade surplus) or negative (a
trade deficit). When net exports are positive, there is a net flow of goods from the
Chapter 9 / An Overview of the National and International Economies
197
Figure 8
The Circular Flow: Households, Firms, Government,
and Foreign Countries
The diagram assumes that households and government
are not directly engaged in international trade. Domestic
firms trade with firms in foreign countries. The government sector buys resource services from households and
goods and services from firms. This government spending
represents income for the households and revenue for
the firms. The government uses the resource services and
goods and services to provide government services for
households and firms. Households and firms pay taxes
to the government to finance government expenditures.
Financial
Intermediaries
Saving ($)
Investment ($)
Payments for Goods and Services ($)
Goods and Services
Taxes ($)
Households
Taxes ($)
Government Services
Government
Resource Services
Government Services
Firms
Goods and Services
Payments for Resource Services ($)
Payments for Goods and Services ($)
Resource Services
Payments for Resource Services ($)
Foreign Countries
Exports
Imports
Net Exports
Payments for Net Exports ($)
firms of the home country to foreign countries and a net flow of money from foreign countries to the firms of the home country. When net exports are negative, the
opposite occurs. A trade deficit involves a net flow of goods from foreign countries
to the firms of the home country and a net flow of money from firms in the home
country to foreign countries. If exports and imports are equal, net exports are zero
because the value of exports is offset by the value of imports.
198
Part Three / The National and Global Economies
5.b. The Public Sector
?
6. How does the government interact with the
other sectors of the
economy?
R E C A P
Government at the federal, state, and local levels interacts with both households
and firms. Because the government employs factors of production to produce
government services, households receive payments from the government in
exchange for the services of the factors of production. The flow of resource
services from households to government is illustrated by the blue arrow from
households to government in Figure 8. The flow of money from government to
households is shown by the gold arrow from government to households. We
assume that government, like a household, does not trade directly with foreign
countries but obtains foreign goods from domestic firms that do trade with the rest
of the world.
Households pay taxes to support the provision of government services, such as
national defense, education, and police and fire protection. In a sense, then, the
household sector is purchasing goods and services from the government as well as
from private businesses. The flow of tax payments from households and firms to
government is illustrated by the gold arrows from households and firms to government, and the flow of government services to households and firms is illustrated by
the purple arrows coming from government.
The addition of government brings significant changes to the model. Households have an additional place to sell their resources for income, and businesses
have an additional market for goods and services. The value of private production
no longer equals the value of household income. Households receive income from
government in exchange for providing resource services to government. The total
value of output in the economy is equal to the total income received, but government is included as a source of income and a producer of services.
1. The circular flow diagram illustrates how the main sectors of the economy fit
together.
2. Government interacts with both households and firms. Households get government services and pay taxes; they provide resource services and receive
income. Firms sell goods and services to government and receive income.
3. The circular flow diagram shows that the value of output is equal to income.
SUMMARY
?
1.
2.
?
3.
4.
What is a household, and what is household
income and spending?
A household consists of one or more persons who occupy a unit of housing.
Household spending is called consumption and is the
largest component of spending in the economy.
What is a business firm, and what is business
spending?
A business firm is a business organization controlled
by a single management.
Businesses may be organized as sole proprietorships,
partnerships, or corporations.
5.
?
6.
7.
8.
Business investment spending—the expenditure by
business firms for capital goods—fluctuates a great
deal over time.
How does the international sector affect the
economy?
The international trade of the United States occurs
predominantly with the other industrial economies.
Exports are products sold to the rest of the world. Imports are products bought from the rest of the world.
Exports minus imports equal net exports. Positive net
exports mean that exports are greater than imports and
a trade surplus exists. Negative net exports mean that
imports exceed exports and a trade deficit exists.
Chapter 9 / An Overview of the National and International Economies
199
?
What does government do?
9.
The government carries out microeconomic and macroeconomic activities. The microeconomic activities involve providing public goods and correcting market
failures. The macroeconomic activities attempt to control the economy through monetary and fiscal policies.
10. In the United States, monetary policy is the province
of the Federal Reserve, and fiscal policy is up to the
Congress and the president.
?
How do the three private sectors—households,
businesses, and the international sector—interact
in the economy?
12. Some household income is not spent but instead is
saved in financial intermediaries from which firms
borrow for expansion of their productive capacity.
13. The circular flow diagram assumes that households
are not directly engaged in international trade but,
rather, that only business firms buy and sell goods and
services across international borders.
?
How does the government interact with the
other sectors of the economy?
14. The circular flow diagram illustrates the interaction
among all sectors of the economy—households,
businesses, the international sector, and the public
sector.
11. Money, goods, and services flow from households to
firms and back in a circular flow.
EXERCISES
1.
2.
Is a family a household? Is a household a family?
Which sector (household, business, or international)
spends the most? Which sector spends the least?
Which sector, because of volatility, has importance
greater than is warranted by its size?
What does it mean if net exports are negative?
Why does the value of output always equal the income received by the resources that produced the
output?
Total spending in the economy is equal to consumption plus investment plus government spending plus
net exports. If households want to save and thus do
not use all of their income for consumption, what will
happen to total spending? Because total spending in
the economy is equal to total income and output, what
will happen to the output of goods and services if
households want to save more?
People sometimes argue that imports should be limited by government policy. Suppose a government
quota on the quantity of imports causes net exports to
rise. Using the circular flow diagram as a guide, explain why total expenditures and national output may
3.
4.
5.
6.
Internet
Exercise
7.
8.
9.
rise after the quota is imposed. Who is likely to benefit from the quota? Who will be hurt?
Draw the circular flow diagram linking households,
business firms, and the international sector. Use the
diagram to explain the effects of a decision by the
household sector to increase saving.
Suppose there are three countries in the world. Country A exports $11 million worth of goods to country B
and $5 million worth of goods to country C; country
B exports $3 million worth of goods to country A and
$6 million worth of goods to country C; and country
C exports $4 million worth of goods to country A and
$1 million worth of goods to country B.
a. What are the net exports of countries A, B, and C?
b. Which country is running a trade deficit? A trade
surplus?
The chapter provides data indicating that there are
many more sole proprietorships than corporations or
partnerships. Why are there so many sole proprietorships? Why is the revenue of the average sole proprietorship less than that of the typical corporation?
10. Using the circular flow diagram, illustrate the effects of
an increase in taxes imposed on the household sector.
One of the most important questions posed in Chapter 9 is “What does government do?” Use the Internet to explore an array of government agencies and their
roles and missions.
Go to the Boyes/Melvin Fundamentals of Economics website accessible through
and click on the Internet Exercise link
for Chapter 9. Now answer the questions found on the Boyes/Melvin website.
200
Part Three / The National and Global Economies
Study Guide for Chapter 9
Key Term Match
Quick-Check Quiz
Match each key term with its correct definition by
placing the appropriate letter next to the corresponding numbers.
1
Householders
the largest median annual income.
■ a. 15 to 24
■ b. 25 to 34
■ c. 45 to 54
■ d. 55 to 64
■ e. over 64
2
Household
A.
B.
C.
D.
E.
F.
G.
H.
I.
J.
household
consumption
multinational business
investment
imports
exports
trade surplus
trade deficit
net exports
monetary policy
K.
L.
M.
N.
O.
P.
Q.
R.
Federal Reserve
fiscal policy
transfer payments
budget surplus
budget deficit
private sector
public sector
circular flow
diagram
1. spending on capital goods to be used in producing goods and services
2. products that a country buys from other
countries
3. the shortage that results when government spending is greater than revenue
4. the situation that exists when imports exceed
exports
5. policy directed toward government spending and
taxation
6. a firm that owns and operates producing units in
foreign countries
7. the excess that results when government spending is less than revenue
8. the situation that exists when imports are less
than exports
9. income transferred from one citizen who is
earning income to another citizen who may
not be
10. the difference between the value of exports and
the value of imports
11. a model showing the flow of output and income
from one sector of the economy to another
12. one or more persons who occupy a unit of
housing
13. households, businesses, and the international
sector
14. household spending
15. the central bank of the United States
16. the government
17. products that a country sells to other countries
18. policy directed toward the control of money and
credit
spending,
or
years old have
consumption,
is
the
component of total spending
in the economy.
■ a. largest
■ b. second largest
■ c. third largest
■ d. fourth largest
■ e. smallest
3
Which of the following is not a component of household spending?
■ a. capital goods
■ b. housing
■ c. transportation
■ d. food
■ e. entertainment
4
In
the owner(s) of the business is (are) responsible for all the debts incurred by
the business and may have to pay those debts from
his/her (their) personal wealth.
■ a. a sole proprietorship
■ b. a partnership
■ c. a corporation
■ d. sole proprietorships and partnerships
■ e. sole proprietorships, partnerships, and corporations
5
are the most common form
of business organization, but
account for the largest share of total revenues.
■ a. Sole proprietorships; partnerships
■ b. Sole proprietorships; corporations
■ c. Partnerships; corporations
■ d. Corporations; sole proprietorships
■ e. Partnerships; sole proprietorships
6
U.S. trade is concentrated with
■ a. major industrial powers.
■ b. developing countries.
Chapter 9 / An Overview of the National and International Economies
201
■ c. Canada and Mexico.
■ d. oil exporters.
■ e. a and c.
7
8
Low-income countries are concentrated heavily in
■ a. Central America.
■ b. South America.
■ c. North America.
■ d. Africa.
■ e. Western Europe.
account for the largest percentage of business revenue.
4
The
is an international organization that makes loans to developing countries.
5
6
7
.
net exports signal a
The World Bank groups countries according to
.
Which of the following is a macroeconomic function
of government?
■ a. provision of military protection
■ b. promotion of competition
■ c. determining the level of government spending
and taxation
■ d. provision of police protection
■ e. correction of pollution problems
10 The
net exports signal a trade
surplus;
trade deficit.
but
smaller than
■ a. consumption; net exports
■ b. consumption; investment
■ c. net exports; investment
■ d. investment; net exports
■ e. investment; consumption
equal exports minus imports.
Combined government spending on goods and services is larger than
9
3
8
List three microeconomic functions of government.
9
What is the purpose of the circular flow diagram?
10 The circular flow diagram shows that the value of
is (are) responsible for
fiscal policy, and the
responsible for monetary policy.
■ a. Federal Reserve; Congress
■ b. Federal Reserve; Congress and the
president
■ c. Congress; Federal Reserve
■ d. Congress and the president; Federal
Reserve
■ e. Congress; Federal Reserve and the
president
is equal to income.
is (are)
Exercises and Applications
The Circular Flow Diagram Use the following diagram to see if you understand how the three sectors of the
economy are linked together. In the blanks below and on
the following page, fill in the appropriate labels. Money
flows are represented by gold and orange lines. Flows of
physical goods and services are represented by blue and
purple lines.
a.
Practice Questions and Problems
b.
1
The largest component of total spending in the econ-
c.
omy is
d.
2
202
spending.
is the expenditure by business firms for capital goods.
e.
f.
Part Three / The National and Global Economies
Financial
Intermediaries
a
b
c
d
e
Households
f
i
j
Government
Firms
g
k
h
l
m
n
o
Foreign Countries
p
g.
o.
h.
p.
i.
j.
l.
m.
n.
✸
ACE s
k.
-test
elf
✔
Chapter 9 / An Overview of the National and International Economies
Now that you’ve completed the Study Guide for this
chapter, you should have a good sense of the concepts
you need to review. If you’d like to test your understanding of the material again, go to the Practice Tests
on the Boyes/Melvin Fundamentals of Economics, 4e
website, />
203
Chapter 10
?
Fundamental
Questions
1. How is the total
output of an
economy measured?
2. What is the
difference between
nominal and real
GDP?
3. What is the purpose
of a price index?
4. How is money traded
internationally?
5. How do nations
record their
transactions with the
rest of the world?
Macroeconomic Measures
J
ust as we use degrees of temperature on a thermometer as a measure of a person’s health, we
must use economic data to analyze the health
of an economy. Since we prefer more goods and services to less, we need a good
way to measure how much is produced to see if the economy is providing more
goods and services over time and, if so, how much more. Since we like prices to
rise slower rather than faster, we need a good way to monitor how prices change in
the economy. Since we trade goods, services, and money with the rest of the world,
we need good measures of how much is traded and what things cost. In this chapter, we will learn how economists measure things like output and inflation. We will
also find out how trade with the rest of the world is counted. This will allow a solid
foundation on which future chapters will build as we use this information in further
analysis of business conditions both at home and abroad. ■
Preview
1. MEASURES OF OUTPUT AND INCOME
national income accounting:
the framework that
summarizes and categorizes
productive activity in an
economy over a specific
period of time, typically a year
?
1. How is the total
output of an economy
measured?
204
In this chapter we discuss gross domestic product, real GDP, and other measures of
national productive activity by making use of the national income accounting system used by all countries. National income accounting provides a framework for
discussing macroeconomics. It measures the output of an entire economy as well as
the flows between sectors. It summarizes the level of production in an economy
over a specific period of time, typically a year. In practice, the process estimates the
amount of activity that occurs. It is beyond the capability of government officials to
count every transaction that takes place in a modern economy. Still, national
income accounting generates useful and fairly accurate measures of economic activity in most countries, especially wealthy industrial countries that have comprehensive accounting systems.
1.a. Gross Domestic Product
Modern economies produce an amazing variety of goods and services. To measure
an economy’s total production, economists combine the quantities of oranges, golf
balls, automobiles, and all the other goods and services produced into a single measure of output. Of course, simply adding up the number of things produced—the
number of oranges, golf balls, and automobiles—does not reveal the value of what
is being produced. If a nation produces 1 million more oranges and 1 million fewer
Part Three / The National and Global Economies
The Value of Homemaker Services
O
ne way GDP underestimates
the total value of a nation’s
output is by failing to record
nonmarket production. A prime example is the work homemakers do.
Of course, people are not paid for
their work around the house, so it is
difficult to measure the value of
their output. But notice that we say
difficult, not impossible. Economists
can use several methods to assign
value to homemaker services.
One is an opportunity cost approach. This approach measures the
value of a homemaker’s services by
the forgone market salary the home-
gross domestic product
(GDP): the market value of
all final goods and services
produced in a year within a
country
maker could have earned if he or
she worked full-time outside the
home. The rationale is that society
loses the output the homemaker
would have produced in the market
job in order to gain the output the
homemaker produces in the home.
Another alternative is to estimate
what it would cost to hire workers to
produce the goods and services that
the homemaker produces. For example, what would it cost to hire
someone to prepare meals, iron,
clean, and take care of the household? It has been estimated that the
average homemaker spends almost
Economic Insight
8 hours a day, 7 days a week, on
household work. This amounts to
over 50 hours a week. At a rate of
$10 an hour, the value of the homemaker’s services is over $500 a
week.
Whichever method we use, two
things are clear. The value of homemaker services to the household
and the economy is substantial. And
by failing to account for those services, the GDP substantially underestimates the value of the nation’s
output.
automobiles this year than it did last year, the total number of things produced remains the same. But because automobiles are much more valuable than oranges, the
value of output has dropped substantially. Prices reflect the value of goods and services in the market, so economists use the money value of things to create a measure
of total output, a measure that is more meaningful than the sum of units produced.
The most common measure of a nation’s output is gross domestic product.
Gross domestic product (GDP) is the market value of all final goods and services
produced in a year within a country’s borders. A closer look at three parts of this
definition—market value, final goods and services, and produced in a year—will
make clear what the GDP does and does not include.
Market Value The market value of final goods and services is their value at market price. The process of determining market value is straightforward when prices
are known and transactions are observable. However, there are cases when prices
are not known and transactions are not observable. For instance, illegal drug transactions are not reported to the government; this means they are not included in
GDP statistics. In fact, almost any activity that is not traded in a market is not
included. For example, production that takes place in households, such as homemakers’ services (as discussed in the Economic Insight “The Value of Homemaker
Services”), is not counted, nor are unreported barter and cash transactions. For instance, if a lawyer has a sick dog and a veterinarian needs some legal advice, by
trading services and not reporting the activity to the tax authorities, each can avoid
taxation on the income that would have been reported had they sold their services
to each other. If the value of a transaction is not recorded as taxable income, it generally does not appear in the GDP. There are some exceptions, however. Contributions toward GDP are estimated for in-kind wages, nonmonetary compensation like
room and board. Values of GDP also are assigned to the output consumed by a producer, for example, the home consumption of crops by a farmer.
Final Goods and Services The second part of the definition of GDP limits the
measure to final goods and services, the goods and services available to the ultimate
consumer. This limitation avoids double counting. Suppose a retail store sells a shirt
to a consumer for $20. The value of the shirt in the GDP is $20. But the shirt is made
of cotton that has been grown by a farmer, woven at a mill, and cut and sewn by a
Chapter 10 / Macroeconomic Measures
205
Figure 1
intermediate goods: goods
that are used as inputs in the
production of final goods and
services
value added: the difference
between the value of the
output and the value of the
intermediate goods used in
the production of that output
206
20
Value of Output (dollars)
A cotton farmer sells cotton
to a textile mill for $1, adding
$1 to the value of the final
shirt. The textile mill sells
cloth to a shirt manufacturer
for $5, adding $4 to the value
of the final shirt. The manufacturer sells the shirt wholesale to the retail store for $12,
adding $7 to the value of the
final shirt. The retail store
sells the final shirt to a consumer for $20, adding $8 to
the value of the final shirt.
The sum of the prices received at each stage of production equals $38, which is
greater than the price of the
final shirt. The sum of the
value added at each stage of
production equals $20, which
equals the market value of
the shirt.
Final Good
Retail Shirt
Intermediate Goods
$8
Wholesale
Shirt
12
$7
7
Cloth
5
$4
1
0
Sum = $38
$38
8
4
Cotton
$1
Cotton
Farmer
Value Added (dollars)
Stages of Production and
Value Added in Shirt
Manufacturing
1
Textile
Mill
Shirt
Manufacturer
Retail
Store
$20
$20 = Sum
manufacturer. What would happen if we counted the value of the shirt at each of these
stages of the production process? We would overstate the market value of the shirt.
Intermediate goods are goods that are used in the production of a final product.
For instance, the ingredients for a meal are intermediate goods to a restaurant. Similarly, the cotton and the cloth are intermediate goods in the production of the shirt.
The stages of production of the $20 shirt are shown in Figure 1. The value-of-output
axis measures the value of the product at each stage. The cotton produced by the
farmer sells for $1. The cloth woven by the textile mill sells for $5. The shirt manufacturer sells the shirt wholesale to the retail store for $12. The retail store sells the
shirt—the final good—to the ultimate consumer for $20.
Remember that GDP is based on the market value of final goods and services. In
our example, the market value of the shirt is $20. That price already includes the
value of the intermediate goods that were used to produce the shirt. If we add to it
the value of output at every stage of production, we would be counting the value of
the intermediate goods twice, and we would be overstating the GDP.
It is possible to compute GDP by computing the value added at each stage of
production. Value added is the difference between the value of the output and the
value of the intermediate goods used in the production of that output. In Figure 1,
the value added by each stage of production is listed at the right. The farmer adds
$1 to the value of the shirt. The mill takes the cotton worth $1 and produces cloth
worth $5, adding $4 to the value of the shirt. The manufacturer uses $5 worth of
cloth to produce a shirt it sells for $12, so the manufacturer adds $7 to the shirt’s
value. Finally, the retail store adds $8 to the value of the shirt: it pays the manufacturer $12 for the shirt and sells it to the consumer for $20. The sum of the value
added at each stage of production is $20. The total value added, then, is equal to the
market value of the final product.
Part Three / The National and Global Economies
Economists can compute GDP using two methods: the final goods and services
method uses the market value of the final good or service; the value-added method
uses the value added at each stage of production. Both methods count the value of
intermediate goods only once. This is an important distinction: GDP is based not
on the market value of all goods and services but on the market value of all final
goods and services.
inventory: the stock of unsold
goods held by a firm
Produced in a Year The GDP measures the value of output produced in a year.
The value of goods produced last year is counted in last year’s GDP; the value of
goods produced this year is counted in this year’s GDP. The year of production, not
the year of sale, determines allocation to GDP. Although the value of last year’s
goods is not counted in this year’s GDP, the value of services involved in the sale
is. This year’s GDP does not include the value of a house built last year, but it does
include the value of the real estate broker’s fee; it does not include the value of a
used car, but it does include the income earned by the used-car dealer in the sale of
that car.
To determine the value of goods produced in a year but not sold in that year,
economists calculate changes in inventory. Inventory is a firm’s stock of unsold
goods. If a shirt that is produced this year remains on the retail store’s shelf at the
end of the year, it increases the value of the store’s inventory. A $20 shirt increases
that value by $20. Changes in inventory allow economists to count goods in the
year in which they are produced whether or not they are sold.
Changes in inventory can be planned or unplanned. A store may want a cushion
above expected sales (planned inventory changes), or it may not be able to sell all
the goods it expected to sell when it placed the order (unplanned inventory
changes). For instance, suppose Jeremy owns a surfboard shop, and he always
wants to keep 10 surfboards above what he expects to sell. This is done so that in
case business is surprisingly good, he does not have to turn away customers to his
competitors and lose those sales. At the beginning of the year, Jeremy has 10 surfboards and then builds as many new boards during the year as he expects to sell.
Jeremy plans on having an inventory at the end of the year of 10 surfboards. Suppose Jeremy expects to sell 100 surfboards during the year, so he builds 100 new
boards. If business is surprisingly poor so that Jeremy sells only 80 surfboards,
how do we count the 20 new boards that he made but did not sell? We count the
change in his inventory. He started the year with 10 surfboards and ends the year
with 20 more unsold boards for a year-end inventory of 30. The change in inventory of 20 (equal to the ending inventory of 30 minus the starting inventory of 10)
represents output that is counted in GDP. In Jeremy’s case, the inventory change is
unplanned since he expected to sell the 20 extra surfboards that he has in his shop
at the end of the year. But whether the inventory change is planned or unplanned,
changes in inventory will count output that is produced but not sold in a given year.
1.a.1. GDP as Output The GDP is a measure of the market value of a nation’s
total output in a year. Remember that economists divide the economy into four sectors: households, businesses, government, and the international sector. The total
value of economic activity equals the sum of the output produced in each sector.
Since GDP counts the output produced in the United States, U.S. GDP is produced
in business firms, households, and government located within the boundaries of the
United States. Not unexpectedly in a capitalist country, privately owned businesses
account for the largest percentage of output: in the United States, 77 percent of the
GDP is produced by private firms. Government produces 11 percent of the GDP,
and households 12 percent.
In terms of output, GDP is the value of final goods and services produced by domestic households, businesses, and government units. If some of the firms producing in the United States are foreign owned, their output produced in the United
States is counted in U.S. GDP.
Chapter 10 / Macroeconomic Measures
207
1.a.2. GDP as Expenditures Here we look at GDP in terms of what each sector pays for goods and services it purchases. The dollar value of total expenditures—
the sum of the amount each sector spends on final goods and services—equals the
dollar value of output. Household spending is called consumption. Households
spend income on goods and services to be consumed. Business spending is called
investment. Investment is spending on capital goods that will be used to produce
other goods and services. The two other components of total spending are government spending and net exports. Net exports are the value of exports (goods and services sold to the rest of the world) minus the value of imports (goods and services
bought from the rest of the world).
GDP ϭ consumption ϩ investment ϩ government spending ϩ net exports
Or, in the shorter form commonly used by economists,
GDP ϭ C ϩ I ϩ G ϩ X
GDP ϭ C ϩ I ϩ G ϩ X
where X is net exports.
Consumption, or household spending, accounts for 70 percent of national expenditures. Government spending represents 19 percent of expenditures, and business investment 16 percent. Net exports are negative (Ϫ5 percent); this means that imports exceed exports. To determine total national expenditures on domestic output,
the value of imports, spending on foreign output, is subtracted from total
expenditures.
capital consumption
allowance: the estimated
value of depreciation plus the
value of accidental damage to
capital stock
depreciation: a reduction
in value of capital goods
over time due to their use
in production
208
1.a.3. GDP as Income The total value of output can be calculated by adding up
the expenditures of each sector. And because one sector’s expenditures are another’s income, the total value of output also can be computed by adding up the income of all sectors.
Business firms use factors of production to produce goods and services. The
income earned by factors of production is classified as wages, interest, rent, and
profits. Wages are payments to labor, including fringe benefits, social security contributions, and retirement payments. Interest is the net interest paid by businesses
to households plus the net interest received from foreigners (the interest they pay us
minus the interest we pay them). Rent is income earned from selling the use of real
property (houses, shops, farms). Finally, profits are the sum of corporate profits
plus proprietors’ income (income from sole proprietorships and partnerships).
In terms of income, wages account for 57 percent of the GDP. Interest and profits account for 5 percent and 8 percent of the GDP, respectively. Proprietors’
income accounts for 8 percent. Rent (1 percent) is very small in comparison. Net
factor income from abroad is income received from U.S.-owned resources located
in other countries minus income paid to foreign-owned resources located in the
United States. Since U.S. GDP refers only to income earned within U.S. borders,
we must deduct this kind of income to arrive at GDP (Ϫ0.4 percent).
The GDP also includes two income categories that we have not discussed: capital consumption allowance and indirect business taxes. Capital consumption allowance is not a money payment to a factor of production; it is the estimated value
of capital goods used up or worn out in production plus the value of accidental
damage to capital goods. The value of accidental damage is relatively small, so it is
common to hear economists refer to capital consumption allowance as depreciation. Machines and other capital goods wear out over time. The reduction in the
value of capital stock due to its being used up or worn out over time is called depreciation. A depreciating capital good loses value each year of its useful life until
its value is zero.
Even though capital consumption allowance does not represent income received
by a factor of production, it must be accounted for in GDP as income. Otherwise
the value of GDP measured as output would be higher than the value of GDP
Part Three / The National and Global Economies