Lecture Macroeconomics (19/e) - Chapter 18: Extending the analysis of aggregate supply
Bạn đang xem bản rút gọn của tài liệu. Xem và tải ngay bản đầy đủ của tài liệu tại đây (332.29 KB, 16 trang )
18
Extending the Analysis of Aggregate Supply
McGrawHill/Irwin
Copyright © 2012 by The McGrawHill Companies, Inc. All rights reserved.
From Short Run to Long Run
• Short run
• Input prices inflexible
• Upsloping aggregate supply
• Long run
• Input prices fully flexible
• Vertical aggregate supply
• The transition?
LO1
18-2
From Short Run to Long Run
• Production above potential output:
• High demand for inputs
• Input prices rise
• Short run aggregate supply shifts
•
•
LO1
left
• Return to potential output
Production below potential output
Graphical examples…
18-3
From Short Run to Long Run
Short-Run
Aggregate Supply
Long-Run
Aggregate Supply
a2
P2
a1
P1
P3
a3
Q3
Qf
Q2
AS2
a2
b1
P2
AS1
AS3
a1
P1
P3
Real Domestic Output
LO1
ASLR
Price Level
Price Level
AS1
a3
c1
Qf
Real Domestic Output
18-4
From Short Run to Long Run
Long Run Equilibrium
Price Level
ASLR
AS1
a
P1
AD1
Qf
Real Domestic Output
LO1
18-5
Extended ADAS Model
Demand-Pull Inflation
Price Level
ASLR
P3
AS1
c
b
P2
P1
AS2
a
AD2
AD1
Qf Q 2
Real Domestic Output
LO2
18-6
Extended ADAS Model
Cost-Push Inflation
Price Level
ASLR
AS1
c
P3
P2
AS2
b
a
P1
AD2
AD1
Q2 Qf
Real Domestic Output
LO2
18-7
Extended ADAS Model
Recession
Price Level
ASLR
P3
AS2
a
P1
P2
AS1
b
c
AD1
AD2
Q1 Qf
Real Domestic Output
LO2
18-8
Extended ADAS Model
• Explaining ongoing inflation
• Ongoing economic growth shifts
•
LO2
aggregate supply
• Ongoing increases in money supply
shift aggregate demand
Small positive rate of inflation
18-9
Economic Growth, Ongoing Inflation
Consumer Goods
Increase in production
possibilities
LO2
Long Run
Aggregate Supply
Price Level
Capital Goods
Productions
Possibilities
Real GDP
Increase in long-run
aggregate supply
18-10
Inflation and Unemployment
• Low inflation and unemployment
• Fed’s major goals
• Compatible or conflicting?
• Short-run tradeoff
• Supply shocks cause both rates to
•
LO3
rise
No long-run tradeoff
18-11
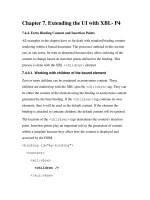
The Phillips Curve
• 1960s economists believed in stable,
•
•
•
LO3
predictable tradeoff
Phillips curve shifts over time
Adverse supply shocks 1970s
• OPEC oil price shock
• Stagflation
Stagflation’s demise 1980s
18-12
The Phillips Curve
• No long-run tradeoff between inflation
and unemployment
• Short-run Phillips curve
• Role of expected inflation
• Long-run vertical Phillips curve
• Disinflation
LO4
18-13
The Phillips Curve
Annual rate of inflation (percent)
14
13
12
11
10
9
8
7
6
5
4
3
2
1
Unemployment rate (percent)
LO4
18-14
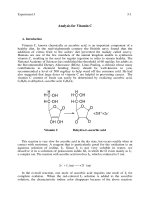
Taxes and Aggregate Supply
• Supply-side economics
• Tax incentives to work
• Tax incentives to save and invest
• The Laffer curve
Tax Rate (Percent)
100
n
m
LO5
m
l
0
Laffer Curve
Maximum
Tax Revenue
Tax Revenue (Dollars)
18-15
Taxes and Aggregate Supply
• Criticisms of the Laffer curve
• Taxes, incentives, and time
• Inflation and higher real interest
•
LO5
rates
• Position on the curve
Rebuttal and evaluation
18-16