Lecture Macroeconomics - Chapter 16: Economic growth and the new economy
Bạn đang xem bản rút gọn của tài liệu. Xem và tải ngay bản đầy đủ của tài liệu tại đây (235.19 KB, 37 trang )
ECONOMIC
GROWTH
&
THE NEW
ECONOMY
Chapter 16
SLIDES PREPARED BY JUDITH SKUCE, GEORGIAN COLLEGE
© 2002 McGraw-Hill Ryerson Ltd.
Macroeconomics, Chapter 16
1
In this chapter you will learn
About the ingredients of economic
growth
About production possibility analysis
About Canada’s economic growth rates
About productivity growth and the new
economy
© 2002 McGraw-Hill Ryerson Ltd.
Macroeconomics, Chapter 16
2
Chapter 16 Topics
Ingredients of Growth
Production Possibilities Analysis
Canadian Economic Growth Rates
Accounting for Growth
Productivity Growth & the New
Economy
Is Growth Desirable & Sustainable?
© 2002 McGraw-Hill Ryerson Ltd.
Macroeconomics, Chapter 16
3
Ingredients of Growth
Supply Factors
• natural resources
© 2002 McGraw-Hill Ryerson Ltd.
Macroeconomics, Chapter 16
4
Ingredients of Growth
Supply Factors
• natural resources
• human resources
© 2002 McGraw-Hill Ryerson Ltd.
Macroeconomics, Chapter 16
5
Ingredients of Growth
Supply Factors
•
•
•
natural resources
human resources
capital goods
© 2002 McGraw-Hill Ryerson Ltd.
Macroeconomics, Chapter 16
6
Ingredients of Growth
Supply Factors
•
•
•
•
natural resources
human resources
capital goods
technology
© 2002 McGraw-Hill Ryerson Ltd.
Macroeconomics, Chapter 16
7
Ingredients of Growth
Supply Factors
•
•
•
•
natural resources
human resources
capital goods
technology
Demand Factor
• households & businesses must purchase the
economy’s output
Efficiency Factor
• economic efficiency & full employment
© 2002 McGraw-Hill Ryerson Ltd.
Macroeconomics, Chapter 16
8
Chapter 16 Topics
Ingredients of Growth
Production Possibilities Analysis
Canadian Economic Growth Rates
Accounting for Growth
Productivity Growth & the New
Economy
Is Growth Desirable & Sustainable?
© 2002 McGraw-Hill Ryerson Ltd.
Macroeconomics, Chapter 16
9
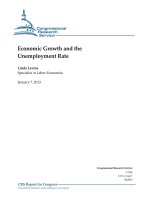
Production Possibilities Analysis
Growth & Production Possibilities
Capital goods
Figure 16-1
C
A
b
Economic
growth
a
B
D
Consumer goods
© 2002 McGraw-Hill Ryerson Ltd.
Macroeconomics, Chapter 16
10
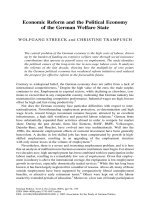
Production Possibilities Analysis
Figure 16-2
Labour & Productivity
size of
of employed
employed
••size
labour force
force
labour
average hours
hours
••average
of work
work
of
labour
labour force participation
inputs
rate
(hours
of work)
X
technological
••technological
advance
advance
quantity of
of
••quantity
capital
capital
education &
&
••education
training
training
allocative
••allocative
efficiency
efficiency
other
••other
labour
productivity
(average
output per
hour)
© 2002 McGraw-Hill Ryerson Ltd.
=
Real
Real
GDP
GDP
Macroeconomics, Chapter 16
11
Production Possibilities Analysis
Growth in the AD-AS Model
C
A
ASLR1 ASLR2
Price level
Capital goods
Figure 16-3
B
D
Consumer goods
© 2002 McGraw-Hill Ryerson Ltd.
Q1 Q2
Real GDP
Macroeconomics, Chapter 16
12
Long-Run AD - AS Model
Figure 16-4
Price Level
ASLR1
Figure 16-4
Long-run &
short-run AS
increase over
time
AS1
P1
AD1
o
Q1
© 2002 McGraw-Hill Ryerson Ltd.
Real GDP
Macroeconomics, Chapter 16
13
Long-Run AD - AS Model
Figure 16-4
ASLR1
Figure 16-4
ASLR2
Price Level
AS2
AS1
Size of AD
shift
determines
inflation
P1
AD1
o
Q1
© 2002 McGraw-Hill Ryerson Ltd.
Q2
Real GDP
Macroeconomics, Chapter 16
14
Long-Run AD - AS Model
Figure 16-4
ASLR1
Figure 16-4
ASLR2
Price Level
AS2
AS1
P2
P1
AD2
AD1
o
Q1
© 2002 McGraw-Hill Ryerson Ltd.
Q2
Real GDP
Macroeconomics, Chapter 16
15
Chapter 16 Topics
Ingredients of Growth
Production Possibilities Analysis
Canadian Economic Growth Rates
Accounting for Growth
Productivity Growth & the New
Economy
Is Growth Desirable & Sustainable?
© 2002 McGraw-Hill Ryerson Ltd.
Macroeconomics, Chapter 16
16
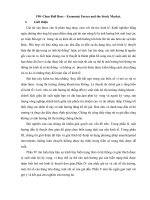
Canadian Economic Growth
Rates
Real GDP in the last half
century has increased over
sixfold
Growth particularly strong in
the 1960s, but declined
during the 1970s & 1980s
© 2002 McGraw-Hill Ryerson Ltd.
Macroeconomics, Chapter 16
17
Table 16-1
Year
GDP ($ billions,
1992)
Population
(millions)
Per capita GDP
1926
56.8
9.5
5,979
1929
68.1
10.0
6,810
1933
47.6
10.6
4,491
1939
71.7
11.0
6,518
1942
110.9
11.5
9,643
1946
114.1
12.3
9,276
1951
143.0
14.0
10,214
1956
192.0
16.1
11,925
1961
220.8
18.2
12,132
1966
299.7
20.0
14,985
1971
370.9
21.6
17,171
1976
470.3
23.0
20,448
1981
551.3
24.3
22,687
1986
628.6
25.4
24,748
692.2
© 20021991
McGraw-Hill Ryerson
Ltd.
27.0
25,637 16
Macroeconomics,
Chapter
18
Chapter 16 Topics
Ingredients of Growth
Production Possibilities Analysis
Canadian Economic Growth Rates
Accounting for Growth
Productivity Growth & the New
Economy
Is Growth Desirable & Sustainable?
© 2002 McGraw-Hill Ryerson Ltd.
Macroeconomics, Chapter 16
19
Accounting for Growth
Post-1950 productivity growth greater
than can be attributed to increases in
labour & capital
• total factor productivity (TFP) has
increased
© 2002 McGraw-Hill Ryerson Ltd.
Macroeconomics, Chapter 16
20
Accounting for Growth
Inputs Versus Productivity
• productivity growth has been a significant
force in the growth of real GDP
• productivity growth slowed from the mid1970s to early 1990s
© 2002 McGraw-Hill Ryerson Ltd.
Macroeconomics, Chapter 16
21
Accounting for Growth
Quantity of Labour
• both population & labour force have
increased
© 2002 McGraw-Hill Ryerson Ltd.
Macroeconomics, Chapter 16
22
Accounting for Growth
Technological Advance
• process innovation
• product innovation
© 2002 McGraw-Hill Ryerson Ltd.
Macroeconomics, Chapter 16
23
Accounting for Growth
Quantity of Capital
• almost 45% of the annual growth of real
output since 1961 is attributable to
increases in the quantity of capital
• public investment in infrastructure also
important
© 2002 McGraw-Hill Ryerson Ltd.
Macroeconomics, Chapter 16
24
Accounting for Growth
Education & Training
• educational attainment has increased
• concerns about quality
© 2002 McGraw-Hill Ryerson Ltd.
Macroeconomics, Chapter 16
25