Ebook Cost accounting - Foundations and evolutions (8th edition): Part 2
Bạn đang xem bản rút gọn của tài liệu. Xem và tải ngay bản đầy đủ của tài liệu tại đây (15.37 MB, 419 trang )
11
Allocation of Joint Costs and
Accounting for By-Product/Scrap
Objectives
After completing this chapter, you should be able to answer the following questions:
LO.1
LO.2
PANCAKETOM/DREAMSTIME.COM
LO.3
LO.4
LO.5
How are the outputs of a joint process classified?
What management decisions must be made before beginning a joint
process?
How is the joint cost of production allocated to joint products?
How are by-product and scrap accounted for?
How should not-for-profit organizations account for the cost of a joint
activity?
475
476
Chapter 11 Allocation of Joint Costs and Accounting for By-Product/Scrap
Introduction
Most companies produce and sell multiple products. Some companies engage in multiple
production processes to manufacture a variety of products; other companies have a single
process that simultaneously generates different outputs. For example, a chicken processing
plant generates whole chickens, chicken parts, ground chicken, and fertilizer from a single
input. Similarly, crude oil refining can produce gasoline, motor oil, heating oil, and kerosene; mining can produce copper, silver, and gold.
A joint process is one during which one product cannot be manufactured without
producing others. Such processes are common in the food, extractive, agricultural, and
chemical industries. Additionally, the process of producing first-quality merchandise and
factory seconds in a single operation can be viewed as a joint process. For example, if a
manufacturing process is unstable in that it cannot “maintain output at a uniform quality
level, [then] . . . the products that emerge from the [process] vary across one or more quality
dimensions.”1
This chapter discusses joint manufacturing processes, their related product outputs, and
the accounting treatment of the costs of those processes. Costs incurred for material, labor,
and overhead during a joint process are referred to as the joint cost of the production
process. Joint cost is allocated only to the primary products of a joint process using either
a physical or a monetary measure. Although joint cost allocations are necessary to determine financial statement valuations, such allocations should not be used in making internal
decisions.2 For example, in evaluating a specific joint product’s profitability, the decision
maker must understand that the product’s profitability is determined largely by the method
used to allocate the joint cost and that allocation process is always arbitrary to some extent.
Following incurrence of the joint cost, additional separate costs that are assignable to specific products may be incurred in later production stages.
In addition, advertising and marketing expenditures can be joint costs. For example,
a not-for-profit (NFP) organization could produce a brochure that serves the concurrent
purposes of providing public service information and requesting donations. Joint costs for
NFPs are covered in the last section of the chapter.
LO.1 How are the outputs
of a joint process classified?
Outputs of a Joint Process
A joint process inevitably produces more than one product line. A product that results from
a joint process and that has a sales value is classified as
• a joint product (also called a primary product, main product, or co-product),
• a by-product, or
• scrap.
Joint products are the primary outputs of a joint process. Joint products have substantial revenue-generating ability and, as such, provide the financial motive for entering into
the production process. Joint products include similar products of differing quality that
result from the same process. For example, a poultry processor generates different grades
of turkeys, and, depending on certain characteristics defined by the U.S. Department of
Agriculture, ready-to-cook poultry is graded as A, B, or C quality.
In contrast, by-product and scrap are incidental outputs of a joint process. Both are
salable, with by-products having a higher sales value than scrap. However, the sales values
of these products alone would not be sufficient for management to undertake the joint
1
James F. Gatti and D. Jacque Grinnell, “Joint Cost Allocations: Measuring and Promoting Productivity and Quality Improvements,”
Cost Management (July–August 2000), pp. 13–21.
2
Sometimes correctly pricing a product depends on knowledge of the full cost of making the product, particularly when contractual agreements require cost-plus pricing. Joint cost allocation is also necessary to the costing of products for financial reporting.
process. For example, Perdue Farms would never undertake poultry processing simply to generate the by-product that is made into
fertilizer or livestock feed. Krispy Kreme would never undertake
doughnut manufacturing to generate the doughnut holes sold to
customers. Weyerhaeuser would never undertake lumber production merely to generate the bark that is burned to produce power
and steam.
A final residual output from a joint process is waste, which has
no sales value. The expense incurred in waste disposal may exceed its
production costs in some industries. However, many companies have
learned either to minimize their production waste by changing their
processing techniques or to reclassify waste as by-product or scrap by
finding a use that generates some minimal amount of revenue.
Over time, a product classification may change because of
technology advances, consumer demand, or ecological factors. New
joint products may be developed from a product, as illustrated in
the ever-growing list for soybeans (Exhibit 11–1). Some products originally classified as
by-products can be reclassified as joint products, and some joint products can be reduced to
the by-product category. Even products originally viewed as scrap or waste can be upgraded
Exhibit 11–1 Products from Soybeans
Soy Foods
Nonedible Products
Animal feed
Adhesives
Butter
Biodiesel fuel
Cereals
Building materials
Chocolate coatings
Candles
Coffee
Cosmetics
Flour
Crayons
Milk and creamers
Disinfectants
Oil
Fiber (Yarn)
Sauce
Foam for furniture
Sausage casings
Electrical insulation
Salad dressing
Leather substitute
Tofu
Lubricants and hydraulic fluids
Paints and coatings
Pesticides and herbicides
Pharmaceuticals
Plastics
Printing inks
Road materials
Rubber
Shampoo and detergent
Solvents
477
JASON ALAN/ISTOCKPHOTO.COM
Chapter 11 Allocation of Joint Costs and Accounting for By-Product/Scrap
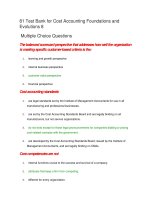
Instead of throwing away dayold bread or bagels, a bakery
may decide to use them to make
croutons, allowing what would have
been waste to be reclassified as a
by-product or scrap.
478
Chapter 11 Allocation of Joint Costs and Accounting for By-Product/Scrap
to joint product status. For example, years ago, poultry processors considered chicken litter,
bones, beaks, and feet to be waste. These items are now recycled and processed further to
produce valuable organic fertilizer and, therefore, may be classified as either by-product or
scrap. Furthermore, chicken litter can, when gasified, be used to produce electricity.
Joint process output is classified based on management’s judgment about the relative
sales values of outputs. Classifications are unique to each company. For example, assume
that Companies A and B are both poultry processors. Company A might classify whole
chickens and breast meat as joint products and all other chicken parts as by-product,
whereas Company B might classify whole chickens, thighs, legs, and wings as joint products and all other chicken parts as by-product. These classifications could be based on the
fact that Company A’s processing facilities are only large enough to clean the chickens and
remove the breast section; any additional processing would require a capital investment that
would not be cost beneficial. Company B could have significantly larger facilities that allow
further processing at costs substantially below the sales values of the multiple products.
The Joint Process
Joint products are typically manufactured in companies using mass production processes and
a process costing accounting method. Exhibit 11–2 shows that the outputs of steer processing include a wide variety of meat cuts for retail sales (joint products); fat, entrails, bones,
Exhibit 11–2 Illustration of Joint Process Output
615 lb.
Carcass
61.5%
of Live
Weight
432 lbs. Retail Beef
• Steaks
• Roasts
• Ground Beef
183 lbs
fat
bone
waste
27 lbs. variety meats
Beef By-Products 568 lbs.
358 lbs hide and
hair, bones, horns,
inedible glands
and organs
1000 lb. Steer
Beef By-Products and Scrap
Fats and Fatty
Acids
• Explosives
• Chewing gum
• Paints
• Dog food
• Tires
Intestines
• Sausage
casings
• Instrument
strings
• Surgical
sutures
• Tennis racquet
strings
Hide and Hair
• Clothing
• Saddles
• Insulation
• Luggage
• Artist’s
brushes
Bones, Horns,
and Hooves
• Combs &
toothbrushes
• Dog biscuits
• Piano keys
• Ice cream
• Shampoo &
conditioner
Source: (last accessed 10/15/09).
Manure
• Methane gas
• Urea fertilizer
Chapter 11 Allocation of Joint Costs and Accounting for By-Product/Scrap
479
horns, and hooves that are classified as by-product or scrap; and some nonusable waste that
is discarded.
The point at which joint process outputs are first identifiable as individual products is
called the split-off point. A joint process can have one or more split-off points, depending
on the number and types of output produced. Output may be sold at the split-off point (if
a market exists for products at that degree of completion) or may be processed further and
then sold.
Joint cost includes all direct material, direct labor, and overhead costs incurred up to
the split-off point. Financial reporting requires that all necessary and reasonable costs of
production be attached to products.
Joint Cost
Rationale
Allocated only to joint products
Necessary for financial statement valuations at
split-off point
Underlying financial motivation for undertaking
the production process
Not relevant for internal decision making
because, at split-off, joint cost is a sunk cost
Not allocated to “other” output
Not cost beneficial
Not significant to production process decision
If joint output is processed beyond the split-off point, additional costs will be incurred
and must be assigned to the specific products for which those costs were incurred.
Exhibit 11–3 (p. 480) illustrates a joint process with multiple split-off points and the
allocation of costs to products. For simplicity, the joint process shows no by-product
production. Some scrap and waste are produced from Joint Process 1 but no joint cost
is assigned to such output. Note that joint products B and C of Joint Process 1 become
direct material for Joint Process 2. For accounting purposes, the joint cost allocations
will follow products B and C into Joint Process 2, but these allocated costs should not be
used in making decisions about further processing in Departments 2, 3, or 4. Such decisions should be made only after considering whether the expected additional revenues
from further processing are greater than the expected additional costs.
The Joint Process Decision
Exhibit 11–4 (p. 481) indicates the four management decision points in a joint production
process. Before committing resources to a joint process, management must first decide
whether total expected revenue from selling the joint output “basket” of products is likely
to exceed total expected processing cost, which includes
• joint cost,
• separate processing costs after split-off,
• selling expenses for the goods, and
• disposal costs for any waste materials.
If total anticipated revenue exceeds all anticipated costs, managers should compare
the income from this use of company resources to that provided by the best alternative use. If the joint process income exceeds that of the best alternative, management
would decide that this production process is the best capacity use and would begin
production.
The next two decisions are made at split-off. The third decision is to determine
how to classify joint process outputs. This classification decision is necessary because
joint cost is assigned only to joint products. Prior to allocation, however, the joint cost
may be reduced by the sales value of any by-product or scrap (as discussed later in the
chapter).
LO.2 What management
decisions must be made
before beginning a joint
process?
480
Chapter 11 Allocation of Joint Costs and Accounting for By-Product/Scrap
Exhibit 11–3 Model of a Joint Process
Department 1
JOINT PROCESS 1
Incur DM, DL, and OH costs
for joint products.
WASTE
SCRAP
No joint cost allocated;
discarded with no sales
value and possible disposal
costs incurred
Split-off point; joint products A, B,
and C are produced. Allocate costs
of Joint Process 1 to joint products
A, B, and C.
Department 2
PRODUCT A PROCESSING
Product A is separately
processed further; additional
costs of DM, DL, and OH are
assignable only to Product A.
Product A is warehoused or sold.
No joint cost allocated;
minimal sales value.
Department 3
JOINT PROCESS 2
PRODUCTS B and C PROCESSING
Incur DM, DL, and OH costs
for joint products B and C.
Split-off point; allocate
costs of Joint Process 2
to joint products B and C.
Product B is warehoused or sold
at split-off point.
Department 4
PRODUCT C PROCESSING
Product C is separately
processed further; costs of
DM, DL, and OH are
totally assignable only to
Product C.
Product C is warehoused or sold.
The fourth decision is the most complex. Management must decide whether to sell
(any or all of ) the joint output at split-off or to process it further. If joint products are
salable at split-off, further processing should be undertaken only if the value added to
the product, as reflected by the incremental revenue, exceeds the incremental cost.3 If
a primary product is not salable at split-off, additional costs must be incurred to make
that product salable. For other output, management must also estimate whether the
3
See Chapter 10 for a detailed discussion of incremental and relevant costs.
Chapter 11 Allocation of Joint Costs and Accounting for By-Product/Scrap
481
Exhibit 11–4 Decision Points in a Joint Production Process
(1)
Revenues Ͼ
expenses for basket
of goods?
NO
Do not produce
YES
(2)
NO
Best use of
facilities?
Do not produce
YES
Begin production and incur costs
for material, labor, and overhead
SPLIT-OFF POINT
(3)
Joint Product?
NO
Are
added revenues
after additional
processing Ͼ
additional
costs?
YES
Allocate joint cost
Salable?
NO
YES
(4)
Incremental
profit after additional processing Ͼ
zero after
split-off?
YES
Incur additional costs
NO
Sell at split-off
Sell
NO
Sell at split-off
482
Chapter 11 Allocation of Joint Costs and Accounting for By-Product/Scrap
incremental revenue from additional processing will exceed the additional processing
cost. Nonprimary output should be processed further only if additional processing provides a net monetary benefit.
The following example illustrates a further processing decision. Assume that a whole
chicken sells for $0.96 per pound at split-off. The minimum selling price for edible chicken
parts after further processing is $1.06 per pound.
Incremental revenue ϭ $1.06 Ϫ $0.96 ϭ $0.10
If no weight is lost in additional processing and the cost is less than $0.10 per pound,
additional processing should occur. At the split-off point, the joint cost cannot be recouped
and, thus, is a “sunk” cost. The only relevant items in the decision to process further are the
incremental revenue and incremental cost.
In making decisions at any potential sales point, managers must have a reasonable estimate of each joint output’s selling price. Expected selling prices should be based on both
cost and market factors. In the long run, the product selling prices and volumes must be
sufficient to cover their total costs. However, current economic influences, such as competitors’ prices and consumers’ sensitivity to price changes, must be considered when estimating
selling prices and forecasting revenues.
LO.3 How is the joint cost
of production allocated to
joint products?
Allocation of Joint Cost
Harkins Poultry is used to demonstrate alternative methods of allocating joint processing cost. The company manufactures three primary products from a joint process:
turkey breasts, ground turkey, and whole turkeys. (All remaining parts are considered byproducts of the joint process.) Joint products can be either sold at split-off or processed
further at an additional cost. Breasts can be processed further to produce deli meats;
ground turkey can be processed further into turkey sausage; whole turkeys can be processed further to make precooked or marinated roasters. Certain marketing and disposal
costs for advertising, commissions, and transportation are incurred regardless of when
the products are sold.
Exhibit 11–5 provides assumed information on Harkins Poultry’s processing operations and joint products for October 2010. The company started processing 10,000 tons of
turkey during that month. Approximately 10 percent of the tonnage started will become
a by-product to be used in fertilizer pellets. Thus, the 10,000 tons of input results in 9,000
tons of joint product output and 1,000 tons of by-product.
Physical Measure Allocation
An easy, objective way to prorate joint cost at the split-off point is to use physical measure allocation or proration using a common physical characteristic of the joint products,
such as:
• tons of meat, bone, and hide in the meat packing or turkey processing industry,
• pounds of milk in the dairy industry,
• linear board feet in the lumber milling industry,
• barrels of oil in the petroleum refining industry, or
• number of computer chips in the semiconductor industry.
Physical measures provide an unchanging yardstick of output. Assuming that it is
agreed that the word ton means “short ton” or 2,000 pounds (rather than a “long ton”
or a “metric ton”), a ton of output produced from a process 10 years ago is the same
measurement as a ton produced from that process today. Physical measures are useful
Chapter 11 Allocation of Joint Costs and Accounting for By-Product/Scrap
483
Exhibit 11–5 Joint Cost Information for Harkins Poultry
Joint processing cost for period: $5,400,000
(1)
(2)
Tons
Produced
(3)
Sales Price
per Ton
at Split-Off
(4)
Marketing Cost per
Ton Regardless
of When Sold
(5)
Separate Cost
per Ton If
Processed Further
(6)
Final Sales
Price
per Ton
Joint
Product
Breast
3,800
$2,800
$200
$100
$3,200
Ground
2,400
1,800
100
100
2,100
Whole
2,800
1,200
50
60
1,500
Diagram of problem assuming products are sold at split-off
Joint
Processing
at a cost of
$5,400,000
for
10,000 tons
of output
Marketing
Costs
Sales
Price
Breast
3,800 tons
$200 per ton
Breast
$2,800 per ton
Ground
2,400 tons
$100 per ton
Ground
$1,800 per ton
Whole
2,800 tons
$50 per ton
Whole
$1,200 per ton
By-Product
1,000 tons
Split-off
point
in allocating joint cost to products that have highly variable selling prices. These
measures are also necessary in rate-regulated industries that use cost to determine
selling prices. For example, assume that a rate-regulated company has the right to set
the selling price of its product at 20 percent above cost. It would be circular logic to
allocate joint cost using selling prices that were set based on the cost to produce the
output.
Allocating joint cost based on a physical measure, however, ignores the revenuegenerating ability of individual joint products. Products that weigh the most or that are
produced in the largest quantity will receive the highest proportion of joint cost allocation—regardless of their ability to bear that cost when they are sold.
Using the physical measure allocation, Harkins Poultry’s $5,400,000 of joint cost is
assigned as shown in Exhibit 11–6 (p. 484). This allocation process treats each weight
unit of output as equally desirable and assigns each the same per-unit cost. For Harkins
Poultry, physical measure allocation assigns a cost of approximately $600 ($5,400,000
Ϭ 9,000 tons) per ton of turkey, regardless of type. However, the computations in
Exhibit 11–6 show that, by allocating the same amount of joint cost to each ton of
joint product, whole turkeys generate the lowest gross profit per ton of the three joint
products.
484
Chapter 11 Allocation of Joint Costs and Accounting for By-Product/Scrap
Exhibit 11–6 Harkins Poultry’s Joint Cost Allocation Based on Physical Measure
Cost per Physical Measure ϭ Total Joint Cost Ϭ Total Units of Physical Measurement
ϭ $5,400,000 Ϭ 9,000 tons ϭ $600 per ton
Joint
Tons
Cost
Total
Revenue
Cost
Gross Profit
Product Produced per Ton Allocated Cost at Split-Off at Split-Off at Split-Off
Breast
3,800
$600
$2,280,000
$2,800
$600
$2,200
Ground
2,400
600
1,440,000
1,800
600
1,200
Whole
2,800
600
1,680,000
1,200
600
600
Total
9,000
$5,400,000
The journal entries for incurring the joint processing cost, allocating it to the joint
products, and recognizing the separate processing cost (assuming that all joint products are
processed further) follow.
Work in Process Inventory—Turkey Processing
5,400,000
Various accounts
5,400,000
To record joint processing cost
Work in Process Inventory—Breast
2,280,000
Work in Process Inventory—Ground
1,440,000
Work in Process Inventory—Whole
1,680,000
Work in Process Inventory—Turkey Processing
5,400,000
To allocate joint processing cost
Work in Process Inventory—Breast (3,800 tons ϫ $100)
380,000
Work in Process Inventory—Ground (2,400 tons ϫ $100)
240,000
Work in Process Inventory—Whole (2,800 tons ϫ $60)
168,000
Various accounts
788,000
To record separate processing costs
Marketing costs are not recorded until the product is sold.
Monetary Measure Allocation
The primary benefit of monetary over physical measure allocations is that the former
recognizes the relative revenue generation of each product.4 A problem with monetary
measure allocations is that the basis used is dynamic. Because of fluctuations in general
and specific price levels, a dollar of output today is different from a dollar of output from
the same process five years ago. However, accountants customarily ignore price-level fluctuations when recording or processing data, so this particular flaw of monetary measures
is manageable.
All allocation methods employ a proration process. Because the physical measure
allocation process is so simplistic, a detailed proration scheme is unnecessary. However,
more complex monetary measure allocations use the following steps to prorate joint cost
to joint products:
1. Choose a monetary allocation base.
2. List each joint product’s base values.
4
Monetary measures are more reflective of the primary reason a joint process is undertaken: profit. Physical measure allocations
are sometimes of dubious value because they are based on the flawed assumption that all physical units are equally desirable.
Chapter 11 Allocation of Joint Costs and Accounting for By-Product/Scrap
3.
4.
485
Add the values in Step 2 to obtain total.
Divide each individual Step 2 value by the Step 3 total to obtain numerical proportions. These proportions should add to 100 percent.
Multiply the joint cost by each proportion to obtain the allocation for each
product.
Divide each product’s prorated joint cost by the number of product units to obtain a
cost per unit for valuation purposes.5
5.
6.
Many monetary measures can be used to allocate joint cost to primary output. The
three presented in this text are sales value at split-off, net realizable value at split-off, and
approximated net realizable value at split-off.
Sales Value at Split-Off
The sales value at split-off allocation method assigns joint cost to joint products based
on the relative split-off point sales values for the products. To use this method, all
joint products must be salable at split-off. Exhibit 11–7 presents Harkins Poultry’s
assignment of joint cost to production using the sales value at split-off method. This
allocation method uses a weighting technique based on both quantity produced and
selling price of production. The low selling price per ton of whole turkeys compared
to the selling prices of other joint products results in a lower allocated cost than was
obtained using physical measure allocation. The account titles for the entries to incur
joint cost, allocate it to the joint products, and recognize separate processing cost are
the same as those used earlier; however, the amounts allocated will be those shown in
Exhibit 11–7.
Exhibit 11–7 Harkins Poultry’s Joint Cost Allocation Based on Sales Value at Split-Off
Joint
Product
Tons
Produced
Selling
Price
Total
Revenue
Proportion
Joint
Cost
Amount
Allocated
Cost
per Ton
Breast
3,800
$2,800
$10,640,000
0.58a
$5,400,000
$3,132,000
$824.21
Ground
2,400
1,800
4,320,000
0.24b
5,400,000
1,296,000
540.00
3,360,000
0.18
c
5,400,000
972,000
347.14
$18,320,000
1.00
Whole
Total
2,800
1,200
9,000
Proportions ϭ Total Revenue of Respective Joint Product Ϭ Total Revenue
$10,640,000 Ϭ $18,320,000 ϭ 0.58 (rounded)
$4,320,000 Ϭ $18,320,000 ϭ 0.24 (rounded)
c
$3,360,000 Ϭ $18,320,000 ϭ 0.18 (rounded)
a
b
Net Realizable Value at Split-Off
The net realizable value at split-off allocation method assigns joint cost based on the
net realizable values of the joint products at the split-off point. Net realizable value
(NRV ) is equal to sales revenue at split-off minus preparation and disposal costs for
the product. This method requires that all joint products be salable at split-off and
considers the costs that must be incurred at split-off to realize the estimated sales revenue. The marketing costs (shown in the fourth column of Exhibit 11–5) for Harkins
Poultry’s products are incurred whether the product is sold at split-off or after further
processing. Exhibit 11–8 (p. 486) provides the joint cost allocations based on each
5
Given that joint products are generated in process costing environments, the units in this computation will be equivalent units
of production as discussed in Chapter 6. The issue of EUP is ignored in this chapter.
$5,400,000
486
Chapter 11 Allocation of Joint Costs and Accounting for By-Product/Scrap
Exhibit 11–8 Harkins Poultry’s Joint Cost Allocation Based on Net Realizable Value at Split-Off
Joint
Product
Tons
Produced
Unit NRV
per Ton
Total NRV
Proportion
Joint
Cost
Amount
Allocated
Cost
per Ton
Breast
3,800
$2,600a
$ 9,880,000
0.57d
$5,400,000
$3,078,000
$810.00
Ground
2,400
1,700b
4,080,000
0.24e
5,400,000
1,296,000
540.00
Whole
2,800
c
3,220,000
f
0.19
5,400,000
1,026,000
366.43
Total
9,000
$17,180,000
1.00
1,150
$5,400,000
Unit NRV per Ton ϭ Sales Value at Split-Off Ϫ Marketing Costs at Point of Sale
Unit NRV per ton ϭ $2,800 Ϫ $200 ϭ $2,600
Unit NRV per ton ϭ $1,800 Ϫ $100 ϭ $1,700
c
Unit NRV per ton ϭ $1,200 Ϫ $50 ϭ $1,150
a
b
Proportions ϭ Total Revenue of Respective Joint Product Ϭ Total Revenue
$9,880,000 Ϭ $17,180,000 ϭ 0.57 (rounded)
$4,080,000 Ϭ $17,180,000 ϭ 0.24 (rounded)
f
$3,220,000 Ϭ $17,180,000 ϭ 0.19 (rounded)
d
e
product’s relative proportion of total NRV. Results in Exhibits 11–7 and 11–8 are very
similar because marketing costs incurred for each primary product are relatively low.
When disposal costs are high, cost allocations based on sales values and NRVs at splitoff can differ substantially.
Approximated Net Realizable Value at Split-Off
Often, some or all of the joint products are not salable at split-off. These products must be
processed at an additional cost beyond the split-off point. This lack of marketability at splitoff means that neither the sales value at split-off nor the NRV at split-off approach can be
used. The approximated net realizable value at split-off allocation uses simulated NRVs
for the joint products at split-off to calculate the joint cost allocation. For each product, this
value is the final sales price minus incremental separate costs. Incremental separate costs are
all processing, marketing, and disposal costs incurred between the split-off point and point
of sale. An underlying assumption of this method is that the incremental revenue from
further processing is equal to or greater than the incremental costs of further processing
and selling.
Using the information in Exhibit 11–5, approximated NRVs at split-off are determined
for Harkins Poultry’s joint products.
Joint Product
Final Sales Price
per Ton
Separate Cost per Ton
after Split-Off*
Approximated NRV
at Split-Off
$3,200
$300a
$2,900
Ground
2,100
200
b
1,900
Whole
1,500
110c
1,390
Breast
*Separate Cost after Split-Off ϭ Separate Processing Cost ϩ Marketing Cost at Point of Sale:
a
$200 ϩ $100 ϭ $300
b
$100 ϩ $100 ϭ $200
c
$60 ϩ $50 ϭ $110
Further processing should be undertaken only if incremental revenues will exceed
incremental costs. These computations follow.
Chapter 11 Allocation of Joint Costs and Accounting for By-Product/Scrap
Final Sales
Price
Sales Price
at Split-Off
Separate Cost
per Ton at
Split-Off
Separate Cost
per Ton after
Split-Off
$3,200
$2,800
$200
$300
Ground
2,100
1,800
100
200
Whole
1,500
1,200
50
110
Joint Product
Breast
Incremental
Revenue
Incremental
Cost
Incremental
Profit
$400
$100
$300
Ground
300
100
200
Whole
300
60
240
Joint Product
Breast
487
For all products, the incremental revenues from further processing exceed the incremental costs. Thus, Harkins Poultry should process all joint products beyond the split-off
point. The same conclusion can be reached by comparing the NRVs at split-off with the
approximated NRVs at split-off:
Net Realizable Value
at Split-Off
Approximated Net
Realizable Value
at Split-Off
Difference
$2,600
$2,900
ϩ$300
Ground
1,700
1,900
ϩ$200
Whole
1,150
1,390
ϩ$240
Joint Product
Breast
Decisions made about further processing affect the values used to allocate joint cost in
the approximated NRV method. If it is not economical to process one or more products
beyond split-off, the base used for allocating joint cost will be a mixture of actual and
approximated NRVs at split-off. Products that will not be processed further will be valued
at their actual NRVs at split-off, whereas products that will be processed further are valued
at approximated NRVs at split-off. However, in this case, all products will be processed
further and the joint cost is allocated as shown in Exhibit 11–9.
Exhibit 11–9 Harkins Poultry’s Joint Cost Allocation Based on Approximated Net Realizable Value at Split-Off
Joint
Product
Tons
Produced
NRV
per Ton
Approximated
Total NRV
Proportion
Joint
Cost
Amount
Allocated
Cost
per Ton
Breast
3,800
$2,900
Ground
2,400
1,900
$11,020,000
0.57
$5,400,000
$3,078,000
$810.00
4,560,000
0.23
5,400,000
1,242,000
517.50
Whole
2,800
1,390
Total
9,000
3,892,000
0.20
5,400,000
1,080,000
385.71
$19,472,000
1.00
Harkins Poultry decides to further process its 1,000 tons of breast meat into deli meat,
900 tons of ground turkey into turkey sausage, and 1,200 tons of whole turkey into marinated
turkeys (see Exhibit 11–10 on p. 488). Further processing does not change the joint cost
allocations previously made; these allocations are assumed to be the ones computed in
Exhibit 11–9. The new products are allocated some of the original joint cost and absorb
their own separate processing costs, as shown in the following journal entries.
$5,400,000
488
Chapter 11 Allocation of Joint Costs and Accounting for By-Product/Scrap
Exhibit 11–10 Harkins Poultry’s Further Processing Diagram
Processing
Cost
Marketing
Cost
Sales
Price
Breast
1,000 tons
$90 per ton
$200 per ton
Deli
$3,200 per ton
Ground
900 tons
$78 per ton
$100 per ton
Sausage
$2,100 per ton
Whole
1,200 tons
$63 per ton
$50 per ton
Marinated
$1,500 per ton
Work in Process Inventory—Deli (1,000 tons ϫ $810.00)
810,000
Work in Process Inventory—Sausage (900 tons ϫ $517.50)
465,750
Work in Process Inventory—Marinated (1,200 tons ϫ $385.71)
462,852
Work in Process Inventory—Breast
810,000
Work in Process Inventory—Ground
465,750
Work in Process Inventory—Whole
462,852
To transfer allocated costs to new product inventories
Work in Process Inventory—Deli (1,000 tons ϫ $90)
90,000
Work in Process Inventory—Sausage (900 tons ϫ $78)
70,200
Work in Process Inventory—Marinated (1,200 tons ϫ $63)
75,600
Various accounts
235,800
To record separate processing costs
The marketing costs have not been recorded because the products have not yet been sold.
Each method discussed allocates a different amount of joint cost to the joint products
and results in a different per-unit cost for each product. Each method has advantages and
disadvantages. For most companies, approximated NRV at split-off provides the most
logical joint cost assignment. Approximated NRV is considered the “best” method of joint
cost allocation because this method captures the
• intended level of separate processing,
• costs of separate processing,
• expected selling costs of each joint product, and
• expected selling price of each joint product.
Thus, approximated NRV measures the expected contribution of each product line to the
coverage of joint costs. This method is, however, more complex than the others because estimations must be made about additional processing costs and potential future sales values.
LO.4 How are by-product
and scrap accounted for?
Accounting for By-Product and Scrap
The distinction between by-product and scrap is merely one of degree. Thus, in the following
discussion, "scrap" can be substituted anywhere that “by-product” is used. Similar to the
accounting for joint cost, a variety of methods exist in practice to account for a by-product. The
choice of method should depend on the magnitude of the net realizable value of the by-product
and the need for additional processing after split-off. As the sales value of the by-product
increases, so does the need for inventory recognition. Sales value of the by-product is generally
Chapter 11 Allocation of Joint Costs and Accounting for By-Product/Scrap
recorded under either the NRV approach or realized value approach.6 These approaches are
discussed in the following sections using additional data for Harkins Poultry, which produces
fertilizer pellets as a by-product. Exhibit 11–11 provides the April 2010 data.
Exhibit 11–11 April 2010 Data for By-Products of Harkins Poultry
Total processing for month: 10,000 tons of turkey, resulting in 9,000 tons of joint products
By-products from joint product production: 1,000 tons (or 2,000,000 pounds) of fertilizer pellet
ingredients
Selling price of fertilizer pellets: $0.30 per pound
Processing costs per pound of fertilizer pellets: $0.08 for labor and $0.02 for overhead
Net realizable value per pound of fertilizer pellets: $0.20
Net Realizable Value Approach
The net realizable value approach (or offset approach) reduces joint product cost for the
net realizable value created by the by-product’s sale. When by-product is generated, the
NRV is debited to inventory and one of two accounts may be credited: Work in Process
Inventory—Joint Products or Cost of Goods Sold for the joint products. Using the Work
in Process account allows the joint cost to be reduced immediately when the by-product is
produced. However, recording that reduction immediately is less conservative than waiting until the by-product is actually sold. It is also possible that the by-product could have
sales potential beyond that currently known by management.
The journal entries to record Harkins Poultry’s by-product production and the additional processing, completion, and sale of the by-product are as follows:
Work in Process Inventory—Fertilizer Pellets (2,000,000 ϫ $0.20)
400,000
Work in Process Inventory—Joint Products
400,000
To record production of by-product; an alternative credit could
have been made to Cost of Goods Sold for the joint products
Work in Process Inventory—Fertilizer Pellets (2,000,000 ϫ $0.10)
200,000
Various accounts
200,000
To record additional processing costs
Finished Goods Inventory—Fertilizer Pellets (2,000,000 ϫ $0.30)
600,000
Work in Process Inventory—Fertilizer Pellets
600,000
To transfer completed by-product to finished goods
Cash (or Accounts Receivable) (2,000,000 ϫ $0.30)
Finished Goods Inventory—Fertilizer Pellets
600,000
600,000
To record sale of by-product
Reducing joint cost by the NRV of the by-product/scrap is the traditional method
used to account for such goods, but it is not necessarily the best method for internal decision making or by-product management. When management considers by-product to be
a moderate source of income, the accounting and reporting methods used should help
managers monitor by-product production and further processing as well as make effective decisions regarding this resource.7 The NRV method does not indicate the revenues,
expenses, or profits from the by-product and, thus, does not provide sufficient information
to induce management to maximize the inflows from by-product disposal.
6
Other alternative presentations include showing the realized value from the sale of by-product as (1) an addition to gross
margin, (2) a reduction of the Cost of Goods Manufactured, or (3) a reduction of the Cost of Goods Sold. The major advantage of
these simplistic approaches is clerical efficiency.
7
Advances in technology and science have turned many previous “by-product” or “scrap” items into main products. Management
should not ignore the significance of such products and should seek new uses or markets for them.
489
490
Chapter 11 Allocation of Joint Costs and Accounting for By-Product/Scrap
Realized Value Approach
Under the realized value approach (or other income approach), no value is recognized
for the by-product until it is sold. This method is the simplest approach to accounting for
by-product. Several reporting techniques can be used with the realized value approach.
One presentation shows total sales of by-product on the income statement under the
Other Revenue caption. Costs of additional processing or disposal of the by-product are
included in the cost of producing the joint products. This presentation provides little useful
information to management because it does not match the costs of producing the by-product with its revenues. Harkins Poultry’s entries for the incurrence of labor and overhead
costs and sale of by-product using the Other Revenue method follow.
Work in Process Inventory—Joint Products (2,000,000 ϫ $0.08) 160,000
Manufacturing Overhead Control (2,000,000 ϫ $0.02)
40,000
Various accounts
200,000
To record the labor and overhead costs of by-product processing
(Note: All costs are included in the cost of joint products.)
Cash (or Accounts Receivable) (2,000,000 ϫ $0.30)
600,000
Other Revenue
600,000
To record sale of by-product
A second presentation for the realized value approach shows by-product revenue, net of
additional costs of processing and disposal, on the income statement. The net by-product
revenue is presented as an enhancement of net income in the period of sale under the
Other Income caption. This presentation allows management to recognize the monetary
benefit realized from managing the costs and revenues related to by-product. The entries
using the Other Income method for the incurrence of labor and overhead costs and sale of
by-product for Harkins Poultry follow.
Work in Process Inventory—Fertilizer Pellets (2,000,000 ϫ $0.10) 200,000
Various accounts
200,000
To record the labor and overhead costs of by-product processing
(Note: All costs are included in the cost of by-product.)
Cash (or Accounts Receivable)
600,000
Work in Process Inventory—Fertilizer Pellets
200,000
Other Income
400,000
To record sale of by-product net of processing/disposal costs
The Other Income method matches by-product revenue with related storage, further
processing, transportation, and disposal costs. As such, this method
• presents detailed information on financial responsibility and accountability for disposition of these secondary outputs,
• provides better control opportunities than the realized value approach, and
• could improve performance because managers are more apt to look for new or expanded sales
potential given that the net benefits of doing so are provided on the income statement.
Regardless of whether a company uses the NRV or the realized value approach, the
specific method used to account for by-product should be established before the joint cost
is allocated to the joint products. Exhibit 11–12 shows four comparative income statements
using different methods of accounting for by-product/scrap income for Harkins Poultry.
Some assumed amounts have been included to provide complete income statements.
By-product, scrap, and waste are created in all types of businesses, not just by manufacturers. Managers might not see the need to determine the cost of these secondary types
of outputs. However, with the trend toward more emphasis on cost and quality control,
Exhibit 11–12 Harkins Poultry Comparative Income Statements—
By-Product Presentations
(a) Net Realizable Value Approach: Reduce Cost of Goods Sold (CGS)
Sales
Cost of goods sold
Beginning finished goods (FG)
Cost of goods manufactured (CGM)
Cost of goods available (CGA)
Ending FG
Unadjusted CGS
NRV of by-product
Gross margin
Operating expenses
Income from principal operations
Other income
Royalties
Income before income taxes
$ 6,200,000
$ 400,000
3,600,000
$4,000,000
(380,000)
$3,620,000
(400,000)
(3,220,000)
$ 2,980,000
(2,600,000)
$ 380,000
80,000
$ 460,000
(b) Net Realizable Value Approach: Reduce Cost of Goods Manufactured (CGM)
Sales
Cost of goods sold
Beginning FG
CGM ($3,600,000 Ϫ $400,000)
CGA
Ending FG [assumed to be smaller than under (a)]
Gross margin
Operating expenses
Income from principal operations
Other income
Royalties
Income before income taxes
$6,200,000
$ 400,000
3,200,000
$3,600,000
(342,000)
(3,258,000)
$2,942,000
(2,600,000)
$ 342,000
80,000
$ 422,000
(c) Net Realized Value Approach: Increase Revenue
Sales
Other revenue
By-product sales
Total revenue
Cost of goods sold
Beginning FG
CGM (main products)
CGM (processing by-product)
CGA
Ending FG
Gross margin
Operating expenses
Income from principal operations
Other income
Royalties
Income before income taxes
$6,200,000
600,000
$6,800,000
$ 400,000
3,600,000
200,000
$4,200,000
(380,000)
(3,820,000)
$2,980,000
(2,600,000)
$ 380,000
80,000
$ 460,000
(d) Net Realized Value Approach: Present as Other Income
Sales
Cost of goods sold
Beginning FG
CGM
CGA
Ending FG
Gross margin
Operating expenses
Loss from principal operations
Other income
Royalties
By-product sales (NRV)
Income before income taxes
$6,200,000
$ 400,000
3,600,000
$4,000,000
(380,000)
$
80,000
400,000
(3,620,000)
$2,580,000
(2,600,000)
$ (20,000)
480,000
$ 460,000
492
Chapter 11 Allocation of Joint Costs and Accounting for By-Product/Scrap
companies are becoming more aware of the potential value of by-product, scrap, and waste
and are devoting time and attention to developing those innovative revenue sources.
By-Product and Scrap in Job Order Costing
Although joint products are not normally associated with job order costing systems,
accounting for by-product or scrap is common in these systems. Either the NRV or the
realized value approach can be used to recognize the value of by-product/scrap.
In a job order system, the value of by-product/scrap is appropriately credited to either
manufacturing overhead or the specific jobs in process. Overhead is credited if by-product/
scrap is typically created by most jobs undertaken. This method reduces the amount of overhead that is applied to all products for the period. In contrast, if only a few or specific jobs
generate substantial amounts of by-product/scrap, the individual jobs causing this output
should be credited with its value. This method reduces the total costs assigned to those jobs.8
To illustrate, assume that Harkins Poultry occasionally prepares special turkey products for large institutional clients. Every special order generates scrap meat that is sold to
Canine Catering Corporation. In October 2010, Harkins Poultry received an order for
20,000 turkey casseroles from the Hays County Public School District. The casseroles are
prepared using a combination of breast, thigh, and wing meat. After production of the casseroles, Harkins Poultry sold $250 of scrap meat. Using the realized value approach, the
entry to record the sale of the scrap is:
Cash
250
Manufacturing Overhead
250
To record the sale of scrap
In contrast, assume that Harkins Poultry seldom has salable scrap on its special order jobs.
However, during October 2010, the company contracted with Green Cove Convalescent
Centers to prepare 25,000 frozen chicken croquettes. Because Harkins Poultry normally does
not process chicken, it must acquire specific raw material for the job and will charge the cost
of all raw material directly to Green Cove. Preparation of the chicken croquettes generates
some scrap that can be sold for $375 to Tortilla Soup Cannery. Because the raw material is
directly related to the Green Cove job, sale of scrap from that raw material also relates to that
job. Under these circumstances, the production and sale of the scrap are recorded (using the
NRV approach) as follows:
Scrap Inventory—Chicken
375
Work in Process Inventory—Green Cove Convalescent Centers
375
To record the NRV of scrap produced by Green Cove job
Cash
375
Scrap Inventory—Chicken
375
To record sale of the scrap
In this case, the NRV approach is preferred because of the timing of recognition. The
need to affect the specific job cost that caused an unusual incidence and quantity of scrap
makes it essential to recognize the scrap at the point of production. Without prompt recognition, the job could be completed before the scrap could be sold.
Allocation of joint costs is not unique to manufacturing organizations. Some costs
incurred in service businesses and in not-for-profit organizations are considered joint costs
in that it may be necessary to allocate those costs among product lines, organizational locations, or types of organizational activities.
8
Conceptually, the treatment of the profitability of by-product/scrap in a job order system is similar to the treatment of the costs
of spoilage in a job order system, as discussed in Chapter 5.
Chapter 11 Allocation of Joint Costs and Accounting for By-Product/Scrap
Joint Costs in Service Businesses and
Not-for-Profit Organizations
Joint costs in service businesses and NFP organizations relate to marketing and promotion
issues rather than to production processes. Service businesses and NFPs incur joint costs for
advertising multiple programs, printing multipurpose documents, or holding multipurpose
events. For example, NFPs often develop and distribute brochures providing information
about the organization, its purposes, and its programs as well as making an appeal for funds.
A service business can choose either a physical or a monetary allocation base to allocate
joint costs. For example, a local bicycle and lawn mower repair company could advertise
a sale and list all store locations in a single newspaper ad. The ad cost could be allocated
equally to all locations or be allocated on sales volume for each location during the period
of the sale. As another example, a grocery delivery service could deliver several customers’
orders on the same trip. The cost of the trip could be allocated based on the number of bags
or pounds of food delivered for each customer.
Although service businesses may decide that allocating joint cost is not necessary,
financial accounting requires that NFPs (and state and local government entities) allocate the costs of “joint activities” among fund-raising, organizational program (program
activities), and administrative functions (management and general activities).9 Although
no specific allocation method is prescribed, the SOP only states that the method must be
• rational and systematic,
• result in reasonable allocations, and
• applied in the same manner under similar situations.
A major purpose of this allocation process is to ensure that financial statement users are able
to clearly determine amounts spent by the organization for various activities—especially
fund-raising. High fund-raising costs may harm an NFP’s credibility with donors who
measure an organization’s effectiveness by the percentage of funds that goes to programs
furthering the entity’s mission rather than the percentage going to raise more funds. High
fund-raising percentages may also jeopardize an NFP’s standing with charity regulators.
Three tests must be met for an NFP to allocate an event or a publication cost to categories other than fund-raising. If all three tests are not met, the cost associated with the “joint
activity” must be charged to fund-raising.10 The tests relate to the following concepts:
Criterion
Meaning
Purpose
The activity includes accomplishing some program or
management/general function.
Audience
The audience is suitable for accomplishing the activity’s program or
management/general functions.
Content
The content supports program or management/general functions.
The commonality among the criteria is that each creates some type of “call for action.”
Thus, a brochure that simply informs the audience about the NFP’s purpose or a particular
disease is not considered a call for action.
A critical element under the purpose criterion is the compensation test. If a majority of
compensation or fees for anyone performing a part of the activity is tied to contributions
raised, the activity automatically fails the purpose criterion and all costs of the activity
must be charged to fund-raising. Thus, if professional fundraisers are used and paid a percentage of the amount raised, all costs of the activity must be charged to fund-raising.
9
American Institute of Certified Public Accountants, Statement of Position 98-2: Accounting for Costs of Activities of Not-for-Profit
Organizations and State and Local Governmental Entities That Include Fund Raising (August 1998).
10
An exception to the rule is that costs for goods and services provided in exchange transactions (such as a meal provided at
a function that failed to meet the three required criteria) that are part of joint activities should not be reported as fund-raising
costs; such costs should be reported as cost of sales for the activity.
493
LO.5 How should
not-for-profit organizations
account for the cost of a
joint activity?
Comprehensive Review Module
Key Terms
approximated net realizable value at split-off allocation, p. 486
by-product, p. 476
joint cost, p. 476
joint process, p. 476
joint product, p. 476
net realizable value (NRV), p. 485
net realizable value approach, p. 489
net realizable value at split-off allocation, p. 485
physical measure allocation, p. 482
realized value approach, p. 490
sales value at split-off allocation, p. 485
scrap, p. 476
separate cost, p. 476
split-off point, p. 479
waste, p. 477
Chapter Summary
LO.1
Classification of Joint Process Output
• Joint products are the output with a relatively high sales
value.
- These products provide the primary incentive for
undertaking production.
- These products are identified at the split-off point.
- These products are assigned the joint cost of the production process.
- These products could have the related joint cost
reduced by the net realizable value or realized value
of by-product and scrap.
• By-products have a higher sales value than scrap but less
than joint products.
• Scrap is the output with a low sales value.
• Waste is the residual output with no sales value.
LO.2 Management Decisions about a Joint Process
• Two questions must be answered before the joint process is started:
- Do total revenues exceed total (joint and separate)
costs?
- Is this process the best use of available facilities?
494
• Two questions must be answered at the split-off point:
- Which products will be classified as joint products,
by-product, scrap, and waste?
- Which products will be sold at split-off, and which
will be processed further?
LO.3 Allocation of Joint Cost to Joint Products
• There are two common methods of allocating joint cost
to joint products.
- Physical measures may be used. These measures
➢ provide an unchanging yardstick of output over
time and
➢ treat each unit of product as equally desirable.
- Monetary measures may be used. These measures
consider different valuations of the individual joint
products; these valuations can be based on
➢ sales value at split-off,
➢ net realizable value at split-off, or
➢ approximated net realizable value at split-off.
LO.4 Accounting for By-Product and Scrap
• There are two common methods of accounting for byproduct and scrap.
Chapter 11 Allocation of Joint Costs and Accounting for By-Product/Scrap
- The net realizable value (offset) approach uses the
NRV of the by-product to reduce either
➢ Work in Process Inventory of the joint products
when the by-product/scrap is produced or
➢ Cost of Goods Sold of the joint products when
the by-product/scrap is produced.
- The realized value (other income) approach shows
the NRV of the by-product/scrap on the income
statement as either
➢ other revenue when the by-product/scrap is sold or
➢ other income when the by-product/scrap is sold.
LO.5 Accounting for the Cost of a Joint Activity in Not-forProfit Organizations
• There are two alternatives for accounting for the cost of
a joint activity by not-for-profit organizations:
- The activity must meet three tests for its cost to be
allocated:
➢ purpose
➢ audience
➢ content
- If all of the criteria are met, the cost is allocated
among three categories:
➢ fund-raising,
➢ program, and/or
➢ management/general activities.
- If all of the criteria are not met, the entire cost is
allocated to fund-raising.
Solution Strategies
Allocation of Joint Cost, p. 482
Joint cost is allocated only to joint products; however, joint cost can be reduced by the value
of by-product/scrap before the allocation process begins.
For physical measure allocation: Divide joint cost by the products’ total physical measurements to obtain a cost per unit of physical measure.
For monetary measure allocation:
1. Choose an allocation base.
2. List the values that compose the allocation base for each joint process.
3. Sum the values in Step 2.
4. Calculate the percentage of the total base value associated with each joint product.
5. Multiply the joint cost by each percentage calculated in Step 4 to obtain the amount to
be allocated to each joint product.
6. Divide the prorated joint cost for each product by the number of equivalent units of
production (EUP) for each product to obtain a cost per EUP for valuation purposes.
Allocation bases, measured at the split-off point, by which joint cost is prorated to
the joint products include the following:
Type of Measure
Allocation Base
Physical output
Physical measure of units of output (e.g., tons, feet, barrels, liters)
Monetary
Currency units of value
Sales value
Revenues of the several products
Net realizable value
Sales value minus incremental processing and disposal costs
Final sales price minus incremental separate costs
Approximated net realizable value
495
496
Chapter 11 Allocation of Joint Costs and Accounting for By-Product/Scrap
Demonstration Problem
Circle City Inc. produces two joint products—JP#89-43-A and JP#89-43-B—from a single input. Further processing of product JP#89-43-A results in a by-product designated
BP#89-43-X. A summary of production and sales for 2010 follows.
•
•
•
•
•
•
•
Circle City Inc. input 600,000 pounds of raw material into the Processing Department.
Total joint processing cost was $520,000. During the joint processing, 90,000 pounds of
material were lost.
After joint processing, 60 percent of the joint process output was transferred to Division 1
to produce JP#89-43-A, and 40 percent of the joint process output was transferred to Division 2 to produce JP#89-43-B.
Further processing in Division 1 resulted in 70 percent of the input pounds becoming
JP#89-43-A and 30 percent of the input pounds becoming BP#89-43-X. The separate
processing cost for JP#89-43-A in Division 1 was $649,026.
Total packaging costs for JP#89-43-A were $122,094. After Division 1 processing and
packaging, product JP#89-43-A is salable at $8.00 per pound.
Each pound of BP#89-43-X can be sold for $0.25 after incurring total selling cost
of $5,000. The company accounts for the by-product using the net realizable value
method and showing the NRV as a reduction in the cost of goods sold of the joint
products.
In Division 2, product JP#89-43-B was further processed at a separate cost of $387,600.
A completed pound of JP#89-43-B sells for $3.70.
Selling cost for product JP#89-43-A is $0.80 per pound and for product JP#89-43-B is
$0.15 per pound.
Required:
a. Prepare a process diagram similar to the one shown in Exhibit 11–5 or 11–10.
b. Record the journal entry to
1. recognize incurrence of joint cost.
2. allocate joint costs to the joint products using pounds as a physical measure and
transfer the products into Divisions 1 and 2.
3. record incurrence of separate processing costs for products JP#89-43-A and JP#8943-B in Divisions 1 and 2.
4. record incurrence of packaging cost for product JP#89-43-A.
5. transfer completed products JP#89-43-A and JP#89-43-B to finished goods.
c. Allocate the joint cost to products JP#89-43-A and JP#89-43-B using approximated net realizable values at split-off. (Round proportions to nearest whole
percentage.)
d. Circle City Inc. had no Work in Process or Finished Goods Inventory at the beginning
of 2010. Prepare an income statement through gross margin for Circle City Inc. assuming that
•
80 percent of product JP#89-43-A and 90 percent of product JP#89-43-B produced were sold.
•
all the by-product BP#89-43-X that was produced during the year was sold.
•
joint cost was allocated using the physical measurement method in (b).
Chapter 11 Allocation of Joint Costs and Accounting for By-Product/Scrap
497
Solution to Demonstration Problem
a.
Separate Costs
Processing
Department
Joint
Processing of
600,000 pounds
at a total
joint cost of
$520,000
Division 1
306,000 pounds
processed at
a separate
cost of
$649,026
Division 2
JP#89-43-B
204,000 pounds
processed at
a separate
cost of
$387,600
JP#89-43-A
214,200 pounds
processed at
a separate
cost of
$122,094
BP#89-43-X
91,800 tons
Marketing Cost
$0.80 per pound
JP#89-43-A
SP ϭ
$8.00 per pound
Marketing Cost
$5,000
BP#89-43-X
SP ϭ
$0.25 per pound
JP#89-43-B
SP ϭ
$4.70 per pound
Marketing Cost
$0.15 per pound
Split-off Point
90,000
pounds lost in
processing
b.
1.
Work in Process Inventory—Processing
520,000
Various accounts
520,000
To record 2010 joint processing costs
2.
Work in Process Inventory—Division 1
312,000
Work in Process Inventory—Division 2
208,000
Work in Process Inventory—Processing
520,000
To allocate joint cost to joint products:
Div. 1 ϭ 0.60 ϫ 510,000 ϭ 306,000 lbs.
Div. 2 ϭ 0.40 ϫ 510,000 ϭ 204,000 lbs.
3.
Work in Process—Division 1
649,026
Work in Process—Division 2
387,600
Various accounts
1,036,626
To record separate processing costs
4.
Work in Process Inventory—Division 1
122,094
Various accounts
122,094
To record packaging costs for JP#89-43-A
5.
Finished Goods Inventory—JP#89-43-A
1,083,120
Finished Goods Inventory—JP#89-43-B
595,600
Work in Process Inventory—Division 1
1,083,120
Work in Process Inventory—Division 2
595,600
To transfer completed production to finished goods
498
Chapter 11 Allocation of Joint Costs and Accounting for By-Product/Scrap
c. Approximated NRV Method
Pounds
Produced
NRV
per Lb. at
Split-Off*
Total NRV
JP#89-43-A
214,200
$3.60
JP#89-43-B
204,000
2.65
Product
Proportion
Joint
Cost
Allocated
Joint Cost
$ 771,120
0.59
$520,000
$306,800
540,600
0.41
520,000
213,200
$1,311,720
1.00
*
$520,000
JP#89-43-A
Selling price per pound
JP#89-43-B
$8.00
$4.70
Separate costs
Division 1 ($649,026 Ϭ 214,200)
(3.03)
Packaging ($122,094 Ϭ 214,200)
(0.57)
Division 2 ($387,600 Ϭ 204,000)
Selling
Approximated net realizable value
(1.90)
(0.80)
(0.15)
$3.60
$2.65
d.
Circle City Inc.
Income Statement
For the Year Ended December 31, 2010
Sales
JP#89-43-A (214,200 ϫ 0.80 ϫ $8.00)
$1,370,880
JP#89-43-B (204,000 ϫ 0.90 ϫ $4.70)
862,920
$2,233,800
Cost of Goods Sold
Beginning Finished Goods Inventories
$
0
Cost of Goods Manufactured [from part (b5)]
JP#89-43-A
1,083,120
JP#89-43-B
595,600
Available for sale
$1,678,720
Ending Finished Goods Inventories
JP#89-43-A ($1,083,120 ϫ 0.20)
JP#89-43-B ($595,600 ϫ 0.10)
Unadjusted Cost of Goods Sold
NRV of by-product [(91,800 ϫ $0.25) Ϫ $5,000]
Gross margin
(216,624)
(59,560)
$1,402.536
(17,950)
(1,384,586)
$ 849,214
Potential Ethical Issues
Ethics
1. Making product decisions based on the sum of allocated joint cost and separate processing costs
2. Classifying a joint product as a by-product or scrap so that no joint cost will be allocated to that product and, thereby, increase that product’s appearance of profitability
3. Classifying a salable product as “waste” and then selling that product “off the books” for
the personal benefit of a manager
Chapter 11 Allocation of Joint Costs and Accounting for By-Product/Scrap
499
4. Manipulating the assignment of joint costs such that joint products in inventory at
period-end are assigned a disproportionately higher cost than joint products sold
during the period so that higher income and higher inventory values are reported at
period-end
5. Using the sales value of by-product/scrap generated by specific jobs to offset total manufacturing overhead and, thus, lowering the overhead allocation rate on all production
rather than using that sales value to reduce the cost of the job specifically generating
the by-product/scrap
6. Reducing or not incurring expenses by disposing of hazardous waste in a manner that
causes harm to the environment or threatens humans and wildlife
7. Misallocating the cost of an activity to program and management/general activities
solely to reduce the fund-raising cost of a not-for-profit organization
Questions
1. How does management determine how to classify each type of output from a joint
process? Is this decided before or after production?
2. In a company that engages in a joint production process, will all processing stop at the
split-off point? Discuss the rationale for your answer.
3. By what criteria would management determine whether to proceed with processing at
each decision point in a joint production process?
4. Why is cost allocation necessary in accounting? Why is it necessary in a joint
process?
5. Compare the advantages and disadvantages of the two primary methods used to allocate joint cost to joint products.
6. Why are approximated, rather than actual, net realizable values at split-off sometimes
used to allocate joint cost?
7. Which of the two common approaches used to account for by-product/scrap provides
better information to management? Discuss the rationale for your answer.
8. When is by-product/scrap cost considered in setting the predetermined overhead rate
in a job order costing system? When is cost not considered?
9. Why must not-for-profit organizations determine when it is appropriate to allocate any cost for a joint activity among fund-raising, program, and administrative
activities?
Exercises
10. LO.1 (Research; writing) Use the Internet to find five examples of businesses that
have joint processes.
a. For each business, describe the various outputs from the processes; using logic,
determine whether each output would be classified as a joint product, a by-product,
scrap, or waste.
b. Recommend the most appropriate methods of allocating joint cost to the outputs
you described in part (a); express, in nontechnical terms, your justification for each
of your recommendations.
c. For one of the businesses, diagram the flow of costs.
Internet