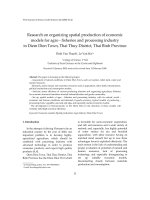
Prospects for development of the garment industry in developing countries: What has happened since the MFA phase-out?
Bạn đang xem bản rút gọn của tài liệu. Xem và tải ngay bản đầy đủ của tài liệu tại đây (507.7 KB, 34 trang )
INSTITUTE OF DEVELOPING ECONOMIES
Discussion Papers are preliminary materials circulated
to stimulate discussions and critical comments
DISCUSSION PAPER No. 101
Prospects for Development of the Garment
Industry in Developing Countries: What Has
Happened Since the MFA Phase-Out?
Tatsufumi Yamagata
April 2007
Abstract
On January 1, 2005, the controlled trade regime on textiles and clothing which
was based on the Multi-Fiber Arrangement (MFA) made in 1974 was abolished. This
institutional change wrought great impacts on the world market for textiles and clothing.
This paper reviews the impacts of the changes on the main markets and examines the
prospects for the markets and the source countries. The main conclusions are as follows: (1)
after the renewal of quantitative restrictions on Chinese garment exports were agreed with
the US and the EU, the post-MFA surge in Chinese garment exports was significantly
attenuated; (2) instead, the growth in garment exports from other Asian low-income
countries to the two markets was revived in 2006; (3) the Japanese market has been kept
almost intact from the impact of the regime shift; (4) some developing countries, such as
Bangladesh and Cambodia, not only survived the liberalization but also have steadily
expanded their garment exports throughout the transition; and (5) an indicative fact is that
the profitability of the garment industry in Bangladesh and Cambodia was high on average
according to surveys conducted in 2003, which might have bolstered the steady growth of
garment exports in the past, and possibly future growth, too.
Keywords: Garment; MFA phase-out; China; Bangladesh, Cambodia
JEL classification: L67, O53
1
The Institute of Developing Economies (IDE) is a semigovernmental, nonpartisan,
nonprofit research institute, founded in 1958. The Institute merged with the Japan
External Trade Organization (JETRO) on July 1, 1998.
The Institute conducts
basic and comprehensive studies on economic and related affairs in all developing
countries and regions, including Asia, the Middle East, Africa, Latin America,
Oceania, and Eastern Europe.
The views expressed in this publication are those of the author(s). Publication
does not imply endorsement by the Institute of Developing Economies of any
of the views expressed.
INSTITUTE OF DEVELOPING ECONOMIES (IDE), JETRO
3-2-2, WAKABA, MIHAMA-KU, CHIBA-SHI
CHIBA 261-8545, JAPAN
©2007 by Institute of Developing Economies, JETRO
2
Prospects for Development of the Garment Industry in
Developing Countries: What Has Happened Since the MFA
Phase-Out? *
Tatsufumi YAMAGATA †
Institute of Developing Economies
Japan External Trade Organization
April 2007
Abstract
On January 1, 2005, the controlled trade regime on textiles and clothing which was
based on the Multi-Fiber Arrangement (MFA) made in 1974 was abolished. This
institutional change wrought great impacts on the world market for textiles and
clothing. This paper reviews the impacts of the changes on the main markets and
examines the prospects for the markets and the source countries. The main
conclusions are as follows: (1) after the renewal of quantitative restrictions on
Chinese garment exports were agreed with the US and the EU, the post-MFA surge
in Chinese garment exports was significantly attenuated; (2) instead, the growth in
garment exports from other Asian low-income countries to the two markets was
revived in 2006; (3) the Japanese market has been kept almost intact from the
impact of the regime shift; (4) some developing countries, such as Bangladesh and
Cambodia, not only survived the liberalization but also have steadily expanded their
garment exports throughout the transition; and (5) an indicative fact is that the
profitability of the garment industry in Bangladesh and Cambodia was high on
average according to surveys conducted in 2003, which might have bolstered the
steady growth of garment exports in the past, and possibly future growth, too.
Keywords: Garment; MFA phase-out; China; Bangladesh, Cambodia
*
This paper was prepared for the seminar entitled “Asia’s Clothing Industry at a Crossroads
Amid Intensified Global Competition,” held by the Institute of Developing Economies (IDE)
at the Japan External Trade Organization (JETRO) in Tokyo on March 13, 2007.
†
E-mail:
3
Introduction
Textiles and clothing will always be essential goods for human beings. Spinning and
weaving were the main activities that drove the Industrial Revolution in the 18th century.
Since then the textile industry has been a leading industry in the initial phase of
industrialization in many countries in different periods of time in the world.
This leading role of the textile industry in industrialization was also significant in
high- and middle-income countries in Asia, too. The silk and cotton textile industries initiated
Japan’s industrialization in the Meiji era in the late 1800s (Ito, 1992; Murayama, 2005;
Yamazawa, 1988). The cotton textile industry played the same role in South Korea’s and
Taiwan’s industrialization (Amsden, 1989; Wade, 1990). Wearing apparel took over the role
for the original ASEAN member countries in the 1970s and 80s 1 (Amjad ed., 1981; Pang ed.,
1988).
It is noticeable that textiles and clothing are susceptible to trade restrictions caused
by trade friction. In the process of recovery from the devastation due to World War II, Japan
expanded its export of textiles again. Then, the rapid expansion frustrated the textile industry
in the United States so that Japan was strongly encouraged to exercise voluntary restraint on
cotton textile exports to the United States in 1957 (Yamazawa, 1988). Since then controlled
trade has been the norm rather than temporary regulation of the trade in textiles and clothing.
The import restrictions by the United States, Canada and the European countries were first
1
At the time, dominant technologies for spinning and weaving became more
capital-intensive than before so that they were no longer competitive industries in
labor-abundant countries.
4
incorporated as a short-term arrangement regarding international trade in textiles in 1961,
which was followed by a similar long-term arrangement regarding international trade in
cotton textiles between 1962 and 1974. In the sequel, a restricted trade regime was
perpetuated through the Multi-Fiber Arrangement (MFA) on international trade in textiles,
which came into effect in 1974. When the World Trade Organization (WTO) was launched in
1995, it was assumed that the MFA system of controlled trade would be phased out by
January 1, 2005, because such a controlled trade regime is against the raison d’être of the
WTO (Gereffi and Memedovic, 2003).
Complete liberalization of the trade in textiles and clothing was once achieved at the
beginning of 2005. However, it was short-lived as far as the trade between China and the two
greatest clothing markets in the world, i.e. the United States and the European Union, was
concerned. The EU concluded an agreement with China in June 2005 which set ceilings on
growth rates of exports of the main categories of clothing, and the United States followed in
November 2005, both of which stay in effect until 2008. Thus, the controlled trade regime
partially survives even today.
What are the impacts of the MFA phase-out completed in the beginning of 2005 on
the world clothing trade? Were there structural changes among source countries due to the
liberalization? Did small exporters all collapse as was indicated by a WTO discussion paper
(Nordås, 2004) and as widely believed right before the MFA phase-out? Which countries
survived the liberalization, and what features did they have for survival? Those are the
questions addressed in this paper.
5
The answers are as follows: (1) After the MFA phase-out there were drastic changes
in the composition of source countries in the United States and the European Union; (2) There
was no significant impact on the Japanese market; (3) Some developing countries survived
the liberalization though most small exporters suffer from a decline in the export of clothing;
(4) Bangladesh and Cambodia have fared very well among the Least Developed Countries
(LDCs); and (5) The average profitability of the clothing industry in the two countries was
high according to the surveys conducted by the Institute of Developing Economies (IDE) in
cooperation with a couple of research institutes in the two countries in 2003.
The rest of the paper is organized as follows. Section 1 summarizes the changes
occurring in the three greatest markets for clothing in the world, namely the United States, the
European Union and Japan, after the MFA phase-out. Section 2 focuses on the good
performers from the LDCs. Based on firm-level surveys conducted in Bangladesh and
Cambodia in 2003, features of the garment industry in the two countries are highlighted.
Concluding remarks are given at the end.
1. What Has Happened Since the MFA Phase-out?
The first question to be addressed is about the impacts of the MFA phase-out and the
renewed quantitative restrictions on China’s garment exports to the US and the EU on the
world clothing trade. The compositions of source countries for the US, EU and Japanese
markets are investigated in order.
6
1.1. Garment Exports to the United States
There have been remarkable structural changes in the US market in the clothing
trade since the beginning of 2005. As expected, exports from China and India jumped in the
first half of the year. Since China was the greatest exporter of garments to the United States
and since the growth rate in the value of exports from China was extremely high, the US
government seriously considered invoking safeguards to put the brakes on garment imports
from China. The EU also faced a surge in garment imports from China. As a result the EU and
China reached an agreement on a three-year “transitional arrangement” on June 10, 2005
which limits the annual increase in Chinese garment imports to about 10 percent until trade is
liberalized in 2008. The United States and China made a similar agreement which will set
quotas covering nearly half of China’s garment imports into the United States by the end of
2008.
Table 1 exhibits detailed structural changes in the composition of source countries
supplying the US market. The annual growth rate of garment exports from China to the
United States was 56.77 percent in 2005, which was extremely high in comparison with the
growth rate of total garment imports to the United States, which was 5.89 percent. India was
the second fastest among the top ten exporters, with a growth rate of 34.31 percent. 2 The
South Asian countries as well as Cambodia and Indonesia substantially extended garment
exports to the United States. This observation is against most predictions made in 2004
2
For more information on the textile and garment industry in India, see Shimane (2006) and
Uchikawa (1998, 1999).
7
(Adiga, 2004; Buerk, 2004; de Jonquières, 2004; Nordås, 2004). 3 What is particularly
noteworthy are the great performances of Bangladesh and Cambodia, which are LDCs that
depend too much on clothing exports, and which were considered to be the most vulnerable
among the exporters. Wearing apparel makes up three quarters of the total exports from the
two countries as shown later, but their garment exports grew by over 20 percent in 2005.
Garment exports to the United States from the rest of the countries such as Mexico, which is a
close neighbor of the United States, those in Central America and the Caribbean, and other
Asian economies mostly stagnated or declined from 2004 to 2005.
3
Mayer (2004), who is an exception, gives a more optimistic view on the prospects of the
garment industry in Bangladesh.
8
Table 1. Exports of Knit and Woven Garments to the United States
Rank
Origin
Amount (Million US$)
Rate of Change (%)
2004
2005
2006
2005/04
2006/05
World
66,875
70,811
73,393
5.89
3.65
1
China
10,723
16,810
19,868
56.77
18.19
2
Mexico
6,845
6,230
5,448
-8.99
-12.55
3
Indonesia
2,402
2,882
3,675
19.99
27.50
4
India
2,277
3,059
3,242
34.31
6.00
5
Vietnam
2,506
2,665
3,158
6.37
18.49
6
Hong Kong
3,878
3,524
2,817
-9.13
-20.08
7
Bangladesh
1,872
2,268
2,809
21.17
23.85
8
Honduras
2,742
2,685
2,518
-2.09
-6.24
9
Cambodia
1,418
1,703
2,131
20.08
25.17
10
Philippines
1,765
1,822
1,999
3.21
9.70
11
Thailand
1,823
1,833
1,859
0.60
1.39
12
Sri Lanka
1,553
1,653
1,687
6.46
2.03
13
Guatemala
1,947
1,817
1,667
-6.66
-8.28
14
Dominican Republic
2,036
1,831
1,535
-10.09
-16.14
15
Italy
1,585
1,520
1,474
-4.12
-2.98
16
Pakistan
1,147
1,273
1,427
10.99
12.11
Note: Knit and woven garments are defined as commodities with HS codes of 61 and 62.
Source of data: U.S. Dept. of Commerce, Bureau of Census by World Trade Atlas.
The whole picture visibly changed due to the restriction on Chinese exports in 2006
(Table 1). The growth in garment exports from China was attenuated, even though the growth
rate was as high as 18.19 percent. India’s growth rate also declined to 6.00 percent which was
a little higher than the decline in the total garment imports in the United States of 3.65 percent.
On the other hand, other Asian exporters kept or recovered their growth momentum.
Bangladesh, Cambodia and Indonesia accelerated their growth in garment exports, while
Vietnam and the Philippines considerably enhanced their growth rates in 2006. It is
considered that the favorable performances of the Asian exporters are at least partially
attributable to the renewed imposition of the quantitative restrictions on the main part of
9
garment exports from China to the United States.
Table 2. Exports of Knit and Woven Garments to the EU15
Rate of Change (Jan-Oct, %)
Amount (Million US$)
Rank
Origin
Oct. 2006
2005/04
2006/05
2004
2005
World
65,552 69,864
65,323
7.83
10.74
1
China
13,714 20,361
19,032
54.41
6.84
2
Turkey
9,348
9,776
8,365
6.94
1.40
3
Bangladesh
4,578
4,356
4,853
-5.85
33.27
4
India
3,020
3,992
4,048
33.74
17.65
5
Romania
4,572
4,287
3,495
-4.61
-3.32
6
Hong Kong
2,394
2,056
2,771
-30.67
103.91
7
Tunisia
3,215
3,059
2,527
-2.39
-2.49
8
Morocco
3,004
2,814
2,420
-5.32
2.58
9
Indonesia
1,637
1,468
1,487
-14.10
23.94
10
Bulgaria
1,300
1,331
1,226
3.74
10.49
11
Poland
1,432
1,242
1,036
-12.79
-2.97
12
Vietnam
757
820
1,021
3.02
52.61
13
Sri Lanka
1,002
986
997
-2.83
22.74
14
Pakistan
1,126
959
937
-10.87
13.98
15
Thailand
1,079
955
898
-13.37
14.78
16
Hungary
928
934
790
5.11
-0.24
17
Czech Republic
884
602
576
-27.75
13.55
18
Cambodia
643
587
566
-10.32
19.77
20
Mauritius
636
550
499
-14.88
7.73
32
Madagascar
196
222
237
15.43
28.21
34
Myanmar
457
237
222
-49.45
10.75
China and Hong Kong 16,108 22,417
21,802
42.06
13.72
Note: The same as Table 1.
Source of data: Eurostat.
1.2. Garment Exports to the European Union
China and India also expanded garment exports to the EU in 2005. The growth rates
for the two countries up to the third quarter of the year were 54.41 percent and 33.74 percent,
respectively (Table 2). China’s growth rate for January-October was lowered and even smaller
than the world average of 10.74 percent in 2006. India’s growth rate was also attenuated to
10
17.65 percent.
An interesting fact is that China’s relatively sluggish growth for January-October
2006 was partially offset by a dramatic increase of 103.91 percent in garment exports from
Hong Kong. It is possible that the garments that were crowded out due to the renewed
restrictions might have found a way out through Hong Kong. The sum of exports from China
and Hong Kong, however, grew by a still moderate rate of 13.72 percent. Since the value of
exports from Hong Kong is far smaller than for China, such a high growth rate does not look
impressive if the trends in garment exports from the two economies are juxtaposed in a
diagram (Figure 1).
Figure 1. Exports of Knit and Woven Garments to the EU15 from China and Hong Kong
January-October: Million US$
20,000
18,000
16,000
14,000
12,000
10,000
8,000
6,000
4,000
2,000
0
2004
2005
China
2006
Hong Kong
Source of data: The same as Table 2.
Another notable observation is that the low-income countries which succeeded in
11
expanding garment exports to the United States, such as Bangladesh, Cambodia, Indonesia
and Pakistan, reduced the values of garment exports to the EU in 2005. In fact, there is good
reason for LDCs to perform worse than non-LDCs. The EU had given up import quotas for
LDCs even before 2005 (Bhattacharya and Rahman, 2001; p. 12 and other places). Therefore,
the MFA phase-out that took place in 2005 did not provide any direct favors to the LDCs.
Since the rest of the countries generally received a favorable effect from the removal of the
quotas, relatively speaking, LDCs received unfavorable impacts.
In 2006, by contrast, many developing countries displayed drastic growth in garment
exports to the EU. One of the most impressive source countries is Vietnam, which increased
its exports by 52.61 percent. There are many Asian exporters whose growth rate was higher
than the world average for January-October 2005-06, such as Bangladesh, Indonesia, Sri
Lanka, 4 Pakistan, Thailand, Cambodia and Myanmar. 5 Madagascar, which is an LDC
neighboring the African continent, recorded significant growth in garment exports to the EU
in both 2005 and 2006. 6
1.3. Garment Exports to Japan
Japan has never imposed any quotas on imports of textiles and clothing because it
had been an exporting country for textiles and clothing, and had asked the United States and
European countries for trade liberalization in the past. Therefore, there was no strong
4
See Arai (2006) and Tilakaratne (2006) on the garment industry in Sri Lanka.
5
For more information on the garment industry in Myanmar, see Kudo (2005a, b) and Kyaw
(2001).
6
Concerning Madagascar’s garment industry, see Razafimahefa (2006).
12
momentum for the kinds of structural changes that the United States and the European Union
faced in the beginning of 2005. Thus, no visible change appears in the composition of
garment imports by source country in Japan for 2005-2006 (Table 3).
China has been dominant in terms of its share of Japan’s garment imports. China
made up 82 to 84 percent of Japan’s garment imports every year between 2004 and 2006. Italy
was the second greatest exporter of garments to Japan for 2004-2006. However, the scale of
the second greatest exporter is far smaller than that of China. The value of Italy’s garment
exports has gradually decreased since 2004 up to 2006, while its share of Japan’s garment
imports modestly declined from 4.9 percent in 2004 to 4.2 percent in 2006. Vietnam follows
Italy with a share of 2.7 percent in 2004, which slightly increased to 2.8 percent in 2006. Thus,
irrespective of the structural changes undergone in the other two greatest markets for
garments, Japan has been isolated from it and has maintained its composition of exporters as
it was before the MFA phase-out.
13
Table 3. Exports of Knit and Woven Garments to Japan
Amount (Million US$)
Rate of Change (%)
2004
2005
2006
2005/04
World
20,460
21,188
22,380
3.56
5.62
1 China
16,862
17,448
18,668
3.48
6.99
2 Italy
995
965
946
-2.96
-1.95
3 Vietnam
548
588
616
7.30
4.69
4 Korea, South
265
374
302
41.11
-19.05
5 Thailand
231
237
241
2.31
1.89
6 United States
224
259
226
15.56
-12.53
7 France
221
191
171
-13.41
-10.58
8 India
107
141
171
31.63
20.94
9 Indonesia
117
115
135
-1.95
17.64
10 United Kingdom
98
85
77
-13.42
-9.69
11 Myanmar
45
53
71
17.50
35.57
22 Bangladesh
22
22
24
1.14
6.56
31 Cambodia
10
8
14
-11.99
61.53
26
14
8
-46.75
-45.18
Rank
Origin
36 Korea, North
Note: The same as Table 1.
Source of data: Japan Customs.
2006/05
Finally, from the point of view of facilitation of exports from LDCs, Japan’s de
facto performance in opening its market to the LDCs is not impressive at all. Bangladesh and
Cambodia, which are among the greatest exporters to the United States and the European
Union, each make up only 0.1 percent of Japan’s total garment imports. Another LDC, the
only one to be exporting more garments to Japan, is Myanmar which made up 0.3 percent in
2006. Thus, whatever the systemic arrangements are, Japan is not a hospitable garment
market for any LDC.
14
2. Two Dynamic LDCs: Bangladesh and Cambodia as Garment Exporters
2.1. Overview of Garment Exports from Bangladesh and Cambodia 7
Before the MFA phase-out, most critics claimed that since multinational firms
always look for the best combination of locations for their factories in order to minimize
production costs, they will concentrate their production in only a few places in the world and
withdraw their capital from anywhere else. Then, the garment industry in the low-income
exporters would collapse because of the low level of technology incorporated into the shallow
accumulation of physical and human capital, poor physical and institutional infrastructure,
and distance from the main markets. Among the losing low-income countries, Bangladesh and
Cambodia were considered to be the most vulnerable because they rely on clothing for as
much as three quarters of the composition of all export commodities. Even inside the two
countries the owners of garment factories widely publicized their distressed situation and
asked their governments and international society for assistance. Most of the media in the two
countries also stated that the export-oriented garment industries in the two countries were
about to lose their competitiveness and decrease both exports and production. Therefore, the
critics assumed that the clothing industries in Bangladesh and Cambodia were on the brink of
extinction, and as a result, they rarely discussed positive factors in support of the growth of
the two countries as strong garment exporters.
Contrary to the critics’ predictions, and fortunately for the two countries,
Bangladesh and Cambodia have fared successfully since 2005, and their good performance
7
Yamagata (2006a) is a review of the garment industry of the two countries from similar
points of view.
15
does not seem to be attributed solely to the agreements made by China with the United States
and the European Union because of the following observation.
Figure 2. Month-to-Month One-Year Growth Rates for Exports of Garments to the United
States (%)
160.00
140.00
120.00
100.00
80.00
60.00
40.00
20.00
0.00
-20.00
-40.00
Jan05/04
Feb05/04
Mar05/04
World
Apr05/04
China
May05/04
Jun05/04
India
Jul05/04
Vietnam
Aug05/04
Sept05/04
Bangladesh
Oct05/04
Nov05/04
Dec05/04
Cambodia
Source: The same as Table 1.
Figure 2 displays the month-to-month one-year growth rates of garment exports to
the United States. The rates incorporate the growth in garments for a month in 2005 as against
the same month in 2004. It is evident that China achieved extremely high rates of growth
throughout 2005. Surprisingly, the value of garment exports in February 2005 was 140
percent higher than that in February 2004. The rate for June was also over 100 percent.
Although the growth rate declined towards the end of 2005, it still kept only a little below 20
percent in the last two months in the year. The decline might have been affected by the
16
sentiment spread over the pressure to depress China’s garment exports to the United States
and the EU.
It is noteworthy that even during the high time for China, when it entertained an
extremely high growth in garment exports in the first half of 2005, Bangladesh and Cambodia
maintained a high 20 to 30 percent level of growth in garment exports to the United States.
Their growth rates were generally a little below that of India during the year. However, they
are distinct from Vietnam, whose growth rates were negative during the second and third
quarters of 2005 and where positive growth was recovered only after the renewal of the
quantitative restriction system on China’s garment exports to the United States. In other
words, the steady growth in garment exports from Bangladesh and Cambodia looks robust
compared to what occurred in China.
Figure 3. Garment Exports from Bangladesh (Million US Dollars)
7,000
6,000
5,000
4,000
3,000
2,000
1,000
19
83
-8
4
19
85
-8
6
19
87
-8
8
19
89
-9
0
19
91
-9
2
19
93
-9
4
19
95
-9
6
19
97
-9
19
8
99
-2
00
20 0
01
-0
2
20
03
-0
4
0
Total Exports
Source: MOF (2005).
17
Garment Exports
Export-oriented garment exports from Bangladesh were initiated in the beginning of
the 1980s (Bhattacharya and Rahman, 2001; Hoque, Murayama and Rahman, 1995;
Murayama, 2006; Rhee, 1990; Zohir and Paul-Majumder, 1996). A Korean investor was
deeply involved in the inception of the business in Bangladesh. In the first half of the 1980s
the number of garment exports from Bangladesh was almost nil (Figure 3). But then garment
exports grew rapidly, so that in the beginning of the 1990s garments made up about a half of
total exports from Bangladesh. The growth has continued almost without interruption and the
value of garment exports reached three-quarters of the value of total exports at the end of the
1990s. Though a negative impact from September 11 is apparent in 2001, garment exports
quickly picked up after that. Thus, the rapid growth of garment exports has continued for a
quarter of a century with little disturbance.
Figure 4. Garment Exports from Cambodia (Million US Dollars)
2500
2000
1500
1000
500
0
1995
1996
1997
1998
1999
Total Exports
2000
2001
2002
2003
Garment Exports
Sources: (1995-2001) Hach and Acharya (2002), Table 3.4, p. 19;
(2002-2003) Sothea and Hach (2004).
Cambodia’s growth in garment exports is more impressive than that of Bangladesh
18
in a sense. While the average annual growth rate 8 in the nominal value of garment exports
from Bangladesh for 1983/84-2003/04 is 24.4 percent, the same growth rate for Cambodia for
1995-2003 is 48.3 percent. For less than a decade the garments became the dominant export
commodity, making up three-quarters of Cambodia’s total exports. This performance appears
even more impressive once the serious gun battle occurring in 1997 is taken into account
(Barron, 2003). Irrespective of the incident, the growth trend in garment exports was not
disrupted. More astonishingly, foreign direct investment in the garment industry in Cambodia
even increased in 1997 (Thoraxy, 2003, pp. 38-43; Yamagata, 2006b, pp. 90-91). This
anecdote testifies how strong the growth momentum of the industry at that time was. Hach,
Huot and Boreak (2001), Salinger, et al. (2005), and Vuthy & Hach (2007), also demonstrate
the strengths of the garment industry in Cambodia.
2.2. Features of the Garment Industry in Bangladesh and Cambodia
There are interesting features of the garment industry in Bangladesh and Cambodia,
which might be factors in determining the admirable performance in garment exports of the
two countries. One feature is shared by both countries and the other two features are distinct
between the two countries.
High Profitability on Average
The similarity is in the high average profitability of the export-oriented garment
8
The average growth rate is given by the regression of the logarithm of the nominal value of
garment exports on a time trend.
19
business. This observation is based on two firm-level surveys conducted by the Institute of
Developing Economies (IDE) in cooperation with research institutes in Bangladesh and
Cambodia (Fukunishi et al., 2006; Yamagata, 2006b).
Figure 5. Distribution of Firms by Profit-to-Sales Ratio: Bangladesh
No. of firms
24
20
16
12
8
4
0
0.0
12.5
25.0
37.5
50.0
62.5
75.0
87.5
(%)
Profit-to-Sales Ratio
Note: The mean, median and standard deviation are 43.1, 42.5 and 20.2, respectively.
Source of data: Fukunishi et al. (2006).
Figures 5 and 6 are diagrams depicting the two data sets which are comprised of 222
sample firms for Bangladesh and 164 sample firms for Cambodia. Details on the data for
Bangladesh can be found in Fukunishi et al. (2003), and for Cambodia, in Yamagata (2006b).
Both diagrams are histograms of the sample firms by profit-to-sales ratio. 9 It is evident from
9
The definition of profits in these papers is sales minus intermediate inputs, workers’
remuneration, energy, rent for buildings and land, interests, and insurance fees. The present
value of machinery is estimated for the data for Bangladesh collected in 2001, which is not
referred to in this paper because of inconsistencies with the Cambodia data in terms of timing
of collection. See Bakht et al. (2006) for the details on the 2001 data.
20
Figure 5 that there were many firms with considerably high profit-to-sales ratios in
Bangladesh in 2003. Most of the sample firms exhibit profit-to-sales ratios as high as 30 to 50
percent. There happened to be no sample firms recording negative profits in this data set.
Figure 6. Distribution of Firms by Profit-to-Sales Ratio: Cambodia
No. of firms
14
12
10
8
6
4
2
0
-60
-40
-20
0
20
40
60
80
100 (%)
Profit-to-Sales Ratio
Note: The sample size for this diagram was reduced to 127 firms due to the
elimination of samples with insufficient information (18 firms) and with negative
value added (19 firms). The mean and median of the profit-to-sales ratios are 30.20
percent and 24.90 percent, respectively. The standard deviation is 35.58.
Source: Yamagata [2006b], Figure 5.
The distribution of sample firms in Cambodia also shows that most of the firms
exhibit positive profits (Figure 6). The mean and median of the profit-to-sales ratios are 30.20
percent and 24.90 percent, respectively. It is evident that there are quite a few firms
demonstrating ratios of 70 to 100 percent, which increased the standard deviation of the ratio
by as much as 35.58 percent. Thus, for many firms the export-oriented garment business is
profitable in Cambodia.
21
Size and Number of Firms
An interesting difference between the garment industries in Bangladesh and
Cambodia is that the industry in Bangladesh is comprised of many relatively small firms,
while in Cambodia it is composed of a relatively small number of large firms. Table 4 is
formulated with the member list of the Bangladesh Garment Manufacturers and Exporters
Association (BGMEA), which is the largest industrial association of export-oriented garment
firms in Bangladesh, and the equivalent organization in Cambodia, which is the Garment
Manufacturers Association in Cambodia (GMAC). As is sharply evident from Table 4, the
number of firms is fifteen times greater in Bangladesh than in Cambodia, while the value of
garment exports in Bangladesh was only four times greater than in Cambodia in 2003
(compare Figures 3 and 4). This contrast is more accentuated by the fact that there is another
influential industrial organization of export-oriented knitwear-producing firms in Bangladesh,
which has more than 600 member firms. 10
Table 4. Number of Firms and Workers in Export-oriented
Garment-producing Firms in Cambodia and Bangladesh in 2003
Bangladesh
Cambodia
3,115
399
313
373
196
903
559
1,098
Number of firms
Average number of workers
Median of the number of workers
Standard deviation of the number of workers
Source: Member lists of the Garment Manufacturers Association in Cambodia
(GMAC) obtained in 2003 and the Bangladesh Garment Manufacturers and
Exporters Association (BGMEA) (2003).
10
This is the Bangladesh Knitwear Manufacturers and Exporters Association (BKMEA),
specializing in the knitwear business. The core members started the knitwear business in a
port town, Narayanganj, which is 17 km south-east of the capital city of Bangladesh, Dhaka.
Some firms are members of the BGMEA and the BKMEA at the same time. The knitwear
industry in Bangladesh is analyzed by Bakht et al. (2006).
22
Sources of Capital
This first difference in scale and number of firms between the garment industries in
Bangladesh and Cambodia seems to be caused by the second difference in source of capital.
The surveys conducted in 2003 are referred to again in Table 5. The table demonstrates a stark
contrast between the two countries in terms of the source of capital at present. In Bangladesh
the involvement of foreign capital is relatively low, 11 while it is actively involved in
Cambodia. According to the data set, a majority of sample firms were 100 percent
foreign-owned and the capital came from Hong Kong, Taiwan and China (Yamagata, 2006b, p.
92). As mentioned before, the export-oriented garment business was initiated through the
deep involvement of a Korean firm in Bangladesh. At least in the initial phase, Korean
investors led the development of the garment industry in the country, and they still keep a
certain presence in Bangladesh. However, as local firms more rapidly increased, even in the
downtown areas of big cities such as Dhaka, Chittagong and Narayanganj, the relative
presence of foreign capital was lessened in Bangladesh. Amid such an emergence of small
local firms, Bangladesh has maintained dramatic growth in garment exports for a quarter of a
century as demonstrated in Figure 3.
11
A caveat is that large firms, which are more likely to have involvement from foreign
capital than small firms, might be underrepresented in the data for Bangladesh, because a
large firm was more likely to decline the interview than a small firm. For details, see
Fukunishi et al. (2006, p. 84). However, the general tendency towards the relatively low
profile of foreign-owned firms and joint ventures is certain even if that under-representation
is taken into account.
23
Table 5. Sources of Capital: From the Surveys Conducted in 2003
Bangladesh
Cambodia
100% owned by foreigner
Joint venture with local investors
Purely local
Others or no answer
2
0
220
0
125
7
14
18
All sample firms
222
164
Source: Fukunishi et al. (2006), Yamagata (2006b).
Concluding Remarks
This paper displays the structural changes in the world garment trade which took
place as post-MFA responses. There was remarkable shuffling among the source countries for
garment exports towards the two greatest garment markets in the world, namely the United
States and the European Union. China and India increased their garment exports to the two
markets tremendously in the first half of 2005. After renewed quantitative restrictions on
Chinese exports were agreed, the growth rate of China’s garment exports was considerably
lowered.
In the meantime, two LDCs, namely Bangladesh and Cambodia, overturned the
predictions and have emerged as tough exporters of garments. The two countries maintained
rapid growth even during the high time for China, when it entertained triple-digit growth, and
have continued steady expansion in garment exports to the two markets so far.
Amid these structural changes Japan has been isolated from visible impacts of the
MFA phase-out. The Japanese garment market looks static in the sense that the market gets
along with only familiar counterparts and appears to be numb from dealing with emerging
exporters.
24
Nobody knows for sure what will happen after 2008. However, the renewal of
quotas on Chinese garment exports revealed that the non-discrimination principle which the
WTO earnestly advocates is not strictly applicable to trade between big economies. Thus,
there is no guarantee that the renewed quantitative restrictions will be completely lifted and
the trade in textiles and clothing with China will be thoroughly liberalized by the United
States and the European Union in 2008.
Meanwhile, Bangladesh, Cambodia and some other low-income countries may
penetrate more into the markets of developed countries until either labor disputes, wage
increases, skilled labor shortages or insufficient physical and institutional infrastructure
becomes a bottleneck to further expansion of the garment industry. They have somehow
dispensed with addressing those problems thoroughly so far. If they handle those issues
cleverly, they would become really competitive, as commented on with reference to the
garment industry in Bangladesh by US Trade Representative Rob Portman at the WTO
ministerial meeting in Hong Kong in December 2005. 12
12
An article contributed by Associated Press correspondent Foster Klug was published in
several media. The article contains the following paragraph: “They (Bangladesh) are
extremely competitive, globally competitive, and that creates an issue for us domestically that
I don’t think we’ll be able to overcome in the next 24 hours,” said U.S. Trade Representative
Rob Portman.” Please refer to the Financial Express for December 18, 2005, a newspaper
published in Bangladesh, among others.
25