Nonlinear effects of oil prices on inflation, growth, budget deficit, and unemployment
Bạn đang xem bản rút gọn của tài liệu. Xem và tải ngay bản đầy đủ của tài liệu tại đây (854.52 KB, 17 trang )
Nguyen Thi Ngoc Trang & Dinh Thi Thu Hong. / Journal of Economic Development 24(1) 75-91
75
Nonlinear effects of oil prices on inflation,
growth, budget deficit, and unemployment
NGUYEN THI NGOC TRANG
University of Economics HCMC –
DINH THI THU HONG
University of Economics HCMC –
ARTICLE INFO
ABSTRACT
Article history:
In oil-exporting countries such as members of the OPEC, fluctuations
in oil prices exert a significant impact on the domestic economy. Currently, a sharp reduction in oil prices results in several adverse effects;
however, for such a crude-oil exporter that is also an importer of petroleum products as Vietnam, does a rise or drop in oil prices is beneficial to its development? This paper attempts to determine the oil
price threshold while analyzing oil price effects on several macro factors, such as inflation, GDP growth, budget deficit, and unemployment rate over the 2000–2015 period. Using TVAR model, we detect
an oil price threshold of USD27.6/barrel. Moreover, an increase in the
price of oil, which exceeds this threshold, will cause a rise in inflation,
budget deficit, and unemployment rate. Still, there is no significant
evidence of the impact of oil prices on GDP growth.
Received:
Mar. 17, 2016
Received in revised form:
May 19, 2016
Accepted:
Dec. 31, 2016
Keywords:
Oil price impact
TVAR model
Oil price threshold.
76
Nguyen Thi Ngoc Trang & Dinh Thi Thu Hong / Journal of Economic Development 24(1) 75-91
1. Introduction
Similar to other kinds of materials, oil is
one of the essential energy sources for manufacture and transport of goods. Oil prices,
therefore, impact positively on production
and consumer prices, and on the other hand
their fluctuations should lead to temporary
reduction in the total output as there is a
pause in corporate investment under uncertain circumstances or due to rising costs in
reallocation of resources.
Despite being one of the crude oil exporters, due to limited domestic supplies and reserves, Vietnam has imported large quantities of oil products annually to respond to
domestic demand. Thus, the economy seems
to be sensitive to oil price fluctuations, compared to others with larger oil supplies.
Moreover, Vietnam’s oil prices are affected
greatly by price control and intervention policies as adopted by the Government.
Thus, the issue of response of an economy to oil price shocks receives rapt attention of both academia and policy makers. In
fact, much research addresses the relation
between oil prices and macro variables for
the cases of the US and OECD countries, or
a group of Asian countries (excluding Vietnam), while a few studies conducted in Vietnam inspect such macro factors as growth,
inflation, public expenditure, or unemployment rate, albeit with inadequate examination of effects of oil price shocks on these
factors.
To fill this gap we focus our investigation
on these relations in contrast to other studies
on the same topic, using TVAR estimation
to explore the existence of any oil price
threshold that alters the impact of oil price
shocks on the economy, besides the impulse
response analysis to examine oil price effects on these four macro variables.
2. Theoretical foundation
2.1. Oil price fluctuations and their impacts on the economy
Oil price effects through total supply–
total demand relation
According to the Keynesian theory, high
costs of production materials (oil prices)
would give rise to production costs and consumer prices, reducing real wages and
thereby the labor supply. This is conducive
to a negative relation between oil prices and
economic efficiency, yet a positive correlation between oil prices and other prices as
well as unemployment rate. From the standpoint of oil demand and inputs in the production function including labor, capital, and
energy, when oil prices rise, firms will have
to decide between reduced degree of oil use
and higher production costs, thus causing a
reduction in output. In addition, rising crude
oil prices result in almost instant increases in
the prices of alternative fuel sources or oil
products, causing firms to give consideration of whether they should make less oil use
or accept rising costs and consequently causing a drop in the growth rate and productivity.
Hamilton (1983) initiated approaches to
demonstrate that a rise in oil prices could
negatively affect the macro efficiency.
Bernanke (1983) argued that when firms are
Nguyen Thi Ngoc Trang & Dinh Thi Thu Hong. / Journal of Economic Development 24(1) 75-91
aware of increasing uncertainties about future oil prices, it is best to postpone their investment decisions, which leads to lower total output. Particularly, as firms have to face
the choice of technology pertaining to energy efficiency, the more volatile the oil
prices, the more important their decision to
defer investments.
Supporting this viewpoint, Ferderer
(1996) documented that the instability derived from oil price shocks causes a decline
in investment demand, arguing for a negative correlation between oil prices and output but their positive association with inflation. Meanwhile, if consumers anticipate
that an increase in energy prices is temporary, they may have to save less or borrow
more, thereby causing a decrease in real balance and an increase in prices (Cologni &
Manera, 2008). Thus, one can see that rising
oil prices are attributable to not only economic slowdown but also increased inflation.
Given goods supply, rising oil prices will
reduce output as this signals that the availability of primary inputs for production will
decline. As a consequence, the growth rate
and productivity drop, and lower productivity growth reduces rates of increase in real
wages and increases unemployment (Brown
& Yucel, 1999, 2002). Thus, oil price shocks
may increase the marginal cost of production in many fields, diminishing output and
therefore causing higher unemployment
rates. In addition, higher oil prices raising
the costs of inputs are associated with reducing degrees of investment and affect volumes of output.
Another transmission channel of oil price
77
shocks to economic activities is the wealth
shift, caused by rising oil prices, from oil importers to oil exporters (Fried & Schultze,
1975). Higher oil prices can be regarded as
a kind of tax imposed by oil exporters on oilconsuming nations. Increases in income
earned by the population in oil-exporting
countries will boost consumer demand or
demand for exports from oil-importing
countries, which partly offsets the decline in
their domestic demand.
According to the purchasing power parity (PPP) theory, increasing demand for
manufactured goods from oil-importing
countries will lead to adjustments to the exchange rate in order to keep constant the aggregate demand in these countries. Nevertheless, Brown and Yucel (2002) maintained
that if prices are rigid, a reduction in demand
for goods, especially energy-intensive
goods, in the oil-importing countries, should
be conducive to higher unemployment rates
and reduced GDP growth rates. Previously,
Mork (1994) also explained this transmission mechanism using real balance effect,
whereby a rise in oil prices would increase
demand for money. When there is no corresponding increase in money supply, higher
interest rates will have an effect on the
growth rate.
Effects of oil prices through firms’ and
employees’ responses
Some indirect effects of oil prices on inflation are behavioral responses of enterprises and employees. For non-energy goods
and services offered by firms, increased production costs can be shifted into higher consumer prices, while employees may react to
increases in the cost of living by requiring
78
Nguyen Thi Ngoc Trang & Dinh Thi Thu Hong / Journal of Economic Development 24(1) 75-91
higher wages. In such a circumstance a decrease in real wage balance could produce
negative effects on the wealthiness of the
household and therefore on consumption
and output (Cologni & Manera, 2008).
Particularly, oil price shocks are likely to
increase the marginal cost of production in
many energy-intensive production sectors
and lead firms to a switch to the application
of new, less energy-intensive production
modes. This change results in a reallocation
of capital and labor between production areas, which may affect long-term unemployment. Since work skills features area-based
specialization and it takes certain time to
search for jobs, the absorption of labor
would tend to lengthen. In other words, localized shocks will lead to increased unemployment rates due to the reallocation of labor resources. Loungani (1986) argued that
if the oil price increase lingers, it can alter
the structure of production and have a significant impact on unemployment.
Effects of oil prices through monetary
policy channel
A few other studies (Tatom, 1988;
Bernanke et al., 1997) ascribed the monetary
policy behavior to a channel for economic
effects of oil price shocks. With the goals of
enhancing employment opportunities and
stabilizing prices, interest rate could be allowed to rise to curb inflation but could also
be accompanied by unexpected drop-offs in
demand. Additionally, if the response of
prices is slow, then this policy could cause a
large increase in the unemployment rate. On
the other hand, to tackle a drop in aggregate
demand and facilitate output stability, the
central bank will adopt lower interest rates
to temporarily offset losses in real GDP,
which has a direct impact on prices, and inflation continues to rise. As a result, increased oil prices will affect the potential
output in a complicated fashion. In addition,
one can find that following an oil price
shock, the energy-intensive parts of the
economy would become obsolete and need
to be replaced over time. To this extent inflation pressures could be even higher, so
relatively more tightened monetary policy is
necessary to bring inflation down to the target. Bernanke (2004) documented that responses of the central bank to inflationary
pressures caused by rising oil prices should
be reliant upon the overall conditions of the
economy. If inflation levels remain low
within the range allowed, it is not advisable
to intervene by tightening monetary policy.
Conversely, if recent oil price shocks do
cause inflation to rise to the upper bound and
the prices are forecast to keep on increasing,
then it truly is.
Accordingly, most macroeconomic theories and recent studies suggested that increased oil prices have a negative influence
on the economy, whether it is direct or indirect, through higher inflation or unemployment rates but lower growth rate. Moreover,
depending on responses of monetary policy,
increases in the price of oil can affect differently on growth. Empirical research was also
developed to provide more evidence to substantiate these findings.
2.2.
Other relevant studies
Adverse effects of oil price shocks
One of the first investigations into the
impact of increased oil prices on real income
Nguyen Thi Ngoc Trang & Dinh Thi Thu Hong. / Journal of Economic Development 24(1) 75-91
in the US and other developed nations is
Hamilton (1983, 2011), who found a significant and negative correlation between oil
price changes and real GNP growth of the
US, and their positive correlation with unemployment rate. Most American economic
recessions were suggested to be driven by
sharp increases in the price of oil. Therefore,
wide and unpredictable fluctuations of oil
prices have enabled much research on their
relations with macro variables such as real
GDP, prices, unemployment, and real investment in different countries. Most of
these studies, however, were conducted for
the case of the US or obtained the sample of
developed countries; only a few highlight
the landscape of Asian countries, albeit excluding Vietnam. These studies have also
shown undesirable effects of increases in oil
prices on the macro variables although these
may vary according to each specific period
or country. Thus, the puzzle is whether reduction in oil prices exerts a positive impact
on the economy, which stimulates a line of
research to address the nonlinear impact of
oil price shocks on the economy.
Non-linear effects of oil price shocks
Increased oil prices are often accompanied by lower output, but reduced oil prices
do not contribute to higher output. The reason for such asymmetric fact lies in reallocation effect and adjustment cost (Hamilton,
1996; Cunado & Gracia, 2003; Huang et al.,
2005). Rising oil prices lead to the shrinking
of total supply as firms reduce their output
to cope with higher input costs, and this is
also conducive to lower aggregate demand
because of the insecurity as can be felt by
79
customers when they have to make investment decisions. Furthermore, increases in
the oil of price result in the economic reallocation of energy, from the energy-sensitive
sector to the energy-efficient one. All these
factors combine to produce the effect on
slowing down economic growth. On the
other hand, lower oil prices stimulate production of firms and household spending,
but a reallocation by sector in the opposite
direction should stunt the growth. In addition, the rigidity of nominal wages (capital
having been revised up after oil price increases) causes adjustment costs in the labor
market, which means that nominal wages do
not fall and production costs stay high.
Hence, lower oil prices cannot be deemed a
contributor to increased output.
Monetary policy has been suggested to
be a cause of asymmetric effect (Bernanke
et al., 1997), that is, the tightened or loosened policy can be adopted by the central
bank to respond to effects of increased oil
prices, whereas similar policy responses
seem not to have been a case in the event of
oil price reduction.
Other studies in favor of the asymmetric
effect of oil prices (Hooker, 1996; Mork et
al., 1994; Ferderer, 1996; Cunado & Gracia,
2005) suggested that output does not respond symmetrically to oil price shocks because there are application and development
of oil saving technologies or use of alternative resources during increased oil prices. In
contrast, for a drop in the price of oil, firms
immediately cease these types of investments to minimize sunk costs; hence, fewer
effects are exerted on the economy when oil
price decreases than when it increases.
80
Nguyen Thi Ngoc Trang & Dinh Thi Thu Hong / Journal of Economic Development 24(1) 75-91
In the context of Vietnam some empirical
investigations have been carried out to quantify oil price effects on macro factors (Nguyen et al., 2009; Narayan, 2010; Le & Nguyen, 2011; Nguyen & Tran, 2012; Pham et
al., 2015), which, however, captures inflation and GDP growth rates without consideration of unemployment or budget expenditure. Furthermore, these authors have not defined the oil price threshold at which oil
price changes exert favorable or adverse impact on the economy.
Thus, in order to address such a gap, this
study aims to analyze the effects of the price
of oil on macro variables, including inflation, growth, budget deficit, and inflation in
Vietnam and also to find out the oil price
threshold which governs the possible
changes.
3. Methodology
3.1.
Research model
We employ multivariate regression technique, using two-regime TVAR as follows:
∝ + 𝐴1 (𝐿)𝑦𝑡 + 𝜀1𝑡 𝑖𝑓 𝑞𝑡 ≤ 𝛾
𝑦𝑡 = { 1
∝2 + 𝐴2 (𝐿)𝑦𝑡 + 𝜀2𝑡 𝑖𝑓 𝑞𝑡 > 𝛾
where vector of yt comprises inflation,
budget deficit, growth and inflation rate.
yt = [OIL CPI DEFICIT GDP UNEMPLOYMENT]
where qt is a threshold variable (oil price), 𝛾
denotes the threshold value, and αi , i = 1, 2,
… is a 2x1 constant vector.
A lag polynomial features 𝐴𝑖 (𝐿) =
𝐴𝑖1 𝐿 + 𝐴𝑖2 𝐿2 + ⋯ + 𝐴𝑖𝑝 𝐿𝑝
where Aij is a 4x4p matrix, j = 1, 2, 3, …,
and L is a lag operator.
Conditional impulse response function
(CIRF) versus generalized impulse response
function (GIRF)
After the TVAR estimation, the next step
is to capture the impulse response function.
Given the nonlinear model, the response of
endogenous variables to a certain shock depends greatly on the past history, the state of
the economy and the extent of the shock to
be studied in period zero. The levels and
signs of all the shocks have effects on economic performance during the surveyed period, or a shock at period t may trigger a
switch of regime at period t+d, where d is
the estimated lag of the threshold.
In this study we adopt both kinds of functions with mutual effects, including: (i) regime-dependent impulse response function
(also known as conditional impulse response
function—CIRF); and (ii) generalized impulse response function (GIRF). CIRF describes the response of the system to a shock
in each regime identified through the inflation threshold that has been estimated. This
implies that different responses can only be
exhibited in an assumed regime, and CIRF,
therefore, is considered the linear response
function in the scope of a regime assumed.
Nevertheless, CIRF may not be compatible with the ultimate macro impact of a
shock if a shift in regime throughout the cycle of reaction is likely enough, demanding
consideration of the nonlinear impulse response analysis, which does not assume that
the system remains in a certain regime at the
start of the shock. For instance, a big enough
shock for a variable results in a shift of the
economy from the original regime. Generally, the nonlinear impulse response differs
Nguyen Thi Ngoc Trang & Dinh Thi Thu Hong. / Journal of Economic Development 24(1) 75-91
from its linear counterpart in that it depends
on the history of time series, as well as the
size or extent of the shock.
Accordingly, we perform analyses of
both CIRF and GIRF, and the latter is estimated using bootstrapping as suggested by
Balke (2000). Estimating GIRF is based on
the reference of an impulse response function to conditional changes in expectations.
The response at period k (from 1 to h) of the
variable y to the shock at period t (ut) is defined by: (i) differences in the expected values of y and the shock and particular historical condition (Ωt−1) of the shock at period t1; and (ii) the expected value of y in case of
no existence of such a shock (Koop et al.,
1996).
GIRFk = E (yt+k/ ut Ωt−1) - E (yt+k/ Ωt−1)
Following previous literature, we employ
bootstrapping as a simulation technique to
estimate the expected GIRF value. We consider the assumption that at the time of the
shock the model is under a particular regime.
In the first step initial values of actual and
adjacent lag values of endogenous variables
are selected corresponding to the historical
value (Ωt−1) for one of the defined regimes.
The number of sets of initial conditions
should be similar to that of observations in
each regime where the impulse response
function is estimated.
A series of shocks are next randomly selected from the remainder of the system. For
each series, a number of variables concerned
are simulated with the conditional model
based on a particular history being considered. The model allows for regime changes
during the simulation, which provides the
81
estimate E (yt+k/ Ωt−1). In the second step a
similar random series of shocks are used, but
in this case a superior shock (ut), equivalent
to the shock of one standard deviation of the
variable to be considered, is added at period
t to each series of shocks. This results in another estimate E (yt+k/ ut Ωt−1). The difference between the results of the two estimations creates a simulated value of GIRF.
This process is repeated 1,000 times for each
set of initial observations. The average value
of the simulated GIRF produces the final estimate of GIRF at period k with a given regime. The confidence band of each period k
is then determined from the standard error of
GIRF on the assumption that the shock follows a normal distribution. Afterward, this
process is used to generate different impulse
responses under other regimes.
3.2.
Data
This study applies quarterly data covering the 2000–2015 period to several variables, such as oil price (OIL), inflation (CPI),
growth (GDP), budget deficit (DEFICIT),
and unemployment rate (UNEMPLOYMENT). The data are retrieved from ADB,
Reuters, and GSO. Particularly, the oil price
(in USD) is chosen as the spot price of crude
oil on the Dubai market; inflation (%) is calculated by rate of increase in the consumer
price index (CPI); growth is measured by
GDP growth rate; unemployment rate (%) is
obtained in the form of the unemployment
rate recorded for urban areas; budget deficit
(%) is calculated as ratio of deficit to GDP.
Data on oil prices and CPI are monthly data,
so we take average to obtain quarterly data.
Due to unavailability of quarterly statistics
82
Nguyen Thi Ngoc Trang & Dinh Thi Thu Hong / Journal of Economic Development 24(1) 75-91
on budget deficit, Quadratic-match average
is also performed. The sample covers 64 observations. The study uses original data series to estimate the parameters in TVAR as
suggested by Pirovano (2012) for different
types of VAR models1.
Descriptive statistics reveal sharp fluctuations in crude oil prices over the study pe-
direction as the price of oil, the other three
factors tend to fluctuate in opposite direction, which can be observed through the statistics on their correlation coefficients.
4. Empirical results and discussion
Table 1
Data description
Oil
price
(OIL)
CPI
Budget deficit
(DEFICIT)
(UNEMPLOYMENT)
Mean
63.39
7.22
6.71
-0.60
4.71
Median
58.38
6.65
6.85
-0.59
4.65
Max
116.67
27.75
9.26
0.33
6.51
Min
18.24
-2.26
3.14
-1.33
2.88
Std. dev.
32.18
6.59
1.26
0.52
1.09
64
64
64
64
64
Obs.
GDP
Unemployment rate
Table 2
Correlation coefficients of variables
Correlation coef.
OIL
CPI
GDP
DEFICIT
OIL
1.0000
CPI
0.5869
1.000
GDP
-0.4284
-0.1558
1.000
DEFICIT
-0.0528
0.5779
0.5281
1.000
UNEMPLOYMENT
-0.8252
-0.3403
0.4222
0.2703
riod with their lowest and highest rates of
USD18.24/barrel and USD116.67/barrel in
Q4/2011 and Q2/2008 respectively. While
the CPI of Vietnam fluctuates in the same
4.1.
UNEMPLOYMENT
1.000
Testing for nonlinearity
Initially, we conduct a nonlinearity test
for TVAR against the linear VAR model, using oil price as a threshold variable. The
Nguyen Thi Ngoc Trang & Dinh Thi Thu Hong. / Journal of Economic Development 24(1) 75-91
threshold value is a turning point at which
oil price effects on macro variables vary
from being significant to being insignificant,
or vice versa. To check the null hypothesis
of linearity (m = 1 regime) against nonlinearity (m = 2 regimes), we adopt the modified
multivariate linearity test suggested by Hansen (1999) and Lo and Zivot (2001). The
Likelihood Ratio statistic LR is as follows:
^
𝐿𝑅01 = 𝑇(ln(𝑑𝑒𝑡 ∑
)
0
^
− ln(𝑑𝑒𝑡 ∑
))
1
where ∑^0 denotes the covariance matrix
estimated in the model under the null hypothesis and ∑^1 is the matrix estimated
using other alternatives. The nonlinearity
test results are reported in Table 3.
Table 3
LR test results
LR test for nonlinearity against linearity
LR statistic
185.4157
p-value
0.0000
Estimated threshold
27.6
In Table 3 p-value = 0 implies that the
null hypothesis can be rejected and that the
two-regime TVAR model, with the estimated oil price threshold of USD27.6/barrel
is suitable to measure oil price effects on the
Vietnam’s economy. The optimal lag selected for TVAR as per AIC is 1.
Table 4
Results of lag length selection
Number of
lags
AIC for TVAR with 1
threshold
1
17.00333
2
17.32921
3
19.38449
4
18.10672
83
Table 5 depicts the estimated results of
TVAR with the oil price employed as a
threshold variable. Oil price effects on
macro variables are insignificant for the first
regime, but significant mostly for the second
one. Additionally, observations on oil prices
above the threshold level (USD27.6/barrel)
account for a large proportion (76.19%);
hence, we focus on the second regime to analyze the response of the economy to oil
price shocks.
Oil price effects can be interpreted as follows: (i) below the threshold level of
USD27.6/barrel no substantial evidence is
found of their impacts on inflation, growth,
budget deficit, and unemployment rate; and
(ii) above this level a positive shock caused
by increased oil prices gives rise to inflation,
budget deficit, and unemployment rate, represented by their correlation coefficients at
1%, 10%, and 5% levels respectively in the
later term, whereas an insignificant effect is
found on GDP.
The results of positive effects of oil price
shocks on inflation and unemployment are
in agreement with the findings of Hamilton
(1983), Pindyck and Rotemberg (1983),
Gisser and Goodwin (1986), Ferderer
84
Nguyen Thi Ngoc Trang & Dinh Thi Thu Hong / Journal of Economic Development 24(1) 75-91
Table 5
TVAR estimation results using the price of oil as a threshold variable
Regime 1
Regime 2
OIL (-1) <= 27.6
OIL (-1) > 27.6
23.81%
76.19%
% of obs.
Regr.
coef.
t-value
p-value
Regr. coef.
t-value
p-value
(const.)
-0.8051
-0.0371
0.9712
-13.9612
-2.0068
0.0512
OIL (-1)
-0.2142
-1.6509
0.1332
0.1089
4.3624
0.0001
CPI (-1)
0.3859
1.4489
0.1813
0.5735
5.2865
0.0000
GDP (-1)
0.4321
0.7368
0.4800
0.4374
1.0454
0.3018
DEFICIT (-1)
7.1623
1.3693
0.2041
2.7107
1.8095
0.0775
UNEMPLOYMENT (-1)
1.5864
0.4345
0.6741
1.8834
2.0936
0.0424
AIC
17.0033
SIC
19.5889
SSR
681.4938
(1996), Brown and Yucel (2002), Tang et al.
(2010), Cunado and Gracia (2005), Cologni
and Manera (2008), Bernanke et al. (1997),
and Ran and Voon (2012). This is because
an increase in the price of oil has led to rising
production costs and consumer prices yet
declining investment demand.
Oil price effect on GDP growth: This
study finds neither significant impact of the
oil price shock on growth in GDP or output
in Vietnam, which is similar to Olomola and
Adejumo (2006), nor its more persistent effect than those of prices and currency on output and investment (Tang et al., 2010). As
also documented by Hamilton (1983) and
Burbidge and Harrison (1984), changes in
oil prices exert profound and negative influence on growth, but no evidence was produced for all observed terms. Thus, our finding on the oil price effect on growth is dissimilar to earlier studies in the context of Vietnam as can be explained by oil price effects on output through different responses
of monetary policy.
Oil price effect on budget deficit: The results are consistent with those of Rafiq et al.
(2009) for the case of Thailand, which suggested that during the Asian financial crisis,
the impact of oil price volatility are transmitted to the deficit. The effect, despite scarcely
verified owing to limited empirical evidence
as shown in previous investigations, well
matches the characteristics of the Vietnam’s
Nguyen Thi Ngoc Trang & Dinh Thi Thu Hong. / Journal of Economic Development 24(1) 75-91
economy during the study period due to several of the following reasons:
Increased oil prices raises production
costs, reduces firms’ earnings or tax revenues, and contributes to higher levels of
budget deficit.
Higher oil prices, in spite of being favorable to oil exploiters and oil trading enterprises, inevitably have adverse influence on
certain fields, such as transportation, production of fertilizers/plastics, exploitation of
natural resources, fisheries, metallurgy, and
most of the others. Along with exchange rate
fluctuations, the price of crude oil affects
greatly the cost of production and profitability of enterprises in the economy—the
source of budget revenue. Firms whose materials for production are derived from crude
oil would suffer a severe reduction in profit,
85
which contributes indirectly to larger deficit.
Budget revenue from crude oil tends to
shrink over the years.
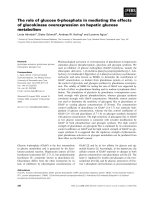
In fact, budget revenue from crude oil
sales, especially the proportion of crude oil
revenue to total revenue tends to decline (i.e.
increased oil prices do not contribute as
greatly to budget revenue as before). Even
during the year 2008 when increased oil
prices reach the highest level, contributing
crude oil revenue of VND89.6 thousand bil.
(increase of 16.4%, compared to that of
2007—VND76.98 thousand bil.), the proportion of crude oil revenue to total budget
revenue decreases from 24.37% (2007) to
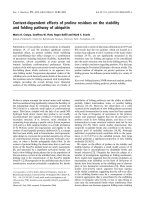
20.81% (2008) and significantly falls afterward. In 2015 the proportion amounts to approximately 7.1% (attributed to reduced
160.00
140.00
120.00
100.00
crude oil revenue
Thu
từ dầu thô (ngàn tỷ
(VND thousand bil.)
đồng)
80.00
proportion
total budget
%
Tổng thutongân
sách
revenue (%)
60.00
40.00
20.00
0.00
2000
2003
2006
2009
2012
2015
Figure 1. Contribution of crude oil sales to state budget
Source: GSO, MoF
86
Nguyen Thi Ngoc Trang & Dinh Thi Thu Hong / Journal of Economic Development 24(1) 75-91
crude oil prices), and as of 2016 it is predicted to stay at 5.37% in the event the average crude oil price remains of
USD60.00/barrel2.
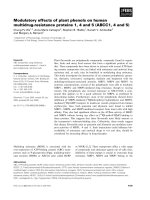
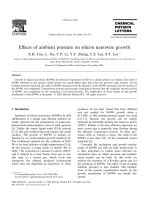
In the meantime, demand for imported
petroleum products is constantly on the increase to cater for manufacturing, services,
and consumer sectors.
increase spending for daily travel, thus forcing them to cut down consumption of other
goods or reduce savings. Increased freight
rates are associated with rising prices of consumer goods; thus, consumers would suffer
concurrent disadvantages derived from the
energy expenditure. This should contribute
to limited consumption and curtailed production, causing economic stagnation and
22
17
12
7
2
-3 2000
2003
2006
2009
2012
xuất (triệu
exports
(mil.tấn)
tonnes)
nhập
(triệu
imports
(mil.tấn)
tonnes)
exports
xuất (tỷ(VND
$) bil.)
imports
nhập
(tỷ(VND
$) bil.)
2015
Figure 2. Crude oil exports compared to petroleum/oil imports
Source: GSO and Vietnam Petroleum Association (VINPA)
Accordingly, higher oil prices result in
increased production costs yet lower firms’
profitability, thereby causing reduced
budget revenue or larger budget deficit.
In addition, there exist other indirect impacts such as rising oil prices attributable to
increased inflation; monetary policy can be
adjusted toward being more tightened in response to this by raising interest rates, which
in turn lift further costs or reduce firms’ investment, adversely affecting total state revenue3. From the perspective of consumers,
as the price of oil rises, households have to
little increase in the budget revenue from
consumer goods.
Impulse response analysis
As discussed in the Methodology Section, we perform a test on CIRF for each regime given a positive shock.
Nguyen Thi Ngoc Trang & Dinh Thi Thu Hong. / Journal of Economic Development 24(1) 75-91
Figure 3. Conditional Impulse Response Function (CIRF)
Note: responses of CPI, GDP, DEFICIT, and
UNEMPLOYMENT to the positive shock of
OIL, corresponding to the first and second regimes
87
88
Nguyen Thi Ngoc Trang & Dinh Thi Thu Hong / Journal of Economic Development 24(1) 75-91
The results of impulse response analysis
reveal that in Regime 1 with a shock of oil
price increase of one standard deviation, inflation increases by 0.9% during the next
two quarters and then reduces significantly
to equilibrium after four quarters. On the
other hand, regarding Regime 2 an oil price
increase of one standard deviation causes inflation to increase by 0.06% in over one
coming quarter and then decreases to the
equilibrium rate after four quarters. After
reaching the equilibrium the inflation rate
tends to drop during later terms.
Concerning the response of GDP growth
to the oil price shock, in Regime 1 when the
oil price increases by one standard deviation,
GDP reduces sharply by around 0.05% in
less than one next quarter to below the equilibrium rate and steadily rises afterward.
Meanwhile, in Regime 2, the response of
GDP to the oil price shock is quite different
from that in Regime 1: it declines gradually
by 0.14% and becomes stable after three
quarters.
As for budget deficit, in Regime 1 one
standard deviation increase in the oil price
shock entails increase in the deficit of 0.08%
after one quarter; it then reduces slightly and
continues rising after four quarters. The deficit response, nevertheless, is not similar in
the second regime: it constantly increases up
to the third quarter and decreases throughout
the next ones.
In the same vein responses of unemployment to oil price shocks are differentiated for
the two regimes. In Regime 1, an oil price
shock leads to increase in unemployment of
0.0025% after one quarter. After that, it declines and returns to equilibrium in the third
quarter but then steeply rises. Given Regime
2, the unemployment rate increases sharply
by approximately 0.008% right in the first
quarter and continues to mount up in the
next two ones; not until the fourth one does
it slightly reduce despite remaining high.
Finally, to inspect the possibility of a
shift from one regime to the other if the
shock is strong enough, we employ another
response function—GIRF. The results indicate differences as recorded from responses
of GDP, budget deficit, and unemployment
rate in Regime 1, whereas the CPI response,
in respect of both regimes, appears not to diverge from itself when CIRF is considered.
The evidence, once again, verifies vivid oil
price effects on CPI as well as no particular
shift from one regime to the other during oil
price changes. Similar results are obtained
concerning the other variables (plots of
GIRF are not reported due to space constraint).
5. Conclusion and policy implications
5.1.
Conclusion
The empirical findings from this study
demonstrate the nonlinearity of oil price effects on the Vietnam’s economy through
such indicators as inflation, growth, budget
deficit, and unemployment rate over the
2000–2015 period given both inspected regimes. The oil price threshold, as shown, is
USD27.6/barrel.
In Regime 1, we find no evidence of significant effects of the price of oil on all the
four macro variables. However, when oil
prices exceed the threshold level of
USD27.6/barrel in Regime 2, a shock of oil
Nguyen Thi Ngoc Trang & Dinh Thi Thu Hong. / Journal of Economic Development 24(1) 75-91
price increase has powerful impacts, which
result in rising inflation, deficit, and unemployment rate. The GDP response, particularly, is not statistically significant in Regime 2. These results are in line with relevant theoretical and empirical findings as
well as the reality of the Vietnam’s economy
in connection with the world’ crude oil
prices.
5.2.
Implications
In terms of oil prices below the threshold
(USD27.6/barrel), no significant evidence is
revealed of higher oil prices which affect inflation, growth, budget deficit, and unemployment rate. Still, due to the data series
demonstrating mostly their increase besides
little reduction over the study period, it is
imperative to have further research with
more conclusive evidence.
Considering higher oil prices, their adverse effects on a certain economy are recognizable. In long terms this negative side
can become a driving force for businesses,
inspire management to adopt policies that
encourage firms’ technological investment
toward economical and efficient use of energy sources, minimizing the need for oil usage. Also from the subjective perspective,
the impact should be taken as a motivation
for State’s and firms’ investments in the development of alternative fuel sources and increased use of them in production and daily
life.
Additionally, the empirical results suggest certain risks posed to the economy at
high oil prices, which demands price-related
prevention measures, as particularly taken
89
by oil importers or oil-based input users. Regarding managerial agencies, this is to motivate their continued development of derivatives market, satisfying the requirement for
risk prevention.
A declining share of budget revenue from
oil sales, the constantly reduced price of oil
since the end of 2014, and the empirical results which show that rising oil prices will
not help improve the deficit raise an issue
that the State revenue should be specifically
generated from domestic services and manufacturing to ensure stability and sustainability. Moreover, this should lead to further
issuance of policies on regulating oil prices
or those pertaining to corporate investment
and trading. Favorable conditions and support should, therefore, be provided to improve firms’ competitiveness and earnings,
as a means to cultivate more revenue
Notes
1 Pirovano (2012)
2 according to the 2016 budget plan approved by
the Government
3 This transmission channel is clarified in Bohi
(1991) and Bernanke et al. (1997).
References
Balke, N. S. (2000). Credit and economic activity: Credit regimes and nonlinear propagation
of shocks. Review of Economics and Statistics, 82(2), 344–349.
Bernanke, B. (1983). Irreversibility, uncertainty,
and cyclical investment. Quarterly Journal of
Economics, 98(1), 85–106.
Bernanke, B. (2004). Oil and the economy. Remarks at the Distinguished Series, Darton
College, Albany, Georgia, 10/2014.
90
Nguyen Thi Ngoc Trang & Dinh Thi Thu Hong / Journal of Economic Development 24(1) 75-91
Bernanke, B., Gertler, M., & Watson, M. (1997).
Systematic monetary policy and the effects of
oil shocks. Brookings Papers on Economic
Activity, 28(1), 91–157.
Bohi, D. R. (1991). On the macroeconomic effects of energy price shocks. Resources and
Energy, 13, 145–162.
Brown, S. P. A., & Yucel, M. K. (1999). Oil
prices and U.S. aggregate economic activity:
A question of neutrality. Federal Reserve
Bank of Dallas Economic and Financial Review, (Second Quarter), 16–23.
Brown, S. P. A., & Yucel, M. K. (2002). Energy
prices and aggregate economic activity: An
interpretative survey. Quarterly Review of
Economics and Finance, 42(2), 193–208.
notions. Journal of Money Credit Banking,
18(1), 95–103.
Hamilton, J. D. (1983). Oil and the macroeconomy since World War II. Journal of Political
Economy, 92(2), 228–248.
Hamilton, J. D. (1996). This is what happened to
the oil price–macroeconomy relationship.
Journal of Monetary Economics, 38(2), 215–
220.
Hamilton, J. D. (2011). Nonlinearities and the
macroeconomic effects of oil prices. Macroeconomic Dynamics, 15(S3), 364–378.
Hooker, M. A. (1996). What happened to the oil
price-macroeconomy relationship? Journal
of Monetary Economics, 38(2), 195–213.
Burbidge, J., & Harrison, A. (1984). Testing for
the effects of oil-price rise using vector autoregressions. International Economic Review,
25(2), 459–484.
Huang, B.-N., Hwang, M. J., & Hsiao, P.-P.
(2005). The asymmetry of the impact of oil
price shocks on economic activities: An application of the multivariate threshold model.
Energy Economics, 27(3), 455–476.
Cologni, A., & Manera, M. (2008). Oil prices,
inflation and interest rates in a structural
cointegrated VAR model for the G-7 countries. Energy Economics, 30(3), 856–888.
Koop, G., Pesaran, M. H., & Potter, S. (1996).
Impulse response analysis in nonlinear multivariate models. Journal of Econometrics,
74(1), 119–148.
Cunado, J., & Perez de Gracia, F. (2003). Do oil
price shocks matter? Evidence for some European countries. Energy Economics, 25(2),
137–154.
Le, V. T., & Nguyen, T. T. V. (2011). The impact
of oil prices, real effective exchange rate and
inflation on economic activity: Novel evidence for Vietnam. Discussion paper series,
Kobe University, 3/2011.
Cunado, J., & Perez de Gracia, F. (2005). Oil
prices, economic activity and inflation: Evidence for some Asian countries. Quarterly
Review of Economics and Finance, 45(1),
65–83.
Ferderer, J. P. (1996). Oil price volatility and the
macroeconomy. Journal of Macroeconomics, 18(1), 1–26.
Fried, E. R., & Schultze, C. L. (1975). Higher oil
prices and the world economy. Washington,
DC: The Brookings Institution.
Gisser, M., & Goodwin, T. (1986). Crude oil and
the macroeconomy: Tests of some popular
Loungani, P. (1986). Oil price shocks and the
dispersion hypothesis. Review of Economics
and Statistics, 58, 536–539.
Mork, K. A. (1994). Business cycles and the oil
market. The Energy Journal, (Special Issue),
15–38.
Mork, K. A., Olsen, O., & Mysen, H. T. (1994).
Macroeconomic responses to oil price increases and decreases in seven OECD countries. The Energy Journal, 15(4), 19–36.
Nguyen Thi Ngoc Trang & Dinh Thi Thu Hong. / Journal of Economic Development 24(1) 75-91
Narayan, P. K., & Narayan, S. (2010). Modelling
the impact of oil prices on Vietnam’s stock
prices. Applied Energy, 87(1), 356–361.
Nguyen, D. T., Bui, T., & Dao, N. T. (2009). Effects of increased petroleum and oil prices:
Some preliminary quantitative analyses (in
Vietnamese). VNU Journal of Science: Economics and Business, 25, 25–38.
Nguyen, T. L. H., & Tran, T. G. (2012). Effects
of oil price shocks on the Vietnam’s economy
and forecasts for the 2012–2020 period (in
Vietnamese). Institutional Research Project
2011–2012. Vietnam: University of Economics Ho Chi Minh City.
Olomola, P. A., & Adejumo, A.V. (2006). Oil
price shock and macroeconomic activities in
Nigeria. International Research Journal of
Finance and Economics, 3, 28–34.
Pham, T. H. A., Chu, K. L., Dao, B. N., Nguyen,
M. P., & Tran, H. T. (2015). Oil price fluctuations and their effects on the Vietnam’s
economy (in Vietnamese). Research report
2/2015. Vietnam: Banking Academy.
91
Pindyck, R. S., & Rotemberg, J. J. (1983). Dynamic factor demands and the effects of energy price shocks. American Economic Review, 73(5), 1066–1079.
Pirovano, M. (2012). Monetary policy and stock
prices in small open economies: Empirical
evidence for the new EU member states. Economic Systems, 36(3), 372–390.
Rafiq, S., Salim, R., & Bloch, H. (2009). Impact
of crude oil price volatility on economic activities: An empirical investigation in the
Thai economy. Resources Policy, 34, 121–
132.
Ran, J., & Voon, J. P. (2012). Does oil price
shock affect small open economies? Evidence from Hong Kong, Singapore, South
Korea and Taiwan. Applied Economic Letters, 19, 1599–1602.
Tang, W., Wu, L., & Zhang, Z. (2010). Oil price
shocks and their short- and long-term effects
on the Chinese economy. Energy Economics,
32(1), S3–S14.
Tatom, J. (1988). Are the macroeconomic effects
of oil price changes symmetric? Carnegie−Rochester Conference Series on Public
Policy, 28(1), 325–368.