Ebook Construction economics - A new approach (2nd edition): Part 2
Bạn đang xem bản rút gọn của tài liệu. Xem và tải ngay bản đầy đủ của tài liệu tại đây (3.13 MB, 173 trang )
Part
B
Protection and Enhancement
of the Environment
Chapter 9: Markets for Green Buildings and Infrastructure
147
Chapter 10: Market Failure and Government Intervention
163
Chapter 11: Environmental Economics
179
Reading 4
197
WEB REVIEWS: Protection and Enhancement of the
Environment
On working through Part B, the following websites should prove useful.
www.bre.co.uk
The Building Research Establishment is a research-based consultancy with
offices in England and Scotland. It has a particular expertise in the area of
sustainable construction and its website advertises its latest products. Up-to-date
information on the BREEAM schemes and whole life costing, introduced in
Chapter 9, is available at this site.
www.ends.co.uk
ENDS is an environmental data service, providing a daily news service on
European environmental affairs. The homepage provides the opportunity to
sample the organisation’s authoritative monthly report and has links to other
environmental resources on the web. The information can be used in
conjunction with all the chapter themes in this section – visit and see why it
claims to be the best environmental website.
www.foe.co.uk
For a different perspective, it is often interesting to look at information presented
by non-government organisations. The Friends of the Earth site, for example,
challenges the rise of corporate power. Pressure exerted by Friends of the Earth
contributed to the decision by the construction firm Amec to pull out of
building the Yusefeli dam in Turkey. Friends of the Earth’s website also has
extensive links to other governmental and non-governmental sites.
www.buildoffsite.org
As the name implies, Buildoffsite is an organisation formed to promote modern
methods of construction. It was established with government backing in 2005 to
create a step change in the application of off-site techniques within the
construction sector. It was initially set a target of raising expenditure on these
techniques tenfold to £20 billion by 2020. Its members are drawn from all
sectors of the UK industry, including developers, designers, contractors,
manufacturers, clients and government; the current membership list exceeds 60
organisations. The website contains links to events, publications, case studies
and a quarterly newsletter. As you will sense from Chapters 7 and 9, this site is
of increasing interest.
www.usablebuildings.co.uk
The Usable Buildings Trust was initially funded by the Building Services Journal
and the UK government. It is now registered as an independent charity that aims
to encourage green building design by focusing on performance in use. The
trust’s first project – the Post-Occupancy Review of Buildings and their
Engineering (PROBE) – ran from 1995 to 2002. These initial studies have a
separate link on the site. To date the trust has made a detailed post-occupancy
review of more than 30 green buildings, details of these can also be accessed
from this website. There is also a brief review of 30 books dealing with the
theme of ‘usability’, and some of these we have drawn from in this text.
146
69
Markets for Green Buildings
and Infrastructure
An important consideration for any firm seeking to control the market and stand
out from its competition is to satisfy, or create, a niche market – to produce a service
or product that is in some way different from its rivals. In economic terms this is
referred to as product differentiation. We have already discussed how in the
extreme case of perfect competition we assume that the market consists of
homogeneous products, in which each individual firm in the market produces an
identical product (or service) and has a horizontal demand curve. To express
it another way, in a perfectly competitive market there is only one specific
‘undifferentiated’ product (see Key Points 8.1).
Providing a firm can manage to differentiate its product or service from other
similar products – even if only slightly – it can gain some control over the price it
charges. Firms producing a differentiated product are able to achieve some
independence from their competitors in the industry. They should be able to raise
their prices, and thereby increase profits, without losing all their customers. Unlike
firms operating at the perfectly competitive extreme, they face a slightly downward
sloping demand curve. In fact, the greater a firm’s success at product differentiation,
the greater the firm’s pricing options – and the steeper the demand curve.
OPPORTUNITIES TO DIFFERENTIATE CONSTRUCTION
PRODUCTS
Economics textbooks usually emphasise that the opportunities to differentiate a
product or service in the construction industry are limited. Firms may be able to
market themselves as somehow superior to their competitors in terms of quality or
reliability, but they are always constrained by the large number of firms that
compete and produce close substitutes. Consequently, the ability of one firm to
significantly raise its prices above that of its competitors is restricted. Gruneberg and
Ive (2000: 92) extend this hypothesis. They argue that the tendering process creates
a further complication, as it is usually assumed that all those selected to submit
tenders are undifferentiated – equal, in terms of the service they are offering.
An important aim of this chapter, however, is to identify the economic
arguments that may encourage construction firms to take up the green challenge.
This depends upon firms in the industry taking the opportunity to differentiate their
product by moving away from traditional techniques to those that demonstrate
environmental awareness. It also involves paying attention to global, local and user
concerns if firms are to develop and construct green buildings and infrastructure.
At the time of writing, a construction firm producing environmentally sensitive
products would be able to distinguish itself so effectively from the majority that it
could secure short-term monopoly profits – that is, until the time when competitors
147
Protection and Enhancement of the Environment
recognise the benefits of following the same mould, bringing the market back to
something nearer to perfect competition and, in this case, bringing the market closer
to the idea of sustainability. A trend for sustainable construction is slowly emerging
and being taken up by some contractors and clients, and traditional specifications
are being challenged in favour of those that demonstrate environmental benefits.
The common characteristics of environmentally sensitive specifications are discussed
in the next section.
Emerging Green Markets
Even in manufacturing – with supply based on factory techniques and where
products are demanded and used by a single customer – it is difficult to develop a
market for environmentally superior products. In construction the challenge is even
more complex, as there are fewer standard prototypes and often the ‘users’ of
construction products are not the owners. As we have suggested in preceding
chapters, each construction product can be regarded as unique. Products are
assembled on site by a team of subcontractors. The large labour force is often one
stage removed from the agreement made between the client and the contractor. And,
as a final twist, the interests of the users are often different from those of the
investors that produce the original specification. This makes it difficult for those
supplying the products to final users to communicate effectively through market
signals. Yet it is in the marketplace where people display their green credentials.
It is therefore not surprising that green development in the construction industry
has been relatively slower than in manufacturing – but it is emerging. The most
activity has been seen in the commercial sector, with owner-occupiers beginning to
specify bespoke headquarters that reflect their corporate ethos. The level of green
activity within the residential sector, however, is not so evident, as the main
companies engaged in house building have been slow to see the market potential of
adopting an environmentally aware corporate image. There are some exceptions,
with some green developments by housing associations and some examples of
architect-designed homes – eco-homes – for environmentally conscious clients.
Finally, awareness is emerging in the sector specialising in infrastructure, which
could make an important contribution once it takes off. We now look at each of
these sectors in turn.
THE COMMERCIAL SECTOR
Each year, the largest amount of new building work is in the commercial sector (see
Table 5.2, page 75). Most of this activity continues to be producing a standard
undifferentiated product that tends to be over specified, fully air conditioned and
energy guzzling. However, an increasingly significant proportion – say 25 per cent –
of the new additions are able to boast environmentally friendly features. Sensitivity
to the environment is an increasingly important issue, and businesses and
organisations want to reflect their environmental credentials in the types of office
that they rent and own. There appear to be good corporate arguments in favour of
situating offices in buildings that minimise global and local impacts, reduce energy
bills and facilitate greater worker productivity.
148
Markets for Green Buildings and Infrastructure
According to the Building Research Establishment Environmental Assessment
Method (BREEAM), and its US equivalent Leadership in Energy and Environmental
Design (LEED) developed by the United States Green Building Council (USGBC), it
is possible to audit and assess a broad range of issues within the design, procurement
and management of an office building. For example, a detailed evaluation can be
made of the materials selected and the energy systems employed to light, heat and
cool the building. Interestingly, both of these assessment methods identified the new
commercial office market as having most potential and this sector became the testing
ground for various BREEAM and LEED schemes. The BREEAM scheme for new
office designs was launched in 1990, and the LEED equivalent followed eight years
later in 1998. Subsequently, schemes to evaluate existing commercial buildings,
homes (both new and old) and various other outlets such as shops, schools health
centres and industrial units followed.
BREEAM and LEED have the advantage of sharing nearly two decades of
experience and their websites now boast that more than 100,000 buildings have
been certified in 41 different countries throughout the world. The majority of these,
however, are still in the UK and the United States. These figures, however, simply
represent the number of environmental assessments that have been carried out by
the Building Research Establishment, the United States Green Building Council or
their authorised assessors. It would be more interesting and informative to know
how many other green buildings exist that have not been put through an
environmental assessment scheme. Either way, the number of green buildings is
certainly on the increase.
Construction firms seeking to differentiate their products on the basis of their
environmental performance need to deploy their assets in a distinctive way. There
is a new breed of commercial client emerging that needs to know that their
requirements can be competently fulfilled by the contractor. There are a range of
features that typify state-of the-art green developments, and the common ones are
listed in Table 9.1.
Table 9.1 The characteristics of a green building
Makes maximum use of natural daylight
Minimises consumption of fossil fuels, by techniques such as natural
ventilation, combined heat and power, and orientation of site to
benefit from passive solar energy
Reduces the use of fresh water by using grey water recycling for
landscape irrigation, flushing toilets, etc.
Minimises site impact by careful landscaping and the preservation
of local ecosystems
Reduces the quantity of ‘virgin’ materials used and selects those that
have the least negative environmental impact
Reuses and recycles existing buildings and sites
Minimises material waste during construction and demolition
Source: Adapted from Shiers (2000: 354)
149
Protection and Enhancement of the Environment
Architecture that is based on (some of) the features outlined in Table 9.1 is
slowly emerging. Some of these examples of green buildings are listed in Table 9.2.
The ones selected in the table are on, or near, a university campus – so you might
have the opportunity to take a closer look.
Table 9.2 Examples of green buildings in the UK
These buildings have been developed since the early 1990s. They are listed in
chronological order, with the most recently opened building at the foot of the list.
Queens Building (School of Engineering), De Montfort University, Leicester
The Inland Revenue Building, Nottingham
Elizabeth Fry Building, University of East Anglia, Norwich
Learning Resource Centre, Anglia Polytechnic University, Chelmsford
Wessex Water Headquarters, Bath
Architectural and Planning Studios, University of the West of England, Bristol
Peninsula Medical School, Universities of Exeter and Plymouth
The Gherkin, 30 St Mary Axe, London
The National Assembly for Wales, Cardiff
THE RESIDENTIAL SECTOR
The existing stock of houses in the United Kingdom exceeds 26 million units. In
recent years, much of the new housing stock has been built on greenfield sites that
are car dependent. The majority of these new homes are low density and inefficient
in terms of energy usage. In contrast, governments have sought to promote
development on brownfield sites designed around good public transport and
utilising high-density designs that exceed the minimum expectations for energy
efficiency. The government would also prefer to see developments that include
provision of social and/or affordable housing. These conflicting priorities highlight
the dilemmas that governments face in supporting sustainable construction.
To compound the government’s frustration, resource efficient, environmentally
friendly housing is by no means ‘rocket science’ – indeed, technically it can be
achieved easily by most contractors. Take energy efficiency as an example: all that is
needed is greater levels of insulation, the careful sealing of all joints, the positioning
of windows to make the most of sunlight, and use of a heat exchange system where
air going out preheats the air coming in. Most volume developers, however, have
been reluctant to adopt such energy efficient measures because of the extra cost (and
care) involved. For example, in the 1990s, Wimpey, then one of Britain’s biggest
house builders, shelved its plans to build green homes. Wimpey did not regard
energy conservation to be a good selling point, especially at a time when mortgage
interest rates were very high (Chevin 1992: 7). However, more than a decade later
energy has become relatively expensive and interest rates have fallen, so nowadays
the idea of a super-insulated, energy efficient home has become more attractive and,
150
Markets for Green Buildings and Infrastructure
given the interest in conserving the environment, they are no longer completely
exceptional. In fact, the type of building that we have described is now collectively
referred to as a ‘passive house’; a term used to indicate the small amounts of energy
that these buildings require for space heating.
Table 9.3 Five principles of sustainable housing
1
Improve thermal efficiency to a point where homes can
achieve zero carbon energy usage
2
Reduce mains water consumption by collecting rainwater and
recycling grey water
3
Maximise the use of local, reclaimed and recycled materials
4
Promote public transport and car pools to create a lifestyle that
is less car dependent
5
Design into the estate services to enable on site composting,
home delivery of grocery and recycling
Source: Adapted from Desai and Riddlestone (2002: 20)
There are currently 5000 passive houses built every year in Europe, mainly in
Germany and Austria (Kaan and de Boer 2006: 2). In the UK they are still rare, but
an excellent example is the Beddington Zero (fossil) Energy Development (BedZED)
project. This has provided homes to 82 families since July 2002. There are five
principles of sustainable housing that underpin the BedZED development. Most of
these are easy to replicate and make economic sense. For example, the properties
have walls with 300 mm of insulation (three times the typical amount), incorporate
triple glazing, utilise heat exchange units and make good use of south-facing
conservatories to achieve reductions in energy requirements to a point where there is
no need to install central heating. This represents a saving of around £1,500 per
home, which makes the expenditure on the increased insulation more acceptable. In
reducing the energy requirements by 90 per cent compared to that required by a
typical home which meets the UK building regulations standards, it is possible to
power the entire BedZED estate with a small combined heat and power unit running
on renewable fuel such as woodchip. Another achievement was sourcing most of the
building materials necessary for the buildings from within 35 miles of the site. The
BedZED project also integrates office and leisure facilities, built to the same energy
efficient standards, on the same site, enabling people to reduce their dependence on
cars as they can work, rest and play within a small neighbourhood.
If we are serious about sustainable construction, the development of passive
houses and passive commercial buildings similar to those built on the BedZed estate
are important. Indeed, the architects of BedZED sometimes boast of achieving
Britain’s first zero carbon or carbon neutral development. If this type of development
becomes commonplace in the property market, as a nation we would become less
dependent on fossil fuels which would help the country meet its obligations to
reduce carbon dioxide emissions. In fact, an authoritative survey of the literature
151
Protection and Enhancement of the Environment
(combining more than 80 national and regional studies) indicated that there is a
potential to reduce global carbon dioxide emissions by approximately 29 per cent by
2020 in the residential and commercial sectors (Urge-Vorsatz et al. 2007: 388).
These calculations were drawn upon by the Intergovernmental Panel on Climate
Change in its fourth assessment report, where it concluded that the biggest potential
saving in any sector (including transport) related to energy generated for use in
buildings.
This discussion suggests that firms specialising in house building (or other
structures) could benefit by differentiating their product in several ways and by
demonstrating a greater awareness of the techniques and specifications that support
sustainable construction. In this way, they could win business in the marketplace by
beating their rivals at a new game. As the sources behind the IPCC report made
clear, achieving a low carbon future is dependent on new programmes and policies
for energy efficiency in buildings that go well beyond what is happening today
(Urge-Vorsatz et al. 2007: 395).
INFRASTRUCTURE
This sector represents, in value terms, approximately 15 per cent of construction
output each year. It encompasses the construction of railways, airports, tunnels,
bridges, power stations, coast and river works, and water supply and wastewater
treatment facilities. Each of these products can be specified with sustainability in
mind. Indeed, the Institution of Civil Engineers presented its first awards to
recognise environmental excellence in the summer of 2003. The CEEQUAL (Civil
Engineering Environmental Quality Assessment and Award Scheme) is an auditbased assessment similar to the Building Research Establishment Environmental
Assessment Method (BREEAM) but appropriate for non-building projects. It shows
how infrastructure may be constructed in an environmentally friendly manner. The
characteristics that identify green infrastructure are in many ways similar to those
listed in Tables 9.1 and 9.3 – the minimisation of waste, use of recycled aggregates,
protection of landscape, ecology and archaeology, management of noise, and
efficient use of water and energy.
EXISTING BUILDINGS
The major challenge of sustainability in the built environment relates largely to
existing buildings, homes and infrastructure. Most estimates suggest that on average
only 1 per cent of a nation’s buildings are replaced each year. To take housing as an
example, even in the most productive years the completion of new housing rarely
exceeds more than 220,000 units. However, the government’s desire to raise and
promote environmental awareness has complicated the housing development process
and slowed down the number of proposals being submitted for planning permission.
In the 1960s and 1970s, for example, there were usually well in excess of 300,000
new houses completed each year in the UK. Yet during the period 1996 to 2006 the
equivalent average number dropped to 190,000 units. In other words, more than a
third fewer new houses were being built than in the 1970s despite their being an
economic boom. At this rate of new house building, it would take more than 100
152
Markets for Green Buildings and Infrastructure
years to replace the existing traditional housing stock with new environmentally
efficient dwellings.
Key Points 9.1
❏ The development of green buildings is important to sustainable
construction.
❏ Product differentiation can lead to short-term monopoly profits.
❏ A construction firm may differentiate its product by introducing
environmental specifications, and opportunities to achieve this are slowly
emerging in the commercial, residential and infrastructure sectors.
❏ There are increasing numbers of green buildings (see Table 9.2) which
display several common characteristics (see Tables 9.1 and 9.3).
RESOURCE EFFICIENCY
Implicit in the characteristics of green buildings and infrastructure is a better use of
resources. This is particularly well illustrated by the BedZED project and equivalent
passive house developments in Europe, which achieve a 90 per cent reduction in
energy resource consumption. Similar levels of resource gains are evident when
construction firms reuse and/or recycle materials, develop brownfield sites, minimise
waste, promote public transport and employ local labour. Indeed, achieving greater
levels of output with fewer resources lies at the very heart of achieving sustainable
construction.
Some analysts argue that much greater resource efficiency is achievable. In the
1990s, an important optimistic report – Factor Four: Doubling Wealth, Halving
Resource Use (Weizsäcker et al. 1998) – claimed that resource productivity could be
increased by a factor of four. Obviously such an increase in efficiency would reduce
the demands placed on the natural environment. To demonstrate that a quadrupling
of resource productivity was technically possible the report included fifty examples.
Twenty were related to energy productivity in various contexts, from refrigerators to
hypercars; a further twenty were concerned with material productivity, ranging from
residential water efficiency to timber-framed building. Finally, there were ten
examples of transport productivity, spanning the benefits of videoconferencing and
locally produced goods. Encouragingly, in the context of construction economics,
more than half of the 50 examples were relevant to the markets for green buildings
and infrastructure. Some of these examples are listed in Table 9.4.
In describing the 50 examples, Weizsäcker et al. (1998), highlight the
competitive advantages that could be achieved by exploiting resource efficiency. The
possibilities and opportunities given in Factor Four are achievable by most firms in
any part of the world seeking to differentiate their products. In most industries, if
producers are offered the opportunity to adapt production to make it significantly
quicker, of consistently higher quality and with a fourfold saving of resources, they
153
Protection and Enhancement of the Environment
Table 9.4 Examples of quadrupling resource productivity
Steel or timber frame versus concrete
Renewable sources of energy in Scandinavian countries
Air conditioning versus passive cooling
Getting the village feeling in the city: urban villages
Renovating old terraced derelict slums
Superwindows and large office retrofits
Photovoltaics at 48 volts DC
Conservation versus demolition
Source: Adapted from Weizsäcker et al. (1998)
would give it a try. Construction, however, is notoriously slow to take advantage of
any new opportunities that present themselves. The debate concerning the slow
uptake of off-site production was introduced in Chapter 7 and Reading 2. This
debate has been ongoing for more than twenty years and forms an important part of
the sustainable construction agenda. It has been informed and given impetus by
several government reports. For example, the Egan report (1998) encouraged the
industry to realise the benefits that the controlled environment of a manufacturing
plant could offer to achieve reductions in construction costs, delivery times and in
building defects; yet ten years later Egan was sad to note that little had improved
(Building 2008: 10). Similarly the National Audit Office (2005) highlighted that
modern methods of construction made it possible to build up to four times as many
homes with the same amount of on-site labour while reducing on-site construction
time by up to half. The next section explores some of the arguments for and against
the uptake of resource efficient methods in the construction sector.
OFFSITE CONSTRUCTION METHODS
Modern methods of construction utilise a number of innovations that transfer work
from the construction site to the factory. They embrace a variety of approaches
referred to several different terms, such as off-site manufacturing (OSM), off-site
production (OSP), prefabrication, lean construction and modular build. Common
examples of building elements that are produced using off-site production
techniques are bathroom and toilet pods, and timber and steel frame structures and
roofs. The wide range of benefits that follow as result of adopting these methods are
summarised in Table 9.5.
Clearly these benefits would assist a firm to achieve resource efficiency, improve
product quality and achieve a greater level of profit. Yet, despite the advantages of
these modern off-site technologies, several barriers are reported by construction
firms, such as higher capital costs, difficulties of achieving significant economies of
scale, concerns relating to manufacturing capacity, the fragmented nature of the
industry’s structure, skills shortages and a risk-averse culture (Pan et al. 2008: 61).
As Weizacker et al. (1998) pointed out, the constraints to achieving gains in
154
Markets for Green Buildings and Infrastructure
Table 9.5 The benefits of modern methods of construction
Off site working leads to improved safety
Controlled factory environment leads to increased productivity
Running costs are reduced as air tightness and energy efficiency
are improved
Reduced on-site construction time
Significant reduction in costs
Less waste from surplus and damaged materials
Fewer defects and fewer environmental impacts
resource productivity are not technological but institutional. Subsequently this
finding has been reinforced by a survey of off-site construction methods amongst
100 house builders in the UK, where several firms claimed that a lack of previous
experience prevented them from a wider take up of the modern approach (Pan et al.
2008: 62). In other words, inertia and cultural barriers are regarded as underlying
problems. This line of argument suggests that reforming the processes of
construction, or development generally, and introducing a more sustainable
approach is as much a challenge to our personal values as to our political and
economic systems.
Capital Costs Versus Running Costs
A significant example of inertia is the way markets tend to favour the short term in
preference to the long term. To some extent the example cited by Chevin (1992), in
which plans for energy efficient homes were shelved to reduce prices for home
buyers in a market characterised by high mortgage rates demonstrates the nature of
short-termism, and this problem is particularly common whenever one person pays
for the efficiency gains and another party reaps the benefits. This is easy to see in the
commercial sector, in which the priorities of landlords and tenants are frequently
regarded as distinct. An often-quoted general rule for traditional commercial
buildings is that running costs outstrip capital costs by a ratio of 10:1 over a 25 year
period. More specifically, a study carried out on behalf of the Royal Academy of
Engineering (Evans et al. 1998) estimated that the costs for a typical commercial
building over a 20 year period are in the ratio of 1 (for construction costs): 5 (for
maintenance costs): 200 (for staff costs). Yet the present culture in the construction
industry still tends to place far greater emphasis on the initial capital cost, while
demonstrating little regard for the costs incurred by end users. In terms of efficiency,
this attitude creates major resource cost implications – indeed the figures suggest
that we may be more than ten times better at wasting resources than using them.
This line of analysis creates another opportunity for construction firms to
differentiate their products and service. An integrated approach – which fully takes
155
Protection and Enhancement of the Environment
into account the end user – makes it far easier to suggest that the construction firm
is adding value to a client’s future business. Yet a client seeking to place an order for
a business headquarters that makes use of natural materials, sunlight, energy
efficiency, low noise, green plants and a genuine feel-good factor for their employees
would find its choice of contractors greatly restricted.
PRODUCTIVITY
It is important that office buildings are conducive to work, yet in many cases there is
anecdotal evidence to the contrary. There are even accusations that some offices
buildings cause employees to suffer headaches, feelings of lethargy, irritability and
lack of concentration – and, in some cases, can be responsible for high rates of
absenteeism. Even more worrying are the suggestions that the office environment
can cause irritation of the eyes, nose, throat and skin. Although some of these
symptoms sound like the side effects of spending an evening in the pub, or too long
in the swimming pool, they are distinguished by being prevalent among the
workforce of some office buildings and not of others. In fact, the symptoms usually
disappear after a few hours of leaving the ‘affected’ building. This type of condition
is commonly referred to as sick building syndrome (SBS) and it clearly leads to an
inefficient use of human resources. It is important to remember that ultimately
buildings are ‘machines for working in’ and investment in green construction should
also result in a more efficient working environment.
An interesting example of a highly integrated green building is the Rocky
Mountain Institute in western Colorado. Here it is claimed that the staff that work
in the building are productive, alert and cheerful all day – without getting sleepy or
irritable. Weizsäcker (1998: 13) attributes the high rate of productivity to ‘the
natural light, the healthier indoor air, the low air temperature, high radiant
temperature and high humidity (far healthier than hot, dry air); the sound of the
waterfall (tuned approximately to the brain’s alpha rhythm to be more restful); the
lack of mechanical noise, because there are no mechanical systems; the virtual
absence of electromagnetic fields; ...the green plants’.
Occasional days of sick leave mean that employees are being paid but not in
return for any productivity. Equally worrying, and damaging to overall productivity,
is situation where employees do attend work but spend a part of each day
complaining about their working environment – and ultimately they might be so fed
up that they decide to look for another job. This clearly all adds up to a waste of
resources.
The annual cost of absenteeism from the workplace in the UK has been estimated
to exceed 1 per cent of GDP each year – that is approximately £9 billion in current
prices (Chatterji and Tilley 2002: 669). This figure, however, does not fully account
for the effects of sick building syndrome which has received little attention from
economists. As the following calculation suggests, this is a significant omission.
According to a survey (Hedges and Wilson 1987) involving employees working
across 46 office buildings of varied age, type and quality the incidence of sick
building syndrome is quite widespread. Participants of the survey were asked how
much they thought the physical conditions of the office influenced their productivity.
156
Markets for Green Buildings and Infrastructure
The majority thought that their productivity was affected by at least 20 per cent.
This is the equivalent of taking one day off in five. Worker self-evaluation, however,
may be subject to exaggeration. But even if we take a reduced figure of 10 per cent,
this would still represent a significant cost. For example, if we assume that £20,000
is the average office salary, then an organisation employing 1,000 people could be
losing in the region of two million pounds each year. (The calculation is simple: a
10 per cent SBS effect on lost productivity represents £2,000 per employee per year,
multiplied by 1000 gives a potential loss of £2,000,000.) Arguably, these figures are
a worst-case scenario, and not everyone is equally affected by SBS – the literature
suggests that 55–60 per cent of staff in problem buildings may be affected. It seems
more plausible, perhaps, to accept an estimate of one million pounds per 1000
employees per year. The more worrying statistic is that the service sector employs
more than 15 million people everyday in offices. This calculation implies a national
cost of SBS in the UK in the region of £15 billion. Again this may be a worst-case
scenario, as it assumes that all buildings are affected by SBS. However, the
important point is to consider how certain types of construction can result in
inefficient uses of resources and set parameters for debate.
As the Egan report (1998: 22–3) stressed, construction needs to be viewed as a
much more integrated process paying far more attention to the needs of the end user
– even to the extent that completed projects should be assessed for customer
satisfaction and the knowledge gained fed back into the industry. To a limited extent
this is happening, and the features likely to influence and improve indoor
environmental quality and productivity are listed in Table 9.6. The general message is
that construction needs to change its approach. The end user requirements need to be
given as much respect as the construction specifications. As the National Audit Office
(2001: 44) acknowledged, badly designed buildings fail to meet the needs of the end
users, and investment into good quality design and construction could result in a
more efficient working environment and lower running costs.
Table 9.6 Internal features to improve productivity
Careful attention to a building’s specifications can enhance internal environmental
quality and improve productivity beyond the levels achieved in buildings which use
standard practices. These characteristics are likely to assist the indoor quality.
Natural systems of ventilation
Building materials and furnishings that have low toxicity
Use of natural daylight
Energy efficient lighting with a low flicker rate to reduce headaches
User control of temperature and ventilation
Attention to maintenance and operation of buildings to reduce the
build up of microbial agents
Source: Adapted from Heerwagen (2000: 354)
157
Protection and Enhancement of the Environment
In terms of economics, the important point that emerges is that as the breadth of
expertise required from a construction firm increases the number of firms supplying
the market decreases; in short, there is greater opportunity to differentiate between
firms. We have already pointed out this type of consequence in Chapter 6 when we
reviewed PFI contracts and there are interesting parallels. Successfully completed
projects, of either the green or PFI variety, have the potential to be more
economically efficient and more sustainable. But both project types seem, at present,
to favour the big firm and not the small firm that typifies the industry.
One possibility in the longer term is that teams of small firms will begin to work
together more closely to secure a place in the green market. This was one of the
ways that the Egan report hoped the industry would go forward. As Egan (1998: 32)
expressed it: ‘Alliances offer the co-operation and continuity needed to enable a
team to learn and take a stake in improving the product. A team that does not stay
together has no learning capability and no chance of making the incremental
improvements that improve efficiency over the long term.’
Key Points 9.2
❏ Thinking long term instead of short term makes an important contribution
towards achieving greater resource efficiency in the built environment.
❏ Some analysts argue that resource productivity can be increased by a factor
of four, and that the barriers to achieving these gains are cultural rather
than technological.
❏ For traditional commercial buildings, the running costs outstrips the capital
costs by a ratio of at least 10:1.
❏ An important consideration of any economic activity is to consider the end
user. For example, in construction, the internal design of an office building
should be conducive to work.
LIFE CYCLE ANALYSIS
It should be apparent that any firm interested in producing products for the green
market needs to consider a broad range of criteria. And the few firms that have
begun to take their environmental performance seriously have adopted auditing
procedures that go far beyond narrow financial measures. By auditing how much
energy is used and how much waste is generated at each stage of a product’s life,
producers can increase resource efficiency and reduce the environmental impact of
the product. But deciding where to start and where to stop with these environmental
analyses is a contentious issue and the boundaries need to be clearly defined. For
example, a construction firm could consider energy efficiency, the reuse of building
materials, the energy embodied in the manufacture and transport of materials to site
and the use of the building throughout its entire life span, etc. In fact, there seems to
be ample opportunities to break into many new markets. In an ideal world, the
complete ‘cradle-to-grave’ aspects of a building would be analysed, but this would
158
Markets for Green Buildings and Infrastructure
take a business into making detailed assessments of first, second and third
generation impacts. The important message is to identify carefully the quality and
specifications of the product to be marketed, before deciding what is the ‘cradle’ and
what is the ‘grave’ for specific purposes. Such an approach would take a firm on an
incremental journey that would make its product differentiation clear and
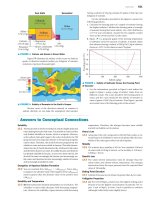
accountable. Figure 9.1 shows a very simplified model of the opportunities that life
cycle analysis might offer to construction.
Figure 9.1 Life cycle analysis of buildings and infrastructure
In this simplified model, the environment is the source of fossil fuel and raw material
inputs and a sink for waste outputs.
Inputs
Use
Raw materials
Outputs
Products
Construction
Fossil fuels
Waste
It is evident that, at each stage, the construction process burdens the environment
with many costs. At the beginning of the life cycle, a large amount of natural input is
needed for the construction phase and, as is well documented, across Europe the
construction industry consumes more raw materials than any other industrial sector.
During the operational stage, buildings are also responsible for a very significant
amount (40–50 per cent) of greenhouse gas emissions, as buildings rely heavily on
carbon-based fossil fuel energy for heating, lighting and ventilation. And finally, at all
stages up to and including demolition, there is a large amount of associated waste. In
fact, it is estimated that the construction industry accounts for 50 per cent of the total
waste stream in Europe.
The life cycle analysis of a building is complicated further by fact that there may
be several occupiers with different regimes of repair, maintenance and improvements
throughout its life span. At all times, however, there is a flow of resources from the
natural environment to the constructed product and vice versa, with varying impacts
on the environment at different phases. Consequently, no matter how exemplary the
initial environmental specification at the construction stage, the overall impact of a
building will be dominated by the way in which it is used.
For our purposes, it is important to remember that we are not dealing here with
environmental science. This text seeks to introduce economic concepts and:
•
•
compare ideas of mainstream economists with their environmental counterparts
understand the interrelationships between the economy and the environment.
These concerns form an important focus of the chapters comprising Part B.
159
Protection and Enhancement of the Environment
Neoclassical Versus Environmental Economics
Mainstream neoclassical economics suggests that market forces determine the
specific resources allocated to construction. We introduced these ideas in Chapter 3,
where we explained how freely adjusting prices provides an efficient signalling
system that determines what is made, how it is made and for whom. (Some readers
may wish to review Key Point 3.1.) From this perspective, economists can easily
account for why energy intensive, man-made substitutes might be used in place of
more environmentally friendly products. Using neoclassical analysis, if inputs
become scarce, the price rises; this, in turn, creates an incentive for an enterprising
person to identify a gap in the market and produce a substitute. These substitutes
often depend upon the clever use of technology and, as time goes on, more natural
products are replaced (or substituted) by these man-made equivalents. So, for
example, the sharp increases in oil prices during recent decades, which are outlined
briefly in Chapter 14 as a cause of global inflation, have highlighted the increasing
problem of demand for oil outstripping its supply. Indeed, the price of a barrel of oil
reached an all time high in 2008. These significant and persistent price hikes push up
the price of petrol and heating, and signal a need to substitute energy derived from
oil with energy derived from other sources and to utilise developments in technology
to improve energy efficiency. The reason we have presented this seemingly stark
simple scenario, in which no explicit account is paid to the environment, is to stress
that in traditional economic analysis the whole system is self-determining. In
neoclassical terms, there is no need to resort to any form of government intervention
to achieve a low-carbon economy, as given time the freely operating forces of the
market will make it an economic inevitability.
In direct contrast, environmental economics does not accept that the ecosystem,
or nature, is merely another sector of the economy that can be dealt with by market
forces. Environmental economists proceed from the basic premise that there is an
extensive level of interdependence between the economy and the environment; and
there is no guarantee that either will prosper in the long term unless governments
enforce measures that make firms acknowledge the complete life cycle costs arising
from their economic activity. Daly (1999: 81) has crudely characterised the ideas of
the neoclassical school: ‘The economic animal has neither mouth or anus – only a
close loop circular gut – the biological version of a perpetual motion machine.’
The important concept that Herman Daly and his environmentally conscious
contemporaries bring to economics is the greatly undervalued contribution that the
environment makes to the economic system. Indeed, the environment provides all
the natural resources and raw materials needed to start any process of building or
infrastructure, such as land, fuel and water. The environment also provides
mechanisms for absorbing the emissions and waste. In short, in this modern view,
the economy is viewed as a subsystem of the environment!
In discussions of sustainability the environmental dimensions cannot be ignored,
yet traditional mainstream economic textbooks do not refer to life cycle analysis or
any of the equivalent auditing systems that measure environmental impacts. The sole
reference point is money and the economy is presented as a linear system – similar to
that portrayed by Figure 9.1. To correct this misleading picture, environmental
160
Markets for Green Buildings and Infrastructure
economists usually represent the economic linear system within a larger box, or
circle, to represent the environment. This type of approach is adopted in Chapter 11.
It is used to illustrate that there is an interdependent relationship between the
environment and the economy; that the environment provides resource inputs and
carries away the waste outputs and cannot be taken for granted. As an example of a
representation of the environmental approach see Figure 11.4 (page 183).
Unfortunately, however, the conventional mindset of those presently managing
firms in the construction industry mirrors the approach taken by neoclassical
economists. For this to be replaced with a genuine sustainable perspective, a
commitment to understanding the ideas of environmental economics becomes most
important.
It is worth closing this chapter with the observation that both neoclassical and
environmental economists share a common belief that consumers and producers
express preferences through their willingness to pay. This may appear ironic, but it
seems that in the final analysis most economists are preoccupied with expressing
everything in monetary value. This suits neoclassical economists whose main point
of reference is the trade of material goods and services in markets at specified prices.
It is far more problematic for environmental economists who seek to place monetary
values on environmental goods and services that are commonly treated as ‘free’
goods. We shall elaborate on this further in the next chapter and deal specifically
with valuation techniques in Chapter 11.
Key Points 9.3
❏ Life cycle analysis involves a detailed study of the impacts of a product
from cradle to grave. In the case of buildings and infrastructure, it
emphasises the large amount of resources and waste that are involved in
the construction process.
❏ Neoclassical economists hold a strong belief that markets steer economies.
❏ Environmental economists emphasise that the economy is dependent on
the environment for several functions that cradle-to-grave analysis helps
to value.
❏ Environmental economics offers the construction industry a perspective
that could help it to secure more sustainable outcomes.
161
60
1
Market Failure and
Government Intervention
Throughout Part A, we emphasised that the market system allocates resources
efficiently. We described how the price mechanism provides an incentive for firms to
enter and exit markets in their search for profits, and how each market arrives
at equilibrium. Indeed, up until the last chapter, the dominant theme has been
that most economic problems can be resolved by allowing the free market to work
(see Key Points: 2.1, 3.1, 5.4, 6.1, 7.1, 8.1 and 8.2). For one specific and intriguing
example, see the argument put forward by traditional economists relating to the
increasing price of oil as a solution to the problem of climate change, rehearsed on
page 160.
The market, however, does not always work. There are some circumstances
which prevent the price system from achieving productive and allocative efficiency.
This seems to be particularly the case for markets involving or impacting on the
environment; markets in which goods are not privately managed but commonly
owned. In these cases, non-market alternatives need to be considered. One of the
most important non-market forces is government, and this chapter reviews the
government’s role within failing markets. We shall, however, recognise the possibility
that governments can also fail to achieve efficient outcomes, and this is discussed at
the end of the chapter.
Market failure describes a situation where the forces of supply and demand do
not allocate resources efficiently. It may be defined as:
a marketplace where the unrestricted price system causes too few, or too
many, resources to be allocated to a specific economic activity.
As we suggested in Chapter 2, the majority of environmental problems such as
polluted seas, devastated forests, extinct species, acid rain and the vaporising ozone
layer are examples of market failure.
Economists refer to these type of problems to justify a role for government
intervention. As Milton Friedman, a publicist of the market system for more than
40 years, consistently emphasised, the existence of a free market does not eliminate
the need for government. On the contrary government intervention is essential as a
forum for determining the rules of the game, and as a provider of public goods
(Friedman 1962).
WHAT CAUSES MARKET FAILURE?
Traditionally economists identify four common causes to explain why markets fail.
The first set of explanations usually concerns the promotion of fair competition
between firms, as monopolies and other forms of imperfect competition enable large
firms to rig markets and keep prices artificially high. These problems have already
been considered briefly in Chapter 8. In this part of the text, however, we are
163
Protection and Enhancement of the Environment
concerned with the protection and enhancement of the environment and, therefore,
we restrict ourselves to the other three common causes of market failure. These are:
•
•
•
externalities
free-rider problems
asymmetric information.
Externalities
We introduced the conceptual parameters necessary to understand externalities in
Chapter 2 (see Key Points 2.4). We contrasted private costs and external costs – a
distinction that helps to explain a broad set of environmental problems. The related
analysis represents an important tradition in welfare economics, stretching back to
the beginning of the twentieth century.
The idea that economic efficiency should describe a situation in which nobody
can be made better off without making somebody else worse off dates back to
around 1890 in work by Vilfredo Pareto, an Italian social scientist. According to
Pareto, in a truly efficient competitive market all the exchanges that members of the
economy are willing to make have to be agreed at fair prices. In such a situation,
nobody can benefit unless they take advantage of someone else. There is a general
equilibrium. All members of the economy face the true opportunity costs of all their
market-driven actions.
In many real markets, however, the price that someone pays for a resource, good
or service is frequently higher or lower than the opportunity cost that society as a
whole pays for that resource, good or service. In short, it is possible that decisions
made by firms and/or consumers in a transaction will affect others not involved in
that particular transaction to their benefit or detriment. To put it more simply, in the
competitive marketplace, a deal is struck between a buyer and seller to exchange a
good or service at an agreed price; but, alongside this two-party activity, there are
possible spillovers to third parties – that is, people external to the specific market
activity. The spillover benefits and costs to third parties are termed externalities.
To clarify the concept further it might help to draw a distinction between the full
economic cost and the basic cost of a good or service. The basic cost takes into
account all stages of production, which could include extraction, manufacture,
transportation, research, development and other business costs such as marketing. In
other words, the basic cost covers all the costs that are usually added up to account
for a market price. The full economic cost, however, includes all the possible basic
costs plus the externalities; or, to put it another way, the full economic costs are the
true burdens carried by society in monetary and non monetary terms. In short:
full economic costs = basic costs + externalities
An example of an externality is the pollution of a river, the air or an open public
space caused by a construction process. This leads to a general loss of welfare for a
community. If this community is not compensated for its loss, then the cost is
external to the production process. The construction firm has created a negative
externality. In producing a building, the firm has paid for inputs such as land,
164
Market Failure and Government Intervention
labour, capital and entrepreneurship, and the price it charges for the finished
product reflects all these costs. However, the construction firm has acquired one
input – waste disposal into the river, air or open space – for free, by simply taking it.
This is, indeed, taking a liberty; the construction firm is not paying for all the
resources it is using. Or, looking at this another way, the construction firm is giving
away a portion of environmental degradation free with every product.
Any kind of spillover that causes environmental pollution is called a negative
externality because there are neighbourhood costs such as contaminated water and
loss of habitat and associated health issues such as respiratory problems that society
at large has to pay. In other words, these community costs are external to the
economic transaction between the construction firm and the purchasers of the
completed building. An important goal of environmental economists is to close the
gap between private costs and external costs. The aim is to make the polluter pay –
to make sure that those responsible for causing the pollution are made to pay the
costs. This idea of making the polluter pay is discussed later in the chapter. Note,
however, that if these costs are to be invoiced in some way we need to know how
much to charge which, in effect, means putting a monetary value on the
environment – and we shall look at ways of measuring environmental costs in more
detail in Chapter 11.
Before leaving the topic here, however, we should acknowledge that not all
externalities are negative. The production of a good or service can generate spillover
benefits for third parties. In these instances, the market failure is not so problematic.
Governments can choose to finance these goods or services that generate positive
externalities through subsidies to the private sector – ensuring that companies are
rewarded for production of a good or service that, if left to market forces, would be
underproduced. A simpler alternative is for a government to take responsibility for
the production of the good or service itself. The next section on free riders will
confirm the appeal of this approach.
Free-rider Problems
Whenever positive externalities greatly exceed private benefits, the good or service
concerned becomes unprofitable in the market context – in effect, some benefits
associated with the good or service are allocated for free. For example, if you pay
for several lampposts to light the pathway and pavement outside your house, the
private benefit (to yourself) would be too small relative to the cost. And the external
benefit to your neighbours from this street lighting would be significant, as they
would be getting a brighter pathway for free. The problem is that the market system
cannot easily supply goods or services that are jointly consumed. For the market to
work efficiently a two-party agreement is preferable. If non-paying parties cannot
easily be excluded from the benefits of a good of service, we have the problem of the
free rider. Good examples of this situation are the markets for sewerage services,
public open space, paving, street lighting, flood control, drainage, roads, tunnels,
bridges and fire-protection services.
165
Protection and Enhancement of the Environment
Asymmetric Information
Most economic texts identify the problems created by a dominant firm, or a group
of colluding firms, as typical causes of market failure. As an example, reflect on the
market structures that typify firms in construction and the possible opportunities for
them to enter into agreements on joint profits (or at least review Key Points 8.4). In
this text we have chosen to emphasise that any contractual agreement that is loaded
in favour of one party can contribute to market failure. There is a general problem
of one-sided information. In Chapter 6 (see page 86), we introduced the idea of
asymmetric information.
A situation in which some of the parties involved in an economic transaction
have more information than others is defined as asymmetrical.
Markets may not achieve efficient outcomes when the consumer has to defer to a
more informed producer. Let us develop this idea a little further with a simple
example. When most consumers go into a music shop to buy a CD, they have
enough information to make a rational decision. When they purchase services from
a builder, the situation is often very different. In this situation, purchasers know
roughly what they want to achieve – but they must rely on the experience and advice
of the builder to specify what precisely needs to be done.
This situation – in which one party holds most of the cards – is a common cause
of market failure. A new academic approach to market analysis is emerging that
focuses on the contractual agreement between the ‘principal’ – that is, the client –
and the ‘agent’ – the contractor. This focus on the principal-agent relationship
questions the balance of power between the less informed client and the
knowledgeable agent. The debate is around the extent to which the agent acts in the
best interests of the client. This analysis of the principal-agent relationship
demonstrates how the skills and experience of the agent could lead to a situation in
which a trusting client may be misinformed. The initial discussions on principalagent relationships appeared in health economics: in health contexts, it is clear that
the doctor – the agent – has far more medical information than the patient – the
principal. Consequently, we are very reliant on doctors to act in our best interests.
Principal-agent analysis can equally be applied in construction contexts – to
project managers, engineers and architects. Many large-scale construction projects
are technically complex and not easily understood by non-professionals. Although
the costs of a mistaken choice may not appear as dire as in medical cases, they are
equally difficult to reverse. For example, if the clients or purchasers of a major
building development wish to reduce the environmental impact of the construction
process, they are completely dependent on the expertise of contractors to achieve
these outcomes. It is quite possible that energy usage may not as efficient as it could
be or that waste may not be minimised as requested. The hired ‘agent’ may not
always act in the client’s best interest, and they might be able to get away with it
because of the ‘principal’s’ incomplete knowledge.
166
Market Failure and Government Intervention
Key Points 10.1
❏ Market failure occurs whenever the free forces of supply and demand
over-allocate or under-allocate resources to a specific economic activity.
Examples seem to be widespread across the environment.
❏ Three reasons for market failure are (a) externalities, (b) the free-rider
problem and (c) asymmetric information.
GOVERNMENT INTERVENTION AND MARKET FAILURE
Governments intervene in various ways to correct market failures. Historically, the
preference had been for correction via legislation, but increasingly correction is
sought by influencing prices and knowledge. Some typical examples are outlined in
Table 10.1. This indicates, in a very general way, some of the approaches that are
used to tackle different types of market failure. As the press describes it, stick, carrot
and tambourine approaches all play a part. To clarify what this means, in the next
sections we discuss some of the approaches used by government to resolve each of
the three causes of market failure, before going on to consider their effectiveness.
Table 10.1 Government policies to address market failures
Market
failure
Government
tax
Externalities
Landfill tax
Government
spending
Publicity &
information
Government
regulations
Water quality
legislation
Climate change
levy
Aggregates levy
Free-rider
problems
Provision of
public goods
Habitats and
species
legislation
Tax relief for
cleaning up
contamination
Asymmetric
information
Carbon trust
campaigns
Building
regulations
Home
information
packs
Code for
sustainable
homes
Source: Adapted from HM Treasury (2002: 23)
167
Protection and Enhancement of the Environment
Government Taxation
The UK government collects almost £575 billion in taxes each year. The lion’s share
is obtained through taxes on personal incomes and business profits, and a relatively
small amount raised through environmental taxes such as those charged on waste,
carbon usage, pollution and so on. However, the system of taxation is evolving from
simply raising funds to provide essential public services to altering patterns of
private expenditure. As politicians like to say, the burden of taxation is beginning to
shift away from ‘goods’ such as employment towards ‘bads’ such as pollution and
environmental damage. In other words, taxation is being used to determine the
allocation of resources by influencing the final market price of a good or service.
Taxes that operate through the price mechanism to create an incentive for change
may be described as a market-based instrument, as theoretically these taxes seek to
internalise external costs into the price of a product or activity. Interestingly many of
the recent examples of taxes introduced to reduce negative externalities relate to the
construction industry.
LANDFILL TAX
The landfill tax was introduced in October 1996. It was imposed to provide an
incentive to minimise waste and promote recycling – to internalise the costs to the
community of waste going to landfill. Depending on the nature of the waste, the
current tax can be as much as £24 per tonne for so-called ‘active waste’ that gives
off emissions, and £2 per tonne for ‘inert material’ such as concrete bricks and
excavated soil that does not biodegrade. This is potentially a significant penalty,
although in the case of construction the vast majority of the waste is inert and
attracts the lower rate. Currently, slightly more than 100 million tonnes of
construction and demolition waste ends up as landfill – of which 16 per cent
apparently is material delivered and then thrown away unused. The government has
indicated that it will make significant annual increases in the standard rate of landfill
tax, and it is expected to double to £48 per tonne by 2010. There is also an
ambitious target to half construction waste sent to landfill by 2012 and achieve zero
inert waste to landfill in the foreseeable future (HM Government 2008: 48–9).
Although there is some uncertainty regarding the precise amount of construction
waste, it is widely accepted that the industry is the biggest producer of waste
products. Hopefully the increasing rates and targets relating to landfill will send a
clear signal to those working in construction of the need to reduce the external costs
associated with the large volume of waste produced, as well as provide an economic
incentive to develop recycling.
CLIMATE CHANGE LEVY
The climate change levy commenced in April 2001. It is basically a tax on the
business use of energy, and it covers the use of electricity, gas, coal and liquefied
petroleum gas (LPG) used by the non-domestic sector. The levy is imposed on each
business energy bill according to the amount of kilowatts used. There are differential
rates for different energy sources. The levy is nearly three times higher for electricity
(£0.0044 per kilowatt hour) than gas or coal (£0.0015 per kilowatt hour). This
168
Market Failure and Government Intervention
differential has been introduced because the use of each type of fuel creates different
levels of greenhouse gas emissions. The levy has increased energy costs in the
commercial sector by 10 to 15 per cent.
The purpose of the climate change levy is to encourage businesses to internalise –
that is, pay for – the negative externalities associated with the greenhouse gas
emissions that they are responsible for generating. Firms using environmentally
friendly energy technologies, such as photovoltaic systems, energy crops and wind
energy, or combined heat and power systems are exempt from the levy.
Manufacturing, mining and utilities companies have been hit the hardest by the
introduction of this levy. Ironically, the impact on the construction industry could be
beneficial: the climate change levy encourages businesses to use energy more
efficiently, and as all businesses occupy buildings, the expertise of the construction
industry could potentially help to make offices and factories more energy efficient
and, therefore, reduce energy costs.
AGGREGATES LEVY
The aggregates levy came into effect in April 2002. It is a tax applied to the
commercial exploitation of rock, sand and gravel. It applies to imports of aggregate
as well as to aggregate extracted in the UK. Exports of aggregate are not subject to
the levy. The purpose of the levy is to give businesses operating in the UK an
incentive to compare the full costs – including all negative externalities – of using
virgin aggregates with alternatives or recycled materials.
To explain it another way, the levy has been established to reduce the noise and
scarring of the landscape associated with quarrying. These environmental costs
could not continue to be ignored, and the levy is meant to encourage the polluter to
pay. The intention is that the construction industry should reduce its demand for
primary materials by recycling as much as possible and by reducing waste on site.
The immediate benefactors from the removal of these negative externalities would
be those communities living close to the quarries. And it is interesting to note that
their opinions were sought in the preparatory research that established the initial
level of aggregate levy at £1.60 per tonne. By 2008 it had increased to £1.95 per
tonne, and in April 2009 it will see further revision to £2.00 per tonne. Finding an
exact value for the environmental costs of quarrying will be examined further in the
next chapter.
Government Spending
The second area that we identified as a cause of market failure relates to the
free-rider problem. The basic problem here is excludability. The benefits of some
goods or services – due to their very nature – cannot be excluded from non-payers.
Even supporters of the free market, from Adam Smith to Milton Friedman, have
recognised that there are a few goods and services that the market mechanism does
not supply effectively. These are generally referred to as public goods.
In order to explain the precise nature of public goods, it is helpful to begin at the
other end of the spectrum and clarify the definition of private goods. Indeed, so far
in this text, private goods have been at the heart of the analysis. We have mainly
169
Protection and Enhancement of the Environment
discussed the activities of private construction contractors in providing private goods
and services. These private goods (and services) are distinguished by two basic
principles. One can be termed the principle of rivalry. This means that if you use a
private good, I cannot use it; and, conversely, if I use a private good, you cannot use
it. For example, when I use the services of a plumber, he or she cannot be working at
the same time on your water and heating system. We compete for the plumber’s
services; we are rivals for this resource. The services of plumbers are therefore priced
according to our levels of demand and the available supply of their time, and the
price system enables plumbers to divide their attention between customers. The
other principle that characterises a private good is the principle of exclusion. This
simply implies that once a good is provided others may be prevented from enjoying
equivalent benefits unless they pay. In short, anyone who does not pay for the good
or service is excluded. For example, if a road bridge is set up with a tollgate, then
the communications link that the particular bridge offers is available only to those
who pay. All others are excluded by the price mechanism.
These principles of exclusion or rivalry cannot be applied to pure public goods.
They are non-excludable and non-rivalrous in their characteristics. National defence,
street lighting and overseas representation are standard textbook examples of pure
public goods. A distinction is sometimes made between pure public goods, which are
both non-excludable and non-rivalrous, and quasi (near or impure) public goods,
which do not have both these characteristics. The major feature of quasi public
goods is that they are jointly consumed. This means that when one person consumes
a good, it does not reduce the amount available for others. It is difficult, therefore,
to apply a discriminatory price system. Construction projects, such as bridges and
roads, exemplify quasi public goods – especially if a toll system is enforced.
Figure 10.1 A spectrum of economic goods
Pure public
goods
1 Indivisible
2 Non-rivalrous
3 Non-excludable
4 Cannot express
a monetary value
Quasi public
goods
Quasi private
goods
Pure private
goods
1 Divisible
2 Rivalrous
3 Excludible
4 Market price
is available
There are four distinguishing characteristics of public goods that set them apart
from normal private goods. These four qualities are portrayed in Figure 10.1. This
shows a spectrum contrasting the characteristics of pure public goods against those
that typify pure private goods.
170