Open access inshore fisheries: The economic performance of the purse seine fishery in Nha Trang, Vietnam
Bạn đang xem bản rút gọn của tài liệu. Xem và tải ngay bản đầy đủ của tài liệu tại đây (476.75 KB, 20 trang )
42
Pham Thanh Thai & Tran Thi Thu Hoa / Journal of Economic Development 23(4) 42-61
Open-Access Inshore Fisheries:
The Economic Performance of the Purse Seine
Fishery in Nha Trang, Vietnam
PHAM THANH THAI
Nha Trang University –
TRAN THI THU HOA
Nha Trang University –
ARTICLE INFO
ABSTRACT
Article history:
In Vietnam the number of fishing vessels, especially near the shore,
has increased continuously, despite the Government’s target of a
reduction. In particular, 80% of the fishing vessels operating in the
coastal areas make up only 11% of the exclusive economic zone. Such
heavy use of near-shore fish resources could imply overfishing and
economic decline. Therefore, the economic performance of the
inshore purse seine vessels in an open-access fishery has been
investigated based on a 2011 survey of the cost and earnings data of
62 anchovy purse seiners, representing about 46 % of such vessels in
Nha Trang, Vietnam. The empirical results show that an average purse
seiner is able to cover all the costs and earn a profit margin of 17.41%
and that crew members earn their opportunity cost of labor or above.
Engine power, number of crew size, and number of fishing days are
identified as the main factors affecting fishing effort of the vessel. An
application of the Salter diagram indicates that a large number of
vessels with high relative standardized effort are the most costefficient vessels. The majority of these vessels are found to earn intramarginal rent despite the open-access characteristics of this fishery.
Received:
May 4, 2015
Received in revised form:
Aug. 23, 2016
Accepted:
Sep. 23, 2016
Keywords:
Economic performance,
intra-marginal rent,
standardized effort, cost
and earnings, Nha Trang,
purse seine fishery.
Pham Thanh Thai & Tran Thi Thu Hoa / Journal of Economic Development 23(4) 42-61
43
1. Introduction
In Vietnam the fisheries sector is a significant contributor to the economy.
Approximately 3.4 million people, or approximately 10% of the labor force, are
employed in this sector (Le et al., 2008). In addition, the fisheries sector has contributed
to both domestic income development and international trade relation development of
the country. The economic opportunities and the open access to the marine resources are
stimulating increasing numbers of people to become involved in fisheries annually. The
catches per unit of effort, however, have decreased besides the earnings from fishing
activities that have fallen and have sometimes been insufficient to cover the fishing cost
(FAO, 2005).
The fishing areas can be classified into inshore-coastal fishery and offshore fishery.
Inshore waters are referred to as the waters being less than 30-meter deep in the Tonkin
Gulf and the South and being less than 50-meter deep in the center of the country (FAO,
2009). In recent years the number of fishing vessels, especially near the shore, has soared
continuously. Specifically, 80% of the fishing vessels operating in the coastal areas
account for only 11% of the exclusive economic zone. Such heavy use of near-shore fish
resources could imply overfishing and economic decline (Luong, 2009).
Regarding the information provided by Research Institute Marine Fisheries (RIMF)
that the exploitable potential of marine waters up to the 50-meter depth range is an
estimated 582,000 tonnes/year, it has been emphasized that from 1991 onward the catch
has exceeded its sustainable limits, and that the overall profitability of the fishing fleet
has decreased (FAO, 2005). This indicates that the inshore fisheries face serious
constraints to further development, at least from a biological perspective. Moreover, in
2013 the Ministry of Fisheries proposed two new major development goals for
Vietnam’s coastal fisheries to 2020 with vision to 2030, involving: (i) carrying out
schemes and projects of protection, restoration, and development of fisheries resources
for sustainable fishing, (ii) devising a model of transfer of ineffective inshore fishing,
which causes negative impact on fisheries resources and is environmentally unfriendly
to other appropriate occupations which are efficient and environmentally friendly; and
(iii) formulating sound policies that inspire fishermen to shift from inshore fishing to
other occupations and protect aquatic resources (in association with protection of the
country’s sovereignty and marine security). To reach these goals Vietnamese policy
makers demand not only reliable assessments of inshore resources, but also an
44
Pham Thanh Thai & Tran Thi Thu Hoa / Journal of Economic Development 23(4) 42-61
understanding of the economic realities of each inshore fishing fleet (Le et al., 2008).
Therefore, it is necessary to investigate the economic performance of inshore vessels in
an open-access fishery.
Recent years saw the exponential growth of fisheries in Nha Trang, which is a central
city of Khanh Hoa province, with the purse seine fleet, considered the main kind of
inshore fishery. Being still open-acess, the fisheries in Nha Trang are currently facing
many problems, such as the overexploitation of marine resources and excess harvesting
capacity (Tang, 2011). Hence, with the primary aim to inspect the economic
performance of vessels in an open-access fishery, this study is conducted not only to
paint an up-to-date picture of the current economic performance of the fisheries, but also
to provide evidence of why the purse seine fisheries are still able to generate profits for
the society even under open-access equilibrium. This may be useful for fisheries
managers in managing and developing the purse seine fisheries in Vietnam.
2. Theoretical framework
2.1. Open-access bioeconomic model of the fishery
The traditional bioeconomic model of the fishery has been provided by Gordon
(1954). This model was built based on the important assumption that the vessel fleets in
a perfectly competitive market are homogeneous with an identical cost structure. For
simplicity the total costs may be supposed to increase linearly with efforts, and the
vertical distance between total revenue and total cost defines the economic profit from
the fishery (Gordon, 1954).
Pham Thanh Thai & Tran Thi Thu Hoa / Journal of Economic Development 23(4) 42-61
45
TR(E)
T
T
O
EMEY
EOA
Effort(E)
AR(E)
MR(E)
MC(E)
A
MC
M
O
EMEY
EOA
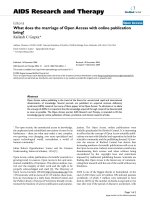
Figure 1. The traditional bioeconomic model
Source: Flaaten (2011)
As has been suggested the total revenue curve has a similar shape to the sustainable
yield curve. Whether it is scaled up or down relies on the actual price, and the price of
fish is, in fact, constant over time (Flaaten, 2011). Under an open-access regime, vessels
will enter the fishery if the average revenue per unit of effort is greater than the average
cost per unit, and will exit the sector if the average cost per unit is higher than average
revenue per unit. When the average revenue of effort, AR(E), equals the marginal cost
of effort, MC(E), there will be an economic equilibrium with neither an incentive to
leave nor an inspiration to enter the fishery. In other words, profit at this effort level is
zero (Flaaten, 2011). In Figure 1 the level of effort under open access equilibrium is
denoted as EOA. When the vessels operate at lower levels of open-access effort,
46
Pham Thanh Thai & Tran Thi Thu Hoa / Journal of Economic Development 23(4) 42-61
individuals will be making economic profits (resource rent). The existence of positive
profits should attract new entrants into the fishery, and therefore lead to reduced fisheries
average revenue until individuals’ earning zeroes profits (Coglan & Pascoe, 1999;
Flaaten, 2011). As a result, the resource rent is dissipated under the open-access
condition (Gordon, 1954; Coglan & Pascoe, 1999; Flaaten, 2011).
2.2. Intra-marginal rent for the most efficient vessels
As mentioned above, the potential resource rent is wasted under open access if the
fleet consists of homogeneous vessels. In actual fisheries vessels usually vary with
respect to size, engine power, gear-type, costs, and other technical and economic
characteristics. Therefore, the fishing vessels are deemed heterogeneous in cost structure
and different in efficiency of effort, resulting in the existence of heterogeneous effort in
the fishery (Flaaten, 2011).
From a fisheries management perspective with heterogeneous vessels, the economic
profits of the vessels consist of two components: resource rent and intra-marginal rent
(Coglan & Pascoe, 1999). Resource rent is dissipated under open-access conditions.
With heterogeneous vessels the profits generated could be considered to be intramarginal rent gained by the factors of production, such as capital, labor, and variable
inputs, through more cost efficient vessels (Coglan & Pascoe, 1999; Nguyen et al.,
2012).
2.3. Economic performance indicators
In this study we develop economic performance indicators using costs and earnings
of purse seine vessels in Nha Trang, Vietnam for 2011. The concepts of costs and
earnings are based on those of profitability analyses of fishing vessels in industrialized
countries (Flaaten et al., 1995). Most definitions of these indicators are the same as those
used in European Commission (2004), Le et al. (2008), and Nguyen et al. (2015).
The calculation of economic performance indicators is presented as follows:
Gross revenue
Variable costs (except labor cost)
= Income
Fixed cost
Pham Thanh Thai & Tran Thi Thu Hoa / Journal of Economic Development 23(4) 42-61
47
= Gross value added
Labor cost
= Gross cash flow
Depreciation
Interest payment on loans
= Pretax profit (EBT)
Calculated interest on owner’s capital
= Net profit (rent)
Profit margin = EBT/Gross revenue
Return on investment (ROI) = EBT/Vessel owner’s capital
Gross revenue is defined as landing value of the vessel in year of fishing operations.
Income is the difference between gross revenue and variable costs, except labor cost.
Gross value added (GVA) is referred to as the difference between the annual gross
revenue minus the total of annual variable costs and fixed costs, excluding labor costs.
Gross cash flow is an important indicator of economic performance. It is specified by
gross value added less labor cost or is measured by the gross revenue minus all expenses,
except depreciation, loan interest, and calculated interest on owner’s capital.
Pretax profit denotes the remaining value after depreciation and interest payment on
loans (except the calculated interest on owner’s capital) is deducted from the gross cash
flow.
Net profit (rent) is calculated as the gross revenue less all expenses, including the
calculated interest on owner’s capital. Thus, it is considered as an actual net reward after
all factors of production have received their compensation.
Profit margin is described as a ratio of pretax profit to gross revenue. This ratio
expresses what is left as compensation to the vessel owner’s capital in relation to gross
revenue as percentage of gross revenue.
The return on investment (ROI) is the ratio of pretax profit to the vessel owner’s
capital. This ratio shows what is left to the vessel owner as compensation for the
opportunity cost of the owner’s capital in relation to the owner’s capital as a percentage
of the capital of the vessel owner.
48
Pham Thanh Thai & Tran Thi Thu Hoa / Journal of Economic Development 23(4) 42-61
2.4. Econometrical model
Model of standardized fishing effort
In the fisheries effort is defined as the combined effect of the inputs used in fishing,
including fixed components of vessel and variable components. It comprises many
factors such as length of vessel, horse power, fishing time, a number of gears or
a number of boats, the skill of skippers and crew, and so forth (FAO, 2003). There
are two terms of fishing effort: nominal fishing effort (i.e. total time spent on fishing)
and effective fishing effort (fishing power of the vessel) (Cunningham & Whitmarsh,
1980). In the short term the vessel’s main characteristics such as weight, length, and
engine power are fixed, while the effort measured in days and hours of fishing (nominal
fishing effort) is flexible. However, this nominal effort may depend on the vessel’s
technical characteristics that have been built before, and all of them generate total fishing
effort (Flaaten, 2011)
Thus, it is very difficult to acquire the exact formulation to measure a fishing effort
because we need to base our measurement on biological and economic characteristics of
the fishery (Padilla et al., 1995). In all fisheries there are in fact fishing vessels of many
different shapes and sizes, using different kinds of equipment and fishing gear. To
compare the economic efficiency of these vessels, the effort of various kinds of boats
must be standardized (OECD, 2006).
In this study the standardized fishing effort for the vessels is estimated using the
production function approach to the effort. It has been validly adopted in many studies
of the fisheries sector. While Eide et al. (2003) applied this method for the estimation of
intra-annual variation in the CPUE, Nguyen et al. (2012) applied the production function
to fishing effort standardisation in gillnet vessels in Vietnam. The Schaefer harvest
function is a special form of the Cobb–Douglas function:
h (e,X) = qe1 X 2 (with 1 = 2 = 1)
where h is the produced catch, e is effort of each fishing vessel, given the stock level, X,
and the catchability coefficient, and q is a constant.
The product of fish harvesting firms is a function of effort and stock, and this can be
presented in the general form of the production function:
h = f (e, X)
Pham Thanh Thai & Tran Thi Thu Hoa / Journal of Economic Development 23(4) 42-61
49
With cross-sectional data for one year we assume that the stock level is constant. This
assumption implies that the production function is separable and hence takes the form:
h = f (g(x), X)
(1)
where e = g(x), and x is a vector of inputs. The separability generating the form of
Equation (1) is shown in Squires (1987), Campbell (1991), and Padilla and Trinidad
(1995) (Nguyen et al., 2012). Hence, the effort function of each vessel, g(x), can be given
in the form of Cobb-Douglas function as below:
ei = g (x1, x2,…, xn) = A x1 1 x2 2 ...xn
n
(2)
where ei is the standardized fishing effort of the vessel, xi is input i of the vessel, and
A is a constant. Equation (2) can be estimated through a log-linear model.
The main inputs often used in the production process are capital, capital utilization,
labor utilization, and fish stock (Pascoe et al., 2003). The level of capital employed in
the fishery can be measured in terms of monetary investments or physical inputs (boat
size, engine power) (Pascoe et al., 2003; Quach et al., 2009). Capital utilization can be
estimated in terms of either days fished or fuel use (Pascoe et al., 2003). Pascoe et al.
(2003) found that economic measures of capital are also subject to measurement errors.
They emphasized that physical measures are generally more robust (regarding
measurement), and are often more readily available.
Based on the characteristics of the fishery, this study uses the physical inputs
(measured in horsepower) and number of fishing days in a year as proxies for capital
invested and capital utilization, and employs number of crew size as the proxy for
variable input. All of these explanatory variables are identified as key factors affecting
the fishing effort of the vessel. The crew size is chosen as an important independent
variable in the purse seine fishery due to the fact that a fishing trip cannot be arranged if
there are not enough crew members. Additionally, the number of fishing days is referred
to as the volume of resource devoted to fishing and the physical input (horsepower),
used as proxy measures of capital invested and also considered the factors generating
the fishing effort. The log-linear effort function for vessel i can be written as follows:
ln ei 0 1 ln( HPi ) 2 ln(Crewsizei ) 3 ln( Daysi ) ui
(3)
50
Pham Thanh Thai & Tran Thi Thu Hoa / Journal of Economic Development 23(4) 42-61
where HP is horsepower of the vessel, Crewsize denotes number of crew members per
vessel employed, Days represents number of fishing days experienced by the vessel, and
ui is the random error term.
This fishing effort measure is often standardized to represent differences in relative
fishing power since engine capacity, hull length, and fishing days of vessels may vary.
Such standardized measures of the relative performance of different boats compensate
for heterogeneity in the fleet (FAO, 2003). Hence, in this study the relative standardized
effort is to be used instead of the standardized fishing effort to compare the economic
efficiency of different vessels.
In light of the definition of relative fishing power given by Beverton and Holt (1957),
e
the relative standardized fishing effort of vessel i can be described as i i ,
e
where i is the relative standardized fishing effort of vessel i , and e is the average
standardized effort of all vessels (Nguyen et al., 2012).
3. Data
The data for this study were collected from a survey of costs and earnings as well as
the technical and operational characteristics of purse seine vessels in Nha Trang City,
Khanh Hoa Province in 2011. This dataset, funded and used by Norwegian and Nha
Trang University, was also adopted in Pham and Flaaten (2013). The sample was
collected randomly with a sample size of 62 anchovy purse seines, representing about
46 % of such vessels in Nha Trang. The investigation process was performed with the
aim of obtaining a representative sample. Hull length was selected to test the sample
representativeness because of available data. Unfortunately, we only obtain the 2010
database of Khanh Hoa purse seiners. Therefore, assuming that the population of Khanh
Hoa inshore purse seiners in 2011 was the same as that in 2010, the 2010 population of
Khanh Hoa’s purse seine fleets is employed to test for the representativeness of the 2011
sample. The test results are reported in Table 1.
Pham Thanh Thai & Tran Thi Thu Hoa / Journal of Economic Development 23(4) 42-61
51
Table 1
Sample representativeness tests
Sample*
Variable
Hull length
N
Mean
S.D
62
14.29
1.15
Mean of the population**
T-Test statistic
14.07
1.51
Notes: * and ** denote authors’ data and calculations and the data obtained from Department of
Capture Fisheries and Fisheries Resources Protection (DECAFIREP) of Khanh Hoa (2010)
respectively.
In Table 1 an application of t-test statistic for sample representativeness tests is
performed. The selected level of significance of the test is 5%, so the critical values
of t distribution for this two-tail test are 2.5 percentile t(0.975, 61) = 1.9996. These results
show that the sample size of 62 anchovy purse seiners is considered representative for
Nha Trang’s anchovy purse seine vessels. Hence, the sample in this study can be used
as a reliable proxy for the whole population.
4. Empirical results
4.1. Economic performance indicators
Table 2 presents several major economic performance indicators for an average purse
seiner in 2011, including gross revenue, income, gross value added, gross cash flow, profit,
and net profit. The results suggest that these indicators are positive for an average vessel,
thereby implying that an average purse seine fishing vessel is able to cover all of the costs
and has a significant reward for the operating year.
52
Pham Thanh Thai & Tran Thi Thu Hoa / Journal of Economic Development 23(4) 42-61
Table 2
Economic performance indicators for the case of 62 anchovy purse seiners in 2011
Indicator
Min
Max
Mean
S.D.
800.00
2800.00
1762.26
519.34
392.00
1042.75
718.93
157.99
406.25
1757.25
1043.33
376.34
50.43
102.16
78.04
12.69
349.03
1664.02
965.29
365.27
216.00
675.00
481.74
144.93
Gross cash flow
47.45
989.08
483.55
254.03
Depreciation
33.33
215.00
139.08
50.31
Interest payment on loans
3.70
55.50
35.19
17.67
-23.88
723.58
330.85
196.65
42.00
156.80
102.57
28.07
Net profit (rent)
-65.88
583.58
228.28
176.43
Profit margin
-2.49%
28.05%
17.41%
6.59%
Return on investment (ROI)
-7.96%
86.47%
42.45%
19.14%
Gross revenue
Variable costs
Income
Fixed costs
Gross value added
Labor cost
Profit
Calculated interest on owner’s capital
4.2. Results of econometrical model
4.2.1. Results of standardized fishing effort function
Initially, we consider inputting many factors to generate the fishing effort. However,
we exclude some of them from the final model because they neither individually nor
jointly provide any evidence to support their statistically significant effects on fishing
effort of the vessel. Consequently, the physical inputs, horsepower and number of fishing
days, are used as proxy measures of capital invested and capital utilization in the fishery,
and the crew size is number of crew members per vessel employed for a fishing trip,
employed as the proxy for variable input. These variables are identified as the main
Pham Thanh Thai & Tran Thi Thu Hoa / Journal of Economic Development 23(4) 42-61
53
factors affecting the fishing effort of the vessel. The log-linear effort model for vessel i
is presented in Table 3.
Table 3
Parameter estimate and test statistics of standardized fishing effort function
Estimated coefficient
t-value
p-value
Constant
1.9427
2.1443
0.0362
ln(HP)
0.3151
16.256
0.0000***
ln(Crewsize)
0.3193
3.4137
0.0012***
ln(Days)
0.5966
3.4838
0.0009***
R2
0.9353
F
279.3504
0.0000***
Note: *** denotes significance level of 1%.
As shown in Table 3 the results indicate that the signs of all estimated coefficients
are positive, and the coefficients of horsepower, crew size, and fishing days are
statistically different from zero at 1% level or better. Furthermore, we perform f-test to
check the overall significance of the model. Since f-value = 279.3504 with p-value =
0.0000 and at least one of the parameters is not zero at the level of significance = 0.01
or better, we confirm that the estimated model is significant at 1% level. In addition, R2
= 0.9353 indicates that 95.43 % of the variation in the fishing effort is explained by the
variation in horsepower, by the variation in crew size, and also by the variation in the
number of days at sea. In this case the estimated model well fits the data.
However, a good regression model should not violate the least square assumptions,
so we conduct some various tests for errors in this circumstance, which include JarqueBera test for the normality of errors, Lagrange Multiplier test for autocorrelation, and
White test for the heteroskedasticity of the errors. Overall, these tests show that this
estimated model is well specified.
Furthermore, in this model the returns to the input can be measured by output
elasticities. The input that makes the largest contribution to the standardized fishing
effort is the number of days at sea. The coefficient of fishing days is about 0.5966, so an
increase of 1% in the number of days at sea leads to an increase in standardized fishing
effort of 0.5966% while other variables are held constant. The coefficients of
54
Pham Thanh Thai & Tran Thi Thu Hoa / Journal of Economic Development 23(4) 42-61
horsepower and crew size are 0.3151 and 0.3193 respectively. Thus, horsepower makes
the smallest contribution to the standardized fishing effort.
Next, we estimate the standardized fishing effort function. The equation used to
standardize the fishing effort for each vessel is:
ei = exp (1.9427)* HPi
0.3151
Crewi
0.3193
Daysi
0.5966
(4)
where HP is horsepower, Crewi is the number of crew members, and Days is the number
of fishing days of 2011.
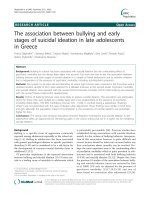
The results estimated from Equation (4) show that vessel number 31 has the lowest
standardized effort of 782.09, whereas the highest standardized effort of 2882.92 is
found for vessel number 48. The average standardized fishing effort, in addition, is
1,043.18 (units of effort) (see Figure 2).
3500
Standardized fishing effort
3000
2500
2000
1500
1000
500
0
1 2 3 4 5 6 7 8 9 10 11 1213 14 1516 17 1819 20 2122 23 2425 26 2728 29 3031 3233 34 3536 37 3839 40 4142 43 4445 46 4748 49 5051 52 5354 55 5657 58 5960 61 62
Vessel number (ID)
Figure 2. Results of standardized fishing effort of 62 anchovy purse seiners
4.2.2. Results of relative standardized fishing effort estimation
In order to compare the fishing effort and the costs among vessels the relative
standardized effort is calculated for each. Figure 3 shows that the minimum and
maximum values of relative standardized effort are 0.44 and 1.64 respectively, with
corresponding vessel numbers 31 and 48. An average value of relative standardized
effort is 1.00. There are 30 vessels with a relative standardized effort of greater than 1.0,
whereas 32 vessels have a relative standardized effort of less than 1.0. The majority of
Pham Thanh Thai & Tran Thi Thu Hoa / Journal of Economic Development 23(4) 42-61
55
vessels with the relative standardized effort of bigger than 1.0 have an engine capacity
of greater than 120 HP1.
1.8
1.6
Relative standadized effort
1.4
1.2
1
0.8
0.6
0.4
0.2
0
31 32 20 42 27 35 36 15 56 49 62 53 37 50 58 59 45 2 41 12 30 24 10 47 44 26 57 19 25 38 22 60 16 54 55 5 8 17 34 21 28 9 18 14 13 46 52 29 40 61 33 3 43 1 51 39 11 23 4 7 6 48
Vessel number (ID)
Figure 3. Results of relative standardized fishing effort of 62 anchovy purse seiners
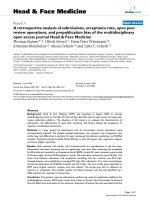
4.3. Estimated results of the profit under open-access regime
Figure 4 represents the level of rent generated among the vessels. Given any vessel
that has the average revenue above the average cost, they can get the profit, and the
reverse is true. This surplus is called intra-marginal rent. This rent accrues to those
vessels that have lower costs than their marginal costs.
Overall, intra-marginal rent is generated from the existence of heterogeneous vessels,
and the most cost-efficient vessels make above-normal profits (Coglan & Pascoe, 1999;
Flaaten, 2011). This is in contrast to the case of homogeneous vessels, for which the rent
equals zero. Thus, it is indicated that profits are generated even under the open-access
regime.
56
Pham Thanh Thai & Tran Thi Thu Hoa / Journal of Economic Development 23(4) 42-61
2000
Average cost and revenue per unit effort
AR(E)=1762.26
1500
1000
31
59
36 20
58
55
12
30
32
15
42
53 37
56
35 810 54
50
46 62 17
5 1 34 18 13 60 28 44 9
27 61 57 2 43
33
39
14
23
40 29
45
26
2122 16 2519 24
47
49
500 38 4 48
51 3 52 7
11 6
0
0
10
20
30
40
50
60
Relative standardized fishing effort
Figure 4. Estimated results of average revenue AR(E), average cost (bar heights), and
profit of 62 anchovy purse seine vessels in 2011
5. Discussion
5.1. Economic performance
The inshore purse seine vessels in the 2011 sample of this study, on average, have
positive income, gross value added, gross cash flow, and profit. The vessels earn a profit
margin of 17.4 %. This implies that the owner of an average purse seine vessel is not
only capable of covering all of the costs, but also earns a profit for the operating year. In
the same year the average annual income per crew member is about VND36.6 million
(about 2% more than that of other people in the Khanh Hoa province and about 26.7 %
higher than the 2011 national average income per capita). This demonstrates that crew
members may earn their opportunity cost of labor, or above, in the fishing season of
2011. The income of the crew members is based on the share system between the crew
and the owner. The crew members receive 40% or 50% after deduction of all operating
expenses. Therefore, the share system offers more incentives for the crew to work hard
and helps the vessel owners to use labor more efficiently (Quach et al., 2009).
Pham Thanh Thai & Tran Thi Thu Hoa / Journal of Economic Development 23(4) 42-61
57
In general, of all the coastal fisheries, the anchovy purse seine fishery is now
considered the most attractive one because of its high return ratio in comparison with
the annual bank deposit interest rates, being at 14% in 2011 (SBV, 2011). Consequently,
the purse seine fishery may continue expanding as well as attracting additional vessels
in this fishery in the near future.
5.2. Standardized fishing effort and relative standardized effort
Fishing effort is considered an intermediate output, which transfers from the factors
of production to harvesting quantity (Flaaten, 2011). The econometric results illustrate
that the engine power, the number of crew members, and the number of fishing days
have significant effects on the fishing effort. By calculating standardized fishing effort
and relative standardized fishing effort we have demonstrated the differences between
purse seiners. Furthermore, relative standardized effort also gives indices of relative
fishing power for each vessel. Therefore, by using production function we have
estimated the standardized fishing effort of each vessel in order to measure relative
standardized effort of the individual purse seiner. The relative standardized fishing effort
varies greatly from 0.44 to 1.64 with an average of 1.00. There are 30 vessels with the
relative standardized effort of greater than 1.0, whereas 32 vessels have the relative
standardized effort of less than 1.0 (Figure 4). Another determinant is such that purse
seiners in Nha Trang are heterogeneous in terms of effort and cost structures. As a
consequence, their economic efficiency and relative standardized effort are different.
5.3. Cost-efficient vessels and intra-marginal rent
In this study we have also examined which vessel is the most cost-efficient. Figure 4
plots the cost efficiency of 62 heterogeneous vessels. The relative standardized fishing
effort of each vessel is measured by the width of the bar, whereas the height of the bar
measures the average cost per unit of relative standardized effort. The vessels are
arranged from the left to the right according to their cost efficiency with vessel number
38 being the most cost efficient and vessel number 32 being the least cost efficient. We
notice that, for example, vessel number 23 produces 2.2 times as much effort as vessel
number 49, but this vessel is less cost-efficient than the latter. Figure 4 also displays 21
(out of the 32 vessels) with the relative standardized effort of above 1.0, which are found
to be among the most cost-efficient vessels. Thus, 11 vessels that are among the most
58
Pham Thanh Thai & Tran Thi Thu Hoa / Journal of Economic Development 23(4) 42-61
cost-efficient ones in terms of effort are not included in the most cost-efficient group
when the average costs are to be compared.
A combination between the average revenue per unit of relative standardized effort 2
and the average cost per unit of relative standardized effort of each vessel is to help
explain more clearly why profits are still generated even under the open-access regime.
Figure 4 also presents the level of rent generated among the vessels. Obviously, if
any vessel has the average revenue which is above the average cost, it can get the profit,
and the opposite is true. This surplus is called intra-marginal rent. This rent accrues to
those vessels whose costs are lower than the marginal cost. In this study the profit of the
fishery as of 2011 is generated by most vessels, excluding vessel number 32 that suffers
economic loss. This is based on the estimated cost and revenue as illustrated in Figure
4, but this is also the case when the accounting data having been collected for vessel 32
is used. However, by employing the accounting method we learn exactly the amount of
money that this numbered vessel has lost. The results also show that a large number of
vessels with high relative standardized effort (more than one) are the most efficient, from
both fishing efficiency and cost efficiency perspectives. As a result, intra-marginal rent
is generated mostly by these vessels, and the purse seine fishery may continue
expanding, as well as attract fishing investors to this type of fishery in the near future.
Either investments in engine capacity and fishing gear or an additional increase in fishing
time is suggested to sustain this growth. This seems to reflect a little of the situation of
Khanh Hoa’s fisheries due to the continued increase in the total engine power of the
fishing fleet in 2015 (DECAFIREP of Khanh Hoa, 2015). These results are similar to
the findings of Nguyen et al. (2015).
Overall, the main economic performance indicators have been adopted to estimate
the level of intra-marginal rent. The economic efficiency of the vessel is referred to as
the cost efficiency of the vessel’s effort. This could imply that even in an open-access
fishery some vessels may improve their economic performance with the introduction of
cost saving practices. It is also important to note that even under an open-access regime
many vessels may bring benefits to the whole community.
6. Conclusion
In a nutshell, the economic performance of inshore purse seine vessels in an openaccess fishery has been investigated in this study using a 2011 survey of costs and
Pham Thanh Thai & Tran Thi Thu Hoa / Journal of Economic Development 23(4) 42-61
59
earning data for a sample of 62 anchovy purse seiners in Nha Trang, Vietnam. The
presented economic analysis demonstrates that an average purse seiner is able to cover
all costs and earn a profit margin of 17.4%, and crew members could cover their
opportunity cost of labor or above. These results indicate that this purse seine fishery
has an attractive profit margin, compared with two of the offshore fisheries (Le et al.,
2008; Nguyen et al., 2012). As a result, the purse seine fleet may continue expanding its
scope or inspire fishing investors to this fishery in the coming years. Therefore, fisheries
management may use the information to design and implement policy instruments to
achieve the two major development goals as discussed above.
In order to compare the fishing effort and the costs the relative standardized effort
has been devised and estimated for the surveyed vessels. The empirical analysis indicates
that the most economically efficient vessels are mainly, but not only, those with high
relative standardized effort. These vessels are found to obtain most of the intra-marginal
rent and generate the most benefits for society.
The empirical findings of positive vessel profits and good crew earnings in the purse
seine fishery are indicative of possible further expansion of the capacity and effort of the
fleet in this open-access fishery, unless resource depletion comes first. From an objective
point of view regarding resource conservation, the results we have found suggest that
policies aiming to reduce the overall fishing effort should be instigated. A reduction in
the number of vessels or the number of days at sea spent by the fishermen could be a
way forward. It is necessary for these policies to aim at such reductions without reducing
revenue and catches of the remaining vessels. Furthermore, the programs devised to help
create alternative income by development of other sectors such as aquaculture and
agriculture and improve educational levels of fishermen could be implemented to
mitigate over-exploitation of the resources (Quach et al., 2009).
Coastal resources are becoming exhausted, while the size of vessels, the capacity of
engines, and the fishing pressure are still on the increase. Therefore, it is imperative to
have appropriate management policies to cope with the fishing pressure on coastal
waters, promote offshore fisheries, and regulate coastal fishing activities in
correspondence with the current stock status.
Furthermore, in order to maintain and foster the growth of the fisheries in a
sustainable way, developing offshore fisheries should be linked with geopolitical
objectives and border security reasons; territorial solutions can only be reached through
60
Pham Thanh Thai & Tran Thi Thu Hoa / Journal of Economic Development 23(4) 42-61
international negotiations and dispute settlement in accordance with international law
(Nguyen et al., 2015)
Notes:
1
More details will be provided upon request.
2
The average revenue per unit of relative standardized effort is
62
AR(E) =[
i 1
62
Total revenue of vessel i]/ [ Relative standardized effort of vessel i].
i 1
References
Beverton, R. J. H., & Holt, S. J. (1957). On the dynamics of exploited fish populations. London, UK:
Her Majesty's Stationery Office.
Coglan, L., & Pascoe, S. (1999). Separating resource rents from intra-marginal rents in fisheries’
economic survey data. Agriculture and Resource Economics Review, 28(2), 219–228.
Cunningham, S., & Whitmarsh, D. (1980). Fishing effort and fisheries policy. Marine Policy, 4(4),
309–316. doi:10.1016/0308-597X(80)90004-4
DECAFIREP of Khanh Hoa. (2010). The annual report of the number of vessels and engine power
registered in 2010 (in Vietnamese). Khanh Hoa, Vietnam: Department of Capture Fisheries and
Resources Protection of Khanh Hoa.
DECAFIREP of Khanh Hoa. (2015). The annual report of the number of vessels and engine power
registered in 2015 (in Vietnamese). Khanh Hoa, Vietnam: Department of Capture Fisheries and
Resources Protection of Khanh Hoa.
Eide, A., Skjold, F., Olsen, F., & Flaaten, O. (2003). Harvest functions: The Norwegian bottom trawl
cod fisheries. Marine Resource Economics, 18(1), 81–93.
European Commission. (2004). Economic performance of selected European fishing fleets. Brussels,
Belgium: European Commission.
European Commission. (2007). Economic performance of selected European fishing fleets. Brussels,
Belgium: European Commission.
FAO. (2003). Measuring and assessing capacity in fisheries. Rome, Italy: Food and Agriculture
Organization of the United Nations.
FAO. (2005). Report of the conference on the national strategy for marine fisheries
management and development in Vietnam. FAO/FishCode Review No.16. Rome, Italy: Food and
Agriculture Organization of the United Nations.
FAO. (2009). Fisheries and aquaculture country profiles—Vietnam. Rome, Italy: Food and Agriculture
Organization of the United Nations.
Pham Thanh Thai & Tran Thi Thu Hoa / Journal of Economic Development 23(4) 42-61
61
Flaaten, O. (2011). Fisheries economics and management. Tromsø, Norway: University of Tromsø.
Flaaten, O., Heen, K., & Salvanes, K. G. (1995). The invisible resource rent in limited entry and quota
managed fisheries: The case of Norwegian purse seine fisheries. Marine Resource Economics,
10(4), 341–356.
Gordon, H. S. (1954). The economic theory of a common-property resource: The fishery. The Journal
of Political Economy, 62(2), 124–142.
Le, K. L., Flaaten, O., & Nguyen, T. K. A. (2008). Economic performance of open-access offshore
fisheries—The case of Vietnamese longliners in the South China Sea. Fisheries Research, 93(3), 296–
304.
Luong, N. T. (2009). Economic performance indicators for coastal fisheries: The case of pure-seining
in Khanh Hoa, Vietnam. Tromsø, Norway: University of Tromsø.
Nguyen, N. D., Flaaten, O., & Le, K. L. (2015). Government support and profitability effects—
Vietnamese offshore fisheries. Marine Policy, 61, 77–86.
Nguyen, N. D., Flaaten, O., Nguyen, T. K. A., & Quach, T. K. N. (2012). Open-access fishing rent
and efficiency—The case of gillnet vessels in Nha Trang, Vietnam. Fisheries Research, 127–128,
98–108.
Padilla, J. E., & Trinidad, A. C. (1995). An application of production theory to fishing effort
standardization in the small-pelagics fishery in central Philippines. Fisheries Research, 22(1–2),
137–153.
Pascoe, S., Hassaszahed, P., Anderson, J., & Korsbrekke, K. (2003). Economic versus physical input
measures in the analysis of technical efficiency in fisheries. Applied Economics, 35(15), 1699–
1710.
Pham, T. T. T., & Flaaten, O. (2013). The backward-bending supply curve in fisheries-revisited.
Journal
of
Sustainable
Development,
6(6).
/>v6n6p15
Quach, T. K. N., Flaaten, O., & Nguyen, T. K. A. (2009). Efficiency of fishing vessels affected by
a marine protected area—The case of small-scale trawlers and the marine protected area in
Nha Trang Bay, Vietnam. In E. Dahl, E. Moksness & J. Stottrup (Eds.), Integrated coastal zone
management (pp. 189–206). Malden, MA: Blackwell Publishing.
SBV. (2011). On the base interest rate in Vietnamese Dong. Retrieved from .
gov.vn
Tang, T. H. (2011). Measuring capacity and capacity utilization in small-scale fisheries in Nha Trang.
Tromsø, Norway: University of Tromsø.