Health and Quality of Life Outcomes BioMed Central Research Open Access What is the relationship docx
Bạn đang xem bản rút gọn của tài liệu. Xem và tải ngay bản đầy đủ của tài liệu tại đây (370.5 KB, 8 trang )
BioMed Central
Page 1 of 8
(page number not for citation purposes)
Health and Quality of Life Outcomes
Open Access
Research
What is the relationship between the minimally important
difference and health state utility values? The case of the SF-6D
Stephen J Walters* and John E Brazier
Address: Sheffield Health Economics Group, School of Health and Related Research, University of Sheffield, Regent Court, 30 Regent Street,
Sheffield, S1 4DA, UK
Email: Stephen J Walters* - ; John E Brazier -
* Corresponding author
Abstract
Background: The SF-6D is a new single summary preference-based measure of health derived
from the SF-36. Empirical work is required to determine what is the smallest change in SF-6D
scores that can be regarded as important and meaningful for health professionals, patients and
other stakeholders.
Objectives: To use anchor-based methods to determine the minimally important difference
(MID) for the SF-6D for various datasets.
Methods: All responders to the original SF-36 questionnaire can be assigned an SF-6D score
provided the 11 items used in the SF-6D have been completed. The SF-6D can be regarded as a
continuous outcome scored on a 0.29 to 1.00 scale, with 1.00 indicating "full health".
Anchor-based methods examine the relationship between an health-related quality of life (HRQoL)
measure and an independent measure (or anchor) to elucidate the meaning of a particular degree
of change. One anchor-based approach uses an estimate of the MID, the difference in the QoL scale
corresponding to a self-reported small but important change on a global scale. Patients were
followed for a period of time, then asked, using question 2 of the SF-36 as our global rating scale,
(which is not part of the SF-6D), if there general health is much better (5), somewhat better (4),
stayed the same (3), somewhat worse (2) or much worse (1) compared to the last time they were
assessed. We considered patients whose global rating score was 4 or 2 as having experienced some
change equivalent to the MID. In patients who reported a worsening of health (global change of 1
or 2) the sign of the change in the SF-6D score was reversed (i.e. multiplied by minus one). The
MID was then taken as the mean change on the SF-6D scale of the patients who scored (2 or 4).
Results: This paper describes the MID for the SF-6D from seven longitudinal studies that had
previously used the SF-36.
Conclusions: From the seven reviewed studies (with nine patient groups) the MID for the SF-6D
ranged from 0.010 to 0.048, with a weighted mean estimate of 0.033 (95% CI: 0.029 to 0.037). The
corresponding Standardised Response Means (SRMs) ranged from 0.11 to 0.48, with a mean of 0.30
and were mainly in the "small to moderate" range using Cohen's criteria, supporting the MID
results. Using the half-standard deviation (of change) approach the mean effect size was 0.051
(range 0.033 to 0.066). Further empirical work is required to see whether or not this holds true
for other patient groups and populations.
Published: 11 April 2003
Health and Quality of Life Outcomes 2003, 1:4
Received: 7 February 2003
Accepted: 11 April 2003
This article is available from: />© 2003 Walters and Brazier; licensee BioMed Central Ltd. This is an Open Access article: verbatim copying and redistribution of this article are permitted
in all media for any purpose, provided this notice is preserved along with the article's original URL.
Health and Quality of Life Outcomes 2003, 1 />Page 2 of 8
(page number not for citation purposes)
Introduction
Health Related Quality of Life (HRQoL) outcome meas-
ures are being increasingly used in research trials, but less
so in routine clinical practice. The interpretation of HR-
QoL scores raises many issues. [1–7] The scales and instru-
ments used may be unfamiliar to many clinicians and
patients, who may be uncertain of the meaning of the
scale values and summary scores. [8]
Repeated experience and familiarity with a wide variety of
physiological measures such as blood pressure or forced
expiratory volume, has allowed clinicians to make mean-
ingful interpretation of the results. [9,10] In contrast, the
meaning of a change in score of x points on a HRQoL in-
strument is less intuitively apparent, not only because the
scale has unfamiliar units, but also because health profes-
sionals seldom use HRQoL measures in routine clinical
practice.
In clinical trials, where HRQoL instruments are being in-
creasingly used as primary outcome measures, it is simple
to determine the statistical significance of a change in HR-
QoL, but placing the magnitude of these changes in a con-
text that is meaningful for health professionals, patients
and other stakeholders (Pharmaceutical and Medical De-
vice Developers, Insurance Payers, Regulators, Govern-
ments) has not been so easy. Ascertaining the magnitude
of change that corresponds to a minimal important differ-
ence would help address this problem. [11] So when de-
termining an important change standard the perspective
can influence the assessment approach and the way in
which an important difference is determined. [5] The
minimal important difference (MID), from the patient
perspective, can be defined as "the smallest difference in
score in the domain of interest which patients perceive as bene-
ficial and which would mandate, in the absence of troublesome
side effects and excessive cost, a change in the patient's
management". [9]
Thus, individual change standards are needed to provide
meaningful interpretation of HRQoL intervention and
treatment effects and to classify patients based on this
standard as improved, stable or declined. To date two
broad strategies have been used to interpret differences or
changes in HRQoL following treatment: [12] distribution
based approaches – the effect size (ES); and anchor-based
measures – the minimum clinically important difference
(MCID).
Distribution based approaches rely on relating the differ-
ence between treatment and control groups to some
measure of variability. The most popular approach uses
Cohen's [13] standardised effect size, the mean change di-
vided by the standard deviation to serve as an "effect size
index", that is suitable for sample size estimation. Cohen
suggested that standardised effect sizes of 0.2 to 0.5
should be regarded as "small", 0.5 to 0.8 as "moderate"
and those above 0.8 as "large". Cohen's effect size may be
influenced by the degree of homogeneity or heterogeneity
in the sample. Distribution-based methods rely on ex-
pressing an effect in terms of the underlying distribution
of the results. Investigators may express effects in terms of
between-person standard deviation units, within-person
standard deviation units, and the standard error of meas-
urement. [2]
Four statistics commonly used to index responsiveness
are: [14]
1. effect size; [15]
2. t-test comparisons; [16]
3. the standardised response mean; [17]
4. the responsiveness statistic. [18]
The formula for these statistics are as follows, where D =
raw score change on measure; SE = standard error of the
difference; SD = standard deviation at time 1; SD* =
standard deviation of D; SD# = standard deviation of D
among stable subjects (those who true status is constant
over time):
Paired t-statistics = D/SE
Effect size (ES) statistic = D/SD
Standardised response mean (SRM) = D/SD*
Responsiveness statistic = D/SD#
The paired t-statistic is best suited to pre-post assessments
of interventions of known efficacy. The effect size statistic
relates change over time to the standard deviation of base-
line scores. The standardised response mean compares
change to the standard deviation of change. The respon-
siveness statistic looks at HRQoL change relative to varia-
bility for clinically stable respondents. The effect size
statistic ignores variation in change entirely, the t-statistic
ignores information about variation in scores for clinical-
ly stable respondents, and the responsiveness statistic ig-
nores information about variation in scores for clinically
unstable responders.
Anchor-based methods examine the relationship between
an HRQoL measure and an independent measure (or an-
chor) to elucidate the meaning of a particular degree of
change. Thus anchor-based approaches require an inde-
pendent standard or anchor that is itself interpretable and
Health and Quality of Life Outcomes 2003, 1 />Page 3 of 8
(page number not for citation purposes)
at least moderately correlated with the instrument being
explored. [2] One anchor-based approach uses an esti-
mate of the MID, the difference on the HRQoL scale cor-
responding to self-reported small but important change
on a global scale.[9]
Norman et al mention several problems with the global
assessment of change including, that the reliability and
validity of the global scale has not been established and
that the judgement of change is psychologically difficult.
[19] Another limitation of the global rating is that is does
not represent a criterion or gold standard for assessment
of change and yet we use the global rating as an anchor to
define small, medium and large changes. [9,11]
No single approach to interpretability is perfect. As Guyatt
et al suggest the use of multiple strategies is likely to en-
hance the interpretability of any particular instrument. [2]
Therefore we used both distribution and anchor-based ap-
proaches to try and establish the interpretability of the SF-
6D, a new single summary preference-based measure of
health derived from the SF-36.
The SF-36 is one of the most widely used HRQoL outcome
measures in the world today. It contains 36 questions
measuring health across eight dimensions – physical func-
tioning, role limitation because of physical health, social
functioning, vitality, bodily pain, mental health, role lim-
itation because of emotional problems and general
health. Responses to each question within a dimension
are combined to generate a score from 0 to 100, where
100 indicates "good health". [20] Thus, the SF-36 gener-
ates a profile of HRQoL outcomes (on up to eight dimen-
sions), which makes statistical analysis and interpretation
difficult. [8]
The developers of the SF-36 have suggested that using the
general health dimension a five-point difference (on the
0–100 scale) is the smallest score change achievable by an
individual and considered as 'clinically and socially rele-
vant'. [21] Angst et al found the MCID ranged from 3.3 to
5.3 points on the physical function dimension and 7.2 to
7.8 points on the bodily pain dimension in patients with
osteoarthritis of the hip or knee. [22] Hays and Morales
also provide information on what a clinically important
difference is for the SF-36 scales. They conclude that the
MCID for the SF-36 is "typically in the range of 3–5
points", although they also recommend caution in inter-
preting 3–5 points on the SF-36 dimensions as the MCID.
[23]
The method of scoring the SF-36 is not based on prefer-
ences. The simple scoring algorithm for the eight dimen-
sions assumes equal intervals between the response
choices, and that all items are of equal importance, which
may not be appropriate. The SF-6D is a new single sum-
mary preference based or utility measure of health derived
from the SF36. [24,25] Empirical work is required to de-
termine what is the smallest change in SF-6D scores that
can be regarded as important. We used anchor-based
methods to determine the MID for the SF-6D for various
datasets.
Methods
The Questionnaire: SF-6D Health State Classification
The SF-36 was revised into a six-dimensional health state
classification called the SF-6D. The six dimensions are
physical functioning, role limitations, social functioning,
pain, mental health and vitality. These six dimensions
each have between two and six levels. An SF-6D "health
state" is defined by selecting one level from each dimen-
sion. A total of 18,000 health states are thus defined. All
responders to the original SF-36 questionnaire can be as-
signed SF-6D score provided the 11 items used in the six
dimensions of the SF-6D have been completed. The SF-6D
preference-based measure can be regarded as a continu-
ous outcome scored on a 0.29 to 1.00 scale, with 1.00 in-
dicating "full health". [24,25]
The studies
The data used in this paper comes from seven longitudinal
studies and (nine patient groups), which used the SF-36
including randomised controlled trials, [26] and observa-
tional studies. [27–30]
Global Rating of change (GRoC)
Patients were followed for a period of time, then asked,
using question 2 of the SF-36 as our global rating of
change scale, (which is not part of the SF-6D), if:
2. Compared to one year ago, how would you rate your
health in general now?
(5) Much better now than one year ago
(4) Somewhat better now than one year ago.
(3) About the same
(2) Somewhat worse now than one year ago.
(1) Much worse now than one year ago
The original question 2 of the SF36 compares health now
with one year ago. Depending on the follow-up time we
used a slightly modified version: e.g. health now com-
pared to three (or six) months ago.
Health and Quality of Life Outcomes 2003, 1 />Page 4 of 8
(page number not for citation purposes)
Statistical Analysis
We examined the relationship between the global ratings
of change question and changes in SF-6D score, by calcu-
lating the change in SF-6D score from 1
st
to 2
nd
assess-
ment for each patient. We considered patients whose
GRoC score was 4 or 2 as having experienced some change
equivalent to the MID. In patients who reported a worsen-
ing of health (GRoC of 1 or 2) the sign of the change in
the SF-6D score was reversed (i.e. multiplied by minus
one). The MID was then taken as the mean change on the
SF-6D scale of the patients who scored (2 or 4).
Since the SF-6D is a continuous measure of effect we used
meta-analytic methods to estimate the weighted grand
mean of the MID and to test the hypothesis of homogene-
ity of MID across the nine studies. If there was no statisti-
cal evidence of lack of homogeneity, a 95% confidence
interval for the summary estimate of the MID was then
calculated. [31,32]
We also used a distribution-based approach and calculat-
ed a standardised response mean (SRM). Since the stand-
ard error of the SRM is not defined we used bootstrap
methods to estimate 95% confidence intervals for the
SRM. [33]
Global measures of change are typically highly correlated
with the present state and uncorrelated with the initial
state. Any measure of change that reflects the unbiased dif-
ference between the final and initial state, should show a
positive correlation with the final state and an equal neg-
ative correlation with the initial state. [19] We therefore
also calculated Pearson's product moment correlations
between the GRoC question and the baseline and follow-
up SF-6D scores.
Results
This paper describes the MID for the SF-6D from a variety
of longitudinal studies, with different patient groups and
length of follow-up that had previously used the SF-36
(Table 1).
Table 2 shows that from the nine patient groups the MID
for the SF-6D ranged from 0.010 to 0.048, with a mean
0.030 and a median 0.032. The wide confidence intervals
for the MID estimates, including negative values, reflect
both the uncertainty in the estimates and the small study
sizes. The corresponding effect sizes (SRMs) ranged from
0.11 to 0.48, mean 0.30 and were mainly in the "small to
moderate" range using Cohen's criteria. Using a half-
standard deviation of change approach the mean effect
size was 0.051 and ranged from 0.033 to 0.066. This sug-
gests that the results obtained through the MID method
are reasonable and generally of similar size to the effect
size (SRM) estimates. It demonstrates that regardless of
the method used, the actual cut-off point for a clinically
important difference is going to be in the same neighbour-
hood, thereby making the particular method of approach
less important.
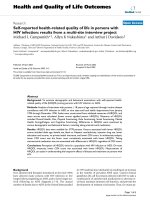
As expected since the MID and SRM both contain the
mean change, Figure 2 shows there was a strong correla-
tion (r = 0.70, p = 0.014) between the MID and SRM esti-
mates (see Figure 1). There was no reliable evidence of an
association between the MID and the time between as-
sessments (correlation r = 0.24, p = 0.54) in our nine
studies.
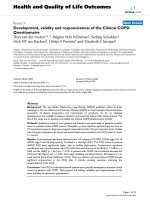
There was no reliable statistical evidence of lack of homo-
geneity in the MID estimates across the nine studies (χ
2
=
13.41 on 8 df, p = 0.098). Therefore it seemed reasonable
to combine the MID estimates from the nine studies to
produce an overall weighted grand mean MID estimate of
0.033 (95% CI: 0.029 to 0.037). Figure 3 shows a forest
Table 1: The nine longitudinal studies
Study/patient group Total study size Number who reported some change Period of time
Older adults (aged >65 years): 1st follow-up 4945 1362 Baseline to year 1
Older adults (aged >65 years): 2nd follow-up 3127 948 Year 1 to year 2
Irritable bowel syndrome (IBS) patients 137 56 Baseline to 3 months
Irritable bowel syndrome (IBS) control patients 177 27 Baseline to 3 months
Leg ulcer patients 194 45 Baseline to 3 months
Knee Osteoarthritis (OA) patients 157 59 Baseline to 6 months
Limb reconstruction patients 60 29 Baseline to year 1
Early Rheumatoid Arthritis (RA) patients 246 99 Baseline to year 1
Patients with Chronic Obstructive Pulmonary Dis-
ease (COPD)
60 29 Baseline to year 1
Total study size = no. of patients with valid baseline and follow-up SF-6D score and follow-up global change score.
Health and Quality of Life Outcomes 2003, 1 />Page 5 of 8
(page number not for citation purposes)
plot of the MID estimates and associated confidence
limits for the nine studies and the estimated combined
overall weighted grand mean MID.
The combining of the "somewhat worse" and "somewhat
better" groups assumes the two cohorts are identical ex-
cept for the sign. Table 3 suggests some evidence that the
magnitude of the MID for those who improved and those
whose deteriorated is different, but this result was not sta-
tistically significant.
Table 4 shows the moderate correlations (mean 0.45,
range: 0.18 to 0.57) were found between response to glo-
bal change (anchor) GRoC question and the SF-6D at fol-
low-up across the 9 studies. Lower correlations (mean
0.22, range: 0.01 to 0.41) were found between the re-
sponse to the GRoC question and the SF-6D score at ini-
tial assessment across the nine studies.
Discussion
We used a five-point GRoC scale; others have used seven
or 14 points, which may be more sensitive. [9,11]
Although the designation of what GRoC suggests patients
as fundamentally unchanged and what GRoC suggests pa-
tients have experienced a small but important change is
inevitably subjective.
The reliability and validity of a single GRoC question has
not been established. Multi-item scales may have better
reliability. Indeed if the single GRoC could be shown to
Table 2: Minimum Important Difference (MID's) and Effect Sizes (SRM's)
Study/patient group N MID – Mean change in
SF-6D (95% CI)*
Standard Deviation Effect Size (SRM)
(95% CI)*
0.5 of a Standard
Deviation
Older adults 1st follow-up 1362 0.039 (0.034 to 0.044) 0.099 0.39 (0.35 to 0.45) 0.050
Older adults 2nd follow-up 948 0.026 (0.021 to 0.033) 0.096 0.27 (0.22 to 0.34) 0.048
IBS patients 56 0.023 (-0.001 to 0.050) 0.096 0.24 (-0.03 to 0.52) 0.048
IBS control patients 27 0.025 (-0.013 to 0.071) 0.113 0.22 (-0.15 to 0.62) 0.057
Leg ulcer patients 45 0.032 (-0.001 to 0.071) 0.131 0.24 (-0.06 to 0.53) 0.066
OA Knee patients 59 0.032 (0.015 to 0.049) 0.066 0.49 (0.22 to 0.73) 0.033
Limb reconstruction patients 29 0.048 (0.007 to 0.091) 0.120 0.40 (-0.02 to 0.79) 0.060
Early (RA) patients 99 0.039 (0.017 to 0.061) 0.112 0.33 (0.14 to 0.58) 0.056
COPD Patients 29 0.010 (-0.019 to 0.043) 0.087 0.11 (-0.28 to 0.47) 0.044
*Bootstrap Bias-Corrected and accelerated (BCA) 95% Confidence Intervals.
Figure 1 Figure 2
Health and Quality of Life Outcomes 2003, 1 />Page 6 of 8
(page number not for citation purposes)
have superior measurement properties, then there is no
reason not to simply use this a measure of HRQoL. Al-
though Wyrwich found moderate-to-substantial agree-
ment between the responses to question 2 of the SF-36
(weighted Kappa 0.64 – 0.73) at test and re-test (1–4 days
later) in a group of 241 patients with asthma, coronary ar-
tery disease, congestive heart failure and COPD. This re-
sult provides some evidence of the usefulness of
retrospective GRoC as patient-perceived anchors for ascer-
taining important HRQoL changes. [34]
The judgement of change is psychologically difficult. Pa-
tients must be able to quantify both their present state and
their initial state and then perform a mental subtraction.
Patients may be unable to recall their initial state, and the
judgement is based on their present state and working
backwards. Any measure of change that reflects the unbi-
ased difference between the final and initial state, should
show a positive correlation with the final state and an
equal negative correlation with the initial state. [19] Our
results found larger correlations between the global meas-
ures of change with the present state (HRQoL) and far
lower correlations with the initial state, supporting this
hypothesis.
The length of time between 1
st
and 2
nd
assessments was
up to a year, which is far larger than the timeframes used
in other studies (e.g. 2 weeks for Jaeschke et al [9] and 4
weeks for Juniper et al [11]). This may be a limitation of
this study in the evaluation of clinical change, as patients
may have some difficulty recalling their previous state of
health. However, we found no reliable evidence of an as-
sociation between the MID and the time between assess-
ments in our nine studies. Although preliminary results
with two older adults cohorts suggest some form of 'Re-
sponse shift' and that the MID may not be constant over
time.
We combined the worse and better groups into one and
assumed that the magnitude of the MID for these two co-
horts were identical except for the sign. We found no
reliable statistical evidence that the magnitude of the MID
for those who improved and deteriorated was different.
This may be explained by the small sample sizes for some
of the studies and the low power to detect anything other
than large differences in the mean changes. Thus the small
sample sizes can explain the lack of statistical significance
Table 3: Magnitude of the MID by worse/better
Global rating of health change
Somewhat worse Somewhat better
Study/patient group N Mean change
(SD)
NMean change
(SD)
Mean Difference (95% CI) P-value
Older adults 1st follow-up 1087 0.039 (0.099) 275 0.042 (0.098) -0.004 (-0.017 to 0.009) 0.58
Older adults 2nd follow-up 783 0.028 (0.095) 165 0.019 (0.102) 0.009 (-0.008 to 0.026) 0.32
IBS patients 36 0.022 (0.096) 20 0.026 (0.097) -0.040 (-0.059 to 0.051) 0.87
IBS control patients 15 0.017 (0.130) 12 0.035 (0.094) -0.018 (-0.107 to 0.071) 0.69
Leg ulcer patients 14 0.082 (0.109) 31 0.009 (0.105) 0.073 (-0.03 to 0.176) 0.08
OA Knee patients 30 0.003 (0.073) 29 0.036 (0.059) -0.007 (-0.041 to 0.028) 0.70
Limb reconstruction patients 10 0.044 (0.14) 19 0.051 (0.112) -0.007 (-0.117 to 0.102) 0.88
Early (RA) patients 17 -0.007 (0.117) 82 0.046 (0.109) -0.053 (-0.117 to 0.011) 0.08
COPD Patients 19 0.012 (0.095) 10 0.006 (0.074) 0.006 (-0.061 to 0.072) 0.87
P-value from two-independent samples t-test.
Figure 3
Health and Quality of Life Outcomes 2003, 1 />Page 7 of 8
(page number not for citation purposes)
of the difference in MID between the worse and better
groups, but not the overall size of the observed mean dif-
ference, which for some studies was more than twice as
great in one group compared to the other.
We used a single anchor; our results require validation
with alternative anchors or multiple anchor methods.
Other approaches to interpretating changes in HRQOL are
available including two similar distribution approaches,
e.g. Jacobson's Reliable Change Index [35,36] and Wyr-
wich's Standard Error of Measurement. [37,38]
The SF-6D is an example of a utility or preference-based
measure of HRQoL. The primary use of such measures is
to adjust life years saved by quality for use in economic
evaluations and decision models. Preference-based health
state scores or utilities do not have natural units. Since
health is a function of both length of life and quality of
life, the QALY (Quality-adjusted life year) has been devel-
oped in an attempt to combine the value of these at-
tributes into a single index number. If utilities are
multiplied by the amount of time spent in that particular
health state then they become QALYs (and are measured
in units of time). QALYs allow for varying times spent in
different states by calculating an overall score for each pa-
tient. For the studies where the follow-up is one year (e.g.
the two older adults cohorts) the mean change in utility
scores over the one year can be directly interpreted as the
MID for a QALY.
QALYs may have the potential to influence public policy
and resource allocation decisions. Results from other pref-
erence based measures, such as the 15D and Health Utili-
ties Index suggests a difference of 0.03 is considered the
minimum clinically important difference for sample size
calculations. Finally, as Drummond suggests, in the case
of preference-based measures, if the ultimate objective is
to influence resource allocation decisions, then it is the
difference in cost-effectiveness (e.g. incremental cost per
QALY) that is important, not the change in quality of life.
Therefore changes in the measure alone may not be of in-
terest without also considering the cost of bringing about
such changes. [39]
Our findings are also limited in that a change in SF-6D
score of 0.033 is important when the instrument is used
for examining within-patient changes, but this does not
necessarily mean that a difference of 0.033 will signify the
MID when the instrument is used to discriminate between
patients.
Despite the absence of a gold standard (criterion) meas-
ure, establishing the mean of any changes in a new meas-
ure like the SF-6D requires some sort of independent
standard. The GRoC represents one credible alternative.
Whilst we have not established with certainty a single best
estimate of the MID for the SF-6D, our data suggest a plau-
sible range within which the MID probably falls. This in-
formation will be useful in the interpreting SF-6D scores,
both in individuals and in groups of patients participating
in trials. It will also be useful in the planning of new trials,
as sample size depends on the magnitude of the difference
investigators consider important and are not willing to
risk failing to detect. [40]
Summary and Conclusions
From the nine reviewed studies the MID for the SF-6D
ranged from 0.010 to 0.048, weighted mean 0.033 (95%
CI: 0.029 to 0.037). The corresponding SRMs ranged from
0.11 to 0.48, mean 0.30 and were mainly in the "small to
moderate" range using Cohen's criteria, supporting the
MID results. Using a half-standard deviation of change ap-
proach the mean effect size was 0.051 and ranged from
0.033 to 0.066. This suggests that the results obtained
Table 4: Correlations between global health change scale and baseline and follow-up SF-6D scores.
Baseline Follow-up
Study/patient group N r p-value r p-value
Older adults (aged >65 years): 1st follow-up 4945 0.324 0.001 0.390 0.001
Older adults (aged >65 years): 2nd follow-up 3127 0.395 0.001 0.514 0.001
Irritable bowel syndrome (IBS) patients 137 0.311 0.001 0.441 0.001
Irritable bowel syndrome (IBS) control patients 177 0.094 0.215 0.202 0.007
Leg ulcer patients 194 0.041 0.572 0.309 0.001
Knee Osteoarthritis (OA) patients 157 0.300 0.001 0.559 0.001
Limb reconstruction patients 60 -0.007 0.959 0.458 0.001
Early Rheumatoid Arthritis (RA) patients 246 0.147 0.021 0.524 0.001
Patients with Chronic Obstructive Pulmonary
Disease (COPD)
60 0.391 0.002 0.547 0.001
r = Pearsons Correlation Coefficient
Health and Quality of Life Outcomes 2003, 1 />Page 8 of 8
(page number not for citation purposes)
through the MID method are reasonable and generally of
similar size to the effect size (SRM) estimates. It demon-
strates that regardless of the method used, the actual cut-
off point for a clinically important difference is going to
be in the same neighbourhood, thereby making the par-
ticular method of approach less important. However, fur-
ther empirical work is required to see whether or not these
results hold true for other patient groups and populations.
References
1. Sloan JA, Cella D, Frost M, Guyatt GH, Sprangers M, Symonds T and
and the Clinical Significance Consensus Meeting Group Assessing
clinical significance in measuring oncology patient quality of
life: introduction to the symposium, content overview, and
definition of terms Mayo Clinic Proceedings 2002, 77(4):367-370
2. Guyatt GH, Osoba D, Wu AW, Wyrwich KW, Norman GR and and
the Clinical Significance Consensus Meeting Group Methods to ex-
plain the clinical significance of health status measures Mayo
Clinic Proceedings 2002, 77(4):371-383
3. Cella D, Bullinger M, Scott C, Barofsky I and and the Clinical Signifi-
cance Consensus Meeting Group Group vs. individual approach-
es to understanding the clinical significance of differences or
changes in quality of life Mayo Clinic Proceedings 2002, 77(4):384-
392
4. Sloan JA, Aaronson N, Cappelleri JC, Fairclough DL, Varricchio C and
Clinical Significance Consensus Meeting Group Assessing the clini-
cal significance of single items relative to summated scores
Mayo Clinic Proceedings 2002, 77(5):479-487
5. Frost MH, Bonomi AE, Ferrans CE, Wong GY, Hays RD and and the
Clinical Significance Consensus Meeting Group Patient, clinician,
and population perspectives on determining the clinical sig-
nificance of quality-of-life scores Mayo Clinic Proceedings 2002,
77(5):488-494
6. Sprangers MA, Moinpour CM, Moynihan TJ, Patrick DL, Revicki DA
and and the Clinical Significance Consensus Meeting Group Assess-
ing meaningful change in quality of life over time: a users'
guide for clinicians Mayo Clinic Proceedings 2002, 77(6):561-571
7. Symonds T, Berzon R, Marquis P, Rummans TA and and the Clinical
Significance Consensus Meeting Group The clinical significance of
quality-of-life results: practical considerations for specific
audiences Mayo Clinic Proceedings 2002, 77(6):572-583
8. Fayers PM and Machin DM Quality of Life: Assessment, Analysis &
Interpretation Chichester: Wiley 2000,
9. Jaeschke R, Singer J and Guyatt GH Measurement of Health Sta-
tus. Ascertaining the Minimal Clinically Important
Difference Controlled Clinical Trials 1989, 10:407-415
10. Sloan J, Symonds T, Vargas-Chanes D and Fridley B Practical Guide-
lines for Assessing the Clinical Significance of Health-Related
Quality of Life Changes within Clinical Trials Drug Information
Journal 2003, 37(1):23-31
11. Juniper EF, Guyatt GH, Willan A and Griffith LE Determining a
minimal important change in a disease-specific Quality of
Life Questionnaire Journal of Clinical Epidemiology 1994, 47(1):81-
87
12. Norman GR, Sridhar FG, Guyatt GH and Walter SD The Relation
of Distribution- and Anchor-Based Approaches in
Interpretation of Changes in Health Related Quality of Life
Medical Care 2001, 39(10):1039-1047
13. Cohen J Statistical Power Analysis for the Behavioural Sciences New Jersey:
Lawrence Earlbaum 1988,
14. Staquet MJ, Hays RD and Fayers PM Quality of Life Assessment in Clinical
Trials: Methods and Practice Oxford University Press: Oxford 1998,
15. Kazis LE, Anderson JJ and Meenan RF Effect Sizes for Interpreting
Changes in Health Status Medical Care 1989, 27(3):S178-S189
16. Liang MH, Larson MG, Gullen KE and Schwartz JA Comparative
measurement efficiency and sensitivity of five health status
instruments for arthritis research Arthritis & Rheumatology 1985,
28:545-547
17. Liang MH, Fossel AH and Larson MG Comparisons of Five Health
Status Instruments for Orthopaedic Evaluation Medical Care
1990, 28(7):632-642
18. Guyatt GH, Walter S and Norman G Measuring change over
time: assessing the usefulness of evaluative instruments Jour-
nal of Chronic Disease 1987, 40:171-178
19. Norman GR, Stratford P and Regehr G Methodological Problems
in the Retrospective Computation of Responsiveness to
Change: The Lesson of Cronbach J Clinical Epidemiology 1997,
50(8):869-879
20. Ware JE Jr and Sherbourne CD The MOS 36-item short-form
health survey (SF-36). I. Conceptual framework and item
selection Medical Care 1992, 30:473-483
21. Ware JE Jr, Snow KK, Kosinski M and Gandek B SF-36 Health Survey
Manual and Interpretation Guide Boston, MA: The Health Institute, New
England Medical Centre 1993,
22. Angst F, Aeschlimann A and Stucki G Smallest detectable and
minimal clinically important differences of rehabilitation in-
tervention with their implications for required sample sizes
using WOMAC and SF-36 quality of life measurement in-
struments in patients with osteoarthritis of the lower
extremities Arthritis & Rheumatism 2001, 4:384-391
23. Hays RD and Morales LS The RAND-36 measure of health-re-
lated quality of life Annals of Medicine 2001, 33(5):350-357
24. Brazier J, Usherwood T, Harper R and Thomas K Deriving a Pref-
erence-based Single Index from the UK SF-36 Health Survey
J Clin Epidemiol 1998, 51(11):1115-1128
25. Brazier JE, Roberts JF and Deverill MD The estimation of a pref-
erence based measure of health from the SF-36 Health
Economics 2002, 21:271-292
26. Morrell CJ, Walters SJ, Dixon S, Collins KA, Brereton LML, Peters J
and Brooker CGD Cost-effectiveness of community leg ulcer
clinics: randomised controlled trial British Medical Journal 1998,
316:1487-1491
27. Walters SJ, Munro JF and Brazier JE Using the SF-36 with older
adults: cross-sectional community based survey Age & Ageing
2001, 30:337-343
28. Akehurst RL, Brazier JE, Mathers N, Healy C, Kaltenthaler E, Morgan
AM, Platts M and Walters SJ Health-related Quality of Life and
Cost Impact of Irritable bowel Syndrome in a UK Primary
Care Setting Pharmacoeconomics 2002, 20(7):455-462
29. Harper R, Brazier JE, Waterhouse JC, Walters SJ, Jones NMB and
Howard P Comparison of outcome measures for patients
with chronic obstructive pulmonary disease (COPD) in an
outpatient setting Thorax 1997, 52:879-887
30. Brazier JE, Harper R, Munro JF, Walters SJ and Snaith ML Generic
and condition-specific outcome measures for people with os-
teoarthritis of the knee Rhemautology 1999, 38:870-877
31. Petitti D-B Meta-analysis, Decision Analysis, Cost-Effective-
ness Analysis Methods for Quantitative Synthesis in Medicine Oxford,
Oxford University Press 1994,
32. Armitage P, Berry G and Matthews JNS Statistical Methods in Medical
Research Oxford: Blackwell 2002,
33. Efron B and Tibshirani RJ An Introduction to the Bootstrap New York:
Chapman & Hall 1993,
34. Wyrwich KW, Metz SM, Babu AN, Kroenke K, Tierney WM and Wo-
linsky FD The reliability of retrospective change assessments
Quality of Life Research 2002, 11(7):636
35. Jacobson NS and Truax P Clinical Significance: A Statistical Ap-
proach to defining Meaningful Change in Psychotherapy
Research Journal of Consulting and Clinical Psychology 1991, 59(1):12-
19
36. Fergason RJ, Robinson AB and Spaine M Use of the Reliable
Change Index to evaluate clinical significance in SF-36
outcomes Quality of Life Research 2002, 11:509-516
37. Wyrwich KW, Nienaber NA, Tierney WM and Wolinsky FD Linking
Clinical Relevance and Statistical Significance in Evaluating
Intra-Individual Changes in Health-Related Quality of Life
Medical Care 1999, 37(5):469-478
38. Wyrwich KW, Tierney WM and Wolinsky FD Using the standard
error of measurement to identify important changes on the
Asthma Quality of Life Questionnaire Quality of Life Research
2002, 11:1-7
39. Drummond MF Introducing economic and quality of life meas-
ures into clinical studies Ann Med 2001, 33:344-349
40. Walters SJ, Campbell MJ and Paisley S Methods for determining
sample sizes for studies involving quality of life measures: a
tutorial Health Services & Outcomes Research Methodology 2001, 2:83-
99