Organizing transportation on a double track-line under conditions of major overhaul on one track
Bạn đang xem bản rút gọn của tài liệu. Xem và tải ngay bản đầy đủ của tài liệu tại đây (199.76 KB, 9 trang )
Yugoslav Journal of Operations Research
16 (2006), Number 1, 97-105
ORGANIZING TRANSPORTATION ON A DOUBLE-TRACK
LINE UNDER CONDITIONS OF MAJOR OVERHAUL
ON ONE TRACK
Branislav BOŠKOVIĆ 1, Miloš IVIĆ 1, Aleksandar MARKOVIĆ 2
1
Faculty of Transport and Traffic Engineering
2
Faculty of Organizational Sciences
University of Belgrade, Belgrade, Serbia & Montenegro
Received: March 2005 / Accepted: June 2005
Abstract: The problem of traffic organization on a railway line during the execution of
civil works on super and sub-structures maintenance under the present conditions is
becoming more and more difficult to solve, above all, due to the increased traffic
intensity. In order to make decisions on indispensable measures to be taken under such
circumstances, one needs information on train compositions and their delays, line
capacity, facilities, etc. In order to obtain such information, it is necessary to use a
computer simulation which significantly enhances the range of the problem to be solved
and offers answers to the questions that cannot be solved by analytical models alone. The
paper presents a simulation model of the trains’ movement on a double-track line when
one track is closed to traffic due to the work executions. Such model will provide a better
quality of decision-making in the process of traffic organization under given
circumstances.
Keywords: Double-track line, track overhaul, traffic simulation.
1. INTRODUCTION
The problem of traffic organization on a railway line during the execution of
maintenance work is as old as the railway lines themselves. As the time elapses, this
problem is becoming more and more complex and important, primarily due to a constant
growth of passenger and freight traffic intensity. Therefore, under the present conditions,
it represents an extremely complex problem for the railways. This particularly applies to
the underdeveloped railway lines network, where the possibility of diverging traffic to
parallel lines is very limited [5].
98
B. Bošković, M. Ivić, M. Marković / Organizing Transportation on a Double-Track Line
It should be stressed that the afore said particularly applies to the cases where
works are of such nature that requires a number of days of track traffic closure. This
group of works comprises all major works on track sub- and super-structures. In cases
when it is possible to work during the intervals of partial track closure over the day, the
problem in question becomes significantly different.
Problems of such nature significantly vary in relation to whether a single or
double-track line is in question. When one track of a double-track line is closed, the basic
question which directly affects the manner in which the problem is to be solved is
whether it is possible to carry all the traffic on a single track, and if so, what the
consequences can be. In order to reach such a decision, it is necessary to determine the
number of trains valid for the line capacity assessment, maximum line capacity that can
be achieved under the given conditions, magnitude of disturbances and/or delays taking
place in train movements, etc. On that basis we determine the following: the number of
trains that can be handled on one track, the number of trains that must be diverted to
other lines (if possible), the number of trains that must be canceled, whether some trains
should be coupled together and, if so, which ones, whether some other measures should
be taken instead, etc.
Since in the real system some random magnitudes also occur, such as passenger
train delays, time stretch of freight train arrivals on considered lines, etc. The solution of
such problems cannot be obtained in advance by calculations. One of the possible
imposed approaches in solving the mentioned problem is to design a simulation model
[1]. If we carry out planned experiments on a model and analyzing the results, we can
derive the values of indicators necessary for decision-making.
2. DESCRIPTION OF THE REAL SYSTEM
Figure 1 shows a general layout of a double-track where civil works are being
carried out, requiring a full traffic closure of one track for traffic. The work can be
carried out simultaneously on one or more open-line sections between stations in
succession. Should the work be carried out simultaneously on a number of consecutive
open-line sections between stations and station tracks? The problem again boils down to
the same thing, i.e. a single open-line section between stations which becomes much
longer.
In the real system, this means a lower line capacity, longer delays and higher
disturbance for the same traffic volume. Stations “K” and “M” represent transit points
from train movement on a double-track to a single-track line. These points (stations)
represent an input and output, respectively, of the considered system [3], [4].
The complexity of the system is caused by the infrastructure system, on the one
hand, and rules and regulations governing traffic/operations, on the other. The
infrastructure system comprises a subsystem of stations (with tracks, signaling
equipment, traction facilities, etc.) and the subsystem of open-line sections between
stations with tracks and the applied systems of train sequencing (inter-station
dependencies, automatic block system - ABS, etc.).
B. Bošković, M. Ivić, M. Marković / Organizing Transportation on a Double-Track Line
99
The traffic regulated control including grows significantly complicated by
increasing the number of train categories and by transition to a two-way traffic on a
single track.
STATION "K"
STATION "M"
Figure 1: Track layout of stations and open-line section between stations
in the case of work executions on one track
Everything said so far confirms the (expressed, statement we talk about a
complex problem and that it cannot be resolved successfully by merely applying
analytical methods. In order to achieve this, the application of modern methods is
required [7],[8]. This paper uses the method of computer simulation, because:
the experimenting on a model is more economic and ,in this specific case, the only
possible,
by computer simulation the impact of all factors on final results can be seen, which
greatly facilitates for decision-makers to decide on the final solution.
3. DESIGN OF THE SIMULATION MODEL
In order to start designing a simulation model and modelling the train arrival
times in transit points from a double-track to a single-track traffic as well, the following
questions should be answered:
Do trains arrive by timetable, or with delay?
How many trains (passengers and freight) should be included in the simulation?
Are train delays subject to law of distribution?
Are there any differences in train delays by direction and by category?
What is the ruling number of trains and how one should arrive at it?
Is the distribution of the number of freight trains during the day a stationary
process?
Should the simulation of freight train arrivals be made separately by direction?
Which type of priority conditions should be adopted?
In designing the simulation model, the following assumptions were made in
order to simplify the considered real system (the real system we are considering).
Firstly, the problem is brought down to a single open-line section between
stations with the works carried out. The trains are therefore observed only from the
100 B. Bošković, M. Ivić, M. Marković / Organizing Transportation on a Double-Track Line
moment of arrival to transit points (“K” and “M”) and from the double-track to the
single-track line stretch.
Secondly, the criteria of traffic organization and control are set out so as to
ensure the maximum line capacity, without disturbing the traffic safety:
The train speed is limited and adjusted to conditions of the work executions on
the adjacent track and is the same for both passenger and freight trains.
Train sequencing intervals and station intervals depend on the station and line
fitness.
Trains are forwarded in bunches for the purpose of increasing line capacity.
Passenger trains in departing bunch have priority over the freight ones.
In the bunch consisting of only passenger or only freight trains, the forwarding
is made on the principle “first come - first served”, i.e. leave the station.
3.1. Simulation of passenger train arrivals
If passenger trains on the considered line run exactly according to the timetable
with minimum deviations, then the times of their arrivals onto the open-line section
between stations where works are carried out can be taken to be according to the
timetable. The passenger train arrival time for a given station and direction, respectively,
is solved in the model by adding the simulated delay time to the normal arrival time. The
train delay time on an intersection point of the line also depends on the station position
(location) on that line. Therefore it is necessary to record the passenger train delays by
direction for the considered line section where works are carried out in order to find the
magnitude of delays (with frequencies), i.e., the possible regularity (distribution) of
delays. Since the works are not carried out in winter, but during the construction season,
the data should be taken from the same period.
3.2. Simulation of freight train arrivals
The number of freight trains per day can be observed in broad intervals of their
timetable implementation rate. Well-developed railway administrations are characterized by
high implementation rate while a low implementation rate appears in some less developed
railway administrations. A lower implementation rate of freight trains sometimes results
from the fact that some trains operate periodically and that such trains are canceled almost
daily by a significant percentage in relation to the number provided in the timetable.
It is therefore necessary first to determine within what range variation of freight
trains is possible. The mentioned interval should be determined according to the
maximum number of freight trains during the previous year per month.
In addition to the number of trains coming up over the day during the work
executions, the times of their appearance in transit stations for single-track traffic should
also be established. In relation to our station’s position on the line and the composition of
trains thereon, the actual number of trains over the day by hour does not usually represent
a stationary process. There are generally bunches of passenger and freight trains over the
day. It is particularly noticeable on approaches to major towns where morning and
afternoon peaks of passenger trains and night peak of freight trains can be noted.
B. Bošković, M. Ivić, M. Marković / Organizing Transportation on a Double-Track Line 101
One of the methods of simulation of appearance of freight trains is through empirical
probabilities of appearance of trains over the day. Hence, this sample helps us establish
relative frequencies and probabilities distribution function.
4. MODEL TESTING
The simulation model set was accomplished in GPSS/H simulation language
[2], [6]. The model’s validity was tested on a concrete example, namely for the open line
section between Martinci and Kukujevci on a double-track line Beograd - Sid.
4.1. Input data
The question of the ruling number of passenger trains taken for the purpose of
simulation was resolved by taking the number of passenger trains according to the
timetable for the given period of the work executions, since passenger trains provided in
the timetable certainly operate.
A simulated time of passenger train delays to the considered stations is added to
the regular times of their arrivals. Based on data available on train arrival delays for the
stations in question, according to a 10-day sample, tests of the train delay distribution
were made. According to the statistical data processing and to testing of hypotheses, the
train delays occur by a shifted exponential distribution. The obtained distribution
functions have the following shape and parameters by direction [9]:
Direction Beograd - Sid: F ( x ) = 1 − e −0.103⋅( x + 4)
Direction Sid - Beograd: F ( x ) = 1 − e −0.091⋅( x + 5)
The number of freight trains in the model was changed within the limits of
actual numbers for the considered period i.e. within the range from 20 up to 45 trains per
direction. The time of entry of freight trains into model was taken according to the
established empirical distribution of probabilities of train arrivals over the day for the
considered stations.
In the actual case, the line was equipped with ABS, with the 4 minute
sequencing interval. Due to speed restriction, the sequencing interval is the same for all
sequencing cases (passenger after passenger, passenger after freight, etc.). Should during
the generation of train arrivals an interval between two consecutive trains be lower than 4
minutes, the other train arrival time is moved to 4 minutes after the preceding one. The
station crossing interval is 1 minute.
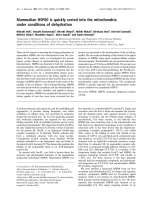
4.2. Analysis of the simulation results
From the large number of simulation results, in this paper we have chosen to
present the results of the cases with the equal number of freight trains by direction.
Figure 2 presents an average delay per train (separately for passenger and for freight and
altogether). It can be noted that the average delay on account of the work executions in
transit stations increases by balancing the numbers of freight trains. Since the moment of
balancing the number of freight and passenger trains, the freight train average delay
102 B. Bošković, M. Ivić, M. Marković / Organizing Transportation on a Double-Track Line
increases steeply, resulting from the priority of passenger trains over the freight ones in a
bunch, and in the station, respectively.
8.00
Passenger
Average delay [min/train]
7.00
Freight
Passenger + Freight
6.00
5.00
4.00
3.00
2.00
Np=61
40
50
60
70
80
90
100
Number of trains
Figure 2: Average train delays on the open-line section between Martinci and Kukujevci
The average delay of passenger trains per one delayed train is almost constant
(in range from 8.5 to 10.5 minutes), regardless of the number of freight trains, resulting
from an increased number of delayed trains (Table_1) and their priorities in relation to
freight trains, whereas with freight trains it increases from 6.8 to 12.8 min/ delayed train
(Figure 3).
14.00
Passenger
Freight
Passenger + Freight
13.00
Delay [min/delayed train]
12.00
11.00
10.00
9.00
8.00
7.00
6.00
5.00
Np=61+
40
50
60
70
80
90
100
Number of trains
Figure 3: Average delay per delayed train on the open-line section between
Martinci and Kukujevci
B. Bošković, M. Ivić, M. Marković / Organizing Transportation on a Double-Track Line 103
With an increased number of freight trains, the percentage of delayed trains
grows from 36% up to 62% (Table 1). These data are presented in diagram in Figure 4.
Table 1: Data on delayed trains (Sequencing interval, Is = 4 min)
Number of trains
Passeng.
Freight
(P)
(F)
Number of delayed trains
P
%
F
%
∑
%
61
40
20
33
16
40
36
36
61
50
23
38
16
32
39
35
61
60
28
46
26
43
54
45
61
70
34
56
36
51
70
53
61
80
34
56
45
56
79
56
61
90
39
64
53
59
89
59
61
100
39
64
61
61
100
62
In order to make a decision in such situations one should know the number of
train bunches per day, as well as the number of trains in a bunch. Table_2 indicates that
the number of bunches grows as the number of freight trains increases, where the
percentage of the number of trains which passed the section in question was increasing
significantly (the last column in Table 2).
The simulation results are in agreement with the recorded delays during the
work executions on the considered line section, when the average delay was 5 minutes
per train, the mean daily number of freight trains being 63.
Table 2: Data on train bunches (Sequencing interval, Is = 4 min)
Number of
bunchs
Number of trains
Number of trains
in a bunch
Pass.
Freig.
Σ
both direc.
average num.
%
61
40
101
19
2.0
37.6
61
50
111
23
2.0
41.4
61
60
121
25
2.36
48.8
61
70
131
27
2.48
51.1
61
80
141
29
2.65
54.6
61
90
151
36
3.03
72.2
61
100
161
36
3.13
74
Table 3 shows the data obtained by simulation in the case of decreased
sequencing interval (Is) down to 3 min, in which case it is a “sequencing at yellow light”.
Obviously, there would be no reduction in delays in a significant amount, both in the
numbers of delayed trains and in the average delay per delayed train.
104 B. Bošković, M. Ivić, M. Marković / Organizing Transportation on a Double-Track Line
Table 3: Data on delayed trains(Sequencing interval, Is = 3 min)
Number of
trains
Passeng.
Freight
(P)
(F)
Number of delayed trains
P
%
F
%
∑
%
61
40
20
33
15
38
35
35
61
50
21
34
16
32
37
33
61
60
24
39
28
47
52
43
61
70
34
56
33
47
67
51
61
80
35
57
42
53
77
55
61
90
33
54
50
56
83
55
61
100
32
52
59
59
91
57
100
Number of delayed trains
90
80
70
60
50
40
30
"Pass. + Freight"
20
"Freight"
10
0
Np=61+40
"Passenger"
50
60
70
80
Number of trains
90
100
Figure 4: Number of trains delayed in relation to the number of freight trains
5. CONCLUSION
The paper presents a simulation model of train movements on a double-track
line section under the conditions of one track traffic closure due to the work execution.
The purpose of the simulation model is to determine the capacity of the considered line
section and the key indicators of train operation disturbances in such situations. This is
the way to obtain the necessary elements for decision making, first of all the number of
B. Bošković, M. Ivić, M. Marković / Organizing Transportation on a Double-Track Line 105
trains that can be forwarded during the course of the work execution with the
corresponding (simulated) delay.
Similarly, the simulation analysis contributes to obtaining data on the number of
trains that must be canceled or diverted to other lines, or coupled together and if so,
which ones, to controlling the traffic in order to diminish the disturbances, along with
the highest possible line capacity, etc.
In order to obtain the most reliable simulation results, useful for decision-making,
the analysis indicates that the model should also include the following:
a separate simulation of passenger and freight train times by direction,
the number of passenger trains taken from the timetable, at the time envisaged
for the work execution,
the arrival time of passenger trains taken from the timetable, and then simulated
delay time added,
the number of freight trains simulated within the limits of the number of trains
which appeared in the ruling sample,
the times of freight train arrivals simulated on the basis of recorded relative
frequencies of the number of trains by hour over the day.
REFERENCES
[1]
[2]
[3]
[4]
[5]
[6]
[7]
[8]
[9]
Banks, J., and Carson, J., Discrete Event Simulation, Prentice Hall, 1984.
Banks, J., Carson, J., and Ngo Sy, J., Getting Started with GPSS/H, Wolverine Software
Corporation, 1989.
Čicak, M., Veskovic, S., and Boskovic, B., "Traffic organization during the work executions
on upgrading of the line Belgrade - Zagreb for speeds up to 160 km/h", Railways, 43(1) (1987)
39-44.
Čičak, M., Methods and Models for Determination of Railway Lines Capacities, Želnid,
Beograd, 1996. (in Serbian)
Čičak, M., and Vesković, S., Organisation of Railway Transportation II, Faculty of Transport
and Traffic Engineering, Želnid, Beograd, 2005. (in Serbian)
Henriksen, O.J., and Crain, R., GPSS/H Reference Manual, Wolverine Software Corporation,
1989.
Radenković, B., Stanojević, M., and Marković, A., Computer Simulation, Faculty of
Organizational Sciences and Faculty of Transport and Traffic Engineering, Belgrade, 2004. (in
Serbian)
Schriber, T., Simulation Using GPSS, John Wiley and Sons, 1974.
Vukadinovic, S., Elements of the Theory of Probability and Mathematical Statistics, Privredni
pregled, Belgrade, 1990. (in Serbian)