Shear resistance of ultra high performance concrete reinforced with hybrid steel fiber subjected to impact loading
Bạn đang xem bản rút gọn của tài liệu. Xem và tải ngay bản đầy đủ của tài liệu tại đây (1.57 MB, 9 trang )
Journal of Science and Technology in Civil Engineering NUCE 2019. 13 (1): 12–20
SHEAR RESISTANCE OF ULTRA-HIGH-PERFORMANCE
CONCRETE REINFORCED WITH HYBRID STEEL FIBER
SUBJECTED TO IMPACT LOADING
Pham Thai Hoana , Ngo Tri Thuongb,∗
a
Faculty of Building and Industrial Construction, National University of Civil Engineering,
55 Giai Phong road, Hai Ba Trung district, Hanoi, Vietnam
b
Faculty of Civil Engineering, Thuy Loi University, 175 Tay Son street, Dong Da district, Hanoi, Vietnam
Article history:
Received 23 August 2018, Revised 29 September 2018, Accepted 18 December 2018
Abstract
This study investigated the synergy in shear response of ultra-high-performance fiber-reinforced concrete (UHPFRCs) containing different contents of long and short smooth steel fiber reinforcements at high strain rates.
Shear resistance of two ultra-high-performance mono-fiber-reinforced concrete (UHP-MFRCs): L15S00 (containing 1.5 vol.-% long and 0.0 vol.-% short fiber) or L00S15, and one ultra-high-performance hybrid-fiberreinforced concrete (UHP-HFRCs): L10S05 (containing 1.0 vol.-% long and 0.5 vol.-% short fiber) at high
strain rates of up to 272 s−1 was investigated using a new shear test setup by an improved strain energy frame
impact machine (I-SEFIM). The L10S05 generated high synergy in shear strength, shear peak toughness at
static rate and high synergy in shear strain, shear peak toughness at high strain rates. Moreover, all the investigated UHPFRCs were sensitive to the applied strain rates, especially in term of shear strength.
Keywords: UHPFRCs; shear resistance; synergy effect; strain-rate dependent; impact.
/>
c 2019 National University of Civil Engineering
1. Introduction
Ultra-high-performance fiber-reinforced concrete (UHPFRC) is a potential material for wide use
in protective structures for aeronautics, nuclear industry, and military buildings as a safeguard against
impact or blast loading, owing to its superior mechanical characteristics such as very high compressive
strength [1], high tensile strength, ductility [2], and energy absorption capacity [3]. Nevertheless, the
application of UHPFRCs to civil infrastructures is still very limited because of their relatively high
fiber contents and cost [4, 5]. It is necessary to reduce the fiber contents as well as the cost of the
UHPFRCs, without sacrificing their high mechanical resistance and work ability.
Several methods have been carried out to reduce the fiber content and cost of UHPFRCs, which
may be listed as follows: (1) increasing mechanical interfacial bond strength between fiber and matrix
by utilizing deformed steel fiber geometries [6]; (2) generating synergistic responses by blending of
long and short fibers reinforcements [5]; and (3) enhancing the physical and chemical bond strength
between the fiber and matrix by maximizing packing density of the matrix [7]. Among the various
methods, blending long and short fibers has been proven as one of the most effective methods, owing
to a combination of various features from those different fiber reinforcements [8, 9]. For example,
∗
Corresponding author. E-mail address: (Thuong, N. T.)
12
Hoan, P. T., Thuong, N. T. / Journal of Science and Technology in Civil Engineering
the shorter reinforcements can effectively restrict the development of micro-cracks while the longer
reinforcements can bridge macro-cracks [10].
Even though the mechanical properties of ultra-high-performance hybrid-fiber-reinforced concrete (UHP-HFRC) have been intensively investigated by many researchers, researchers have mostly
focused on the compressive [9–12], tensile [5, 13, 14], and flexural [15, 16] properties of UHPHFRCs rather than their shear resistance [16]. Moreover, most previous studies have focused on the
quasi-static properties [9, 12, 13] rather than the impact behavior [5, 10, 11, 14, 16].
Wu et al. [10] used the split Hopkinson press bar (SHPB) testing to investigate the static and
dynamic compressive strength of UHP-HFRCs and found that the UHP-HFRC containing 1.5% fiber
volume content (1.5 vol.-%) long and 0.5 vol.-% short steel fiber reinforcements exhibited higher
compressive strength than those containing only 2.0 vol.-% of long or short fibers, at both static
and high strain rates. Millard et al. [16] used drop-hammer techniques to investigate the dynamic
increase factor (DIF) under both flexural and shear loading of UHP-HFRCs. The results showed that
the beam containing 6 vol.-% long and short steel fibers produced the lowest dynamic increase factor
(DIF) under flexural loading, whereas there is no significant strain rate enhancement in the case of
shear loading. Tran et al. [5] investigated the synergistic response of blending fibers in UHPC under
high rate tensile load using a strain energy frame impact machine (SEFIM). They have reported that
the blending of long and shorter steel fibers in UHPC generated notable synergistic effects on the
tensile response of UHP-HFRCs, especially at high strain rates. Until now, there is still little available
information about the effect of fiber hybridization on the shear resistance of UHPFRCs, especially at
high strain rates.
This study aims to understand the influence of synergistic response and strain rates on the shear
resistance of UHPFRCs using the new shear test method, recently developed by Ngo et al. [17], that
is capable of measuring the shear-related hardening response of UHPFRCs, accompanied by multiple
microcracks. The first one of the two main objectives in this study is to examine the synergistic
responses on the shear resistance of UHP-HFRCs and the second objective is to investigate the strain
rate effect on the shear resistance of UHPFRCs.
2. Experimental program
Three series of prism shear specimen named as L15S00 (containing 1.5 vol.-% long and 0.0
vol.-% short fiber), L00S15 (containing 0.0 vol.-% long and 1.5 vol.-% short fiber), and L10S05
(containing 1.0 vol.-% long and 0.5 vol.-% short fiber) with the same UHPC matrix were prepared
and tested. Each specimen series consists of 6 specimens, leading to the total of 18 prism specimens
with the same size of 50 × 50 × 210 mm3 .
2.1. Material and specimen preparation
The composition by weight ratio of Ultra-high-performance (UHPC) matrix is listed in Table 1
while the properties of long and short smooth steel fibers are listed in Table 2. The silica sand and the
silica fume are first to dry mixed for 5 mins. The cement and the silica powder are then added and
mixed in approximately more 5 mins. The water and superplasticizer are slowly added with 2 mins
interval and mixed continuously until the mixture showed adequate workability. Finally, the fibers are
carefully poured by hand into the mixture while the mixer machine kept rotating for 2 mins. Detail of
the mixing procedure can be found in the previous work [17].
The UHPFRC mixture is cast into plastic molds by a scoop without vibration before storing in the
laboratory temperature for 48 h. The specimens are demoded and cured in the hot water tank at 90
13
Hoan, P. T., Thuong, N. T. / Journal of Science and Technology in Civil Engineering
Table 1. The composition of UHPC matrix by weight ratio
Cement (Type I)
Silica fume
Silica sand
Silica powder
Super-plasticizer
Water
1
0.25
1.10
0.30
0.067
0.2
Table 2. Properties of smooth steel fibers
Fiber type
Diameter,
d f (mm)
Length
l f (mm)
Density,
ρ (g/cc)
Tensile strength,
µu (MPa)
Elasticmodulus,
E (GPa)
Short smooth steel fiber
Long smooth steel fiber
0.2
0.2
13
19
7.90
7.90
2788
2580
200
200
± 2◦ C in 72 h. All specimens were tested at the ages of 28 days. The compressive strength of UHPC
matrix was 189 MPa according to [18].
2 shows
shear
machine
at high
strain
rates.
A shear
setup
Fig.Fig.
2 shows
thethe
shear
testtest
machine
at high
strain
rates.
A shear
testtest
setup
2.2.
Test
and
procedure
with
the
same
specimen
boundary
conditions
as the
static
shear
with
thesetup
same
specimen
sizesize
andand
boundary
conditions
as the
static
shear
testtest
waswas
employed
in
improved
strain
energy
frame
impact
machine
employed
ininvestigate
an an
improved
strain
energy
frame
machine
to to
In
order to
the synergistic
responses
and
theimpact
strain
rate
effect
on(I-SEFIM)
the(I-SEFIM)
shear resistance
of
UHPFRCs,
shear
tests
were
conducted
at both
staticat
andhigh
strain
rates.
Static
shear
tests
investigate
the
shear
resistance
of
UHPFRCs
athigh
high
strain
rates.
detail
of
investigate
the
shear
resistance
of UHPFRCs
strain
rates.
TheThe
detail
of were
carried out on three specimens of each specimen series, which were denoted by the “-S” notation folshear
impact
system
could
found
elsewhere
[19].
shear
stress
shear
impact
system
could
be be
found
elsewhere
[19].
TheThe
shear
stress
waswas
lowing the name of each series, whereas the dynamic shear tests were carried out on three remaining
obtained
from
dynamic
strain
attached
on
of
the
obtained
twotwo
dynamic
gauges
attached
on
the the
surfaces
theseries.
specimens
offrom
each
series,
which
were strain
denoted
by gauges
the “-H”
notation
following
thesurfaces
name ofofeach
Fig.
1 shows
thewhile
static
shear
test
system.
The
shear
test
setup,was
recently
proposed
byfrom
Ngo
et al.
transmitter
while
the
shear
strain
of
the
specimen
was
measured
transmitter
bar,bar,
the
shear
strain
of the
specimen
measured
from
the the
[17], was employed in the universal test machine (UTM) to implement the static shear test. Details of
relative
displacement
marked
points
a fixed
a moved
relative
displacement
of of
marked
points
on on
a fixed
gripgrip
andand
a moved
gripgrip
by by
a a
the shear test setup could be found in [17]. The speed of machine displacement was maintained as 1
high-speed
camera
system,
as applied
shown
in Fig.
2. The
speed
of cell
applied
wasthe
high-speed
camera
system,
asThe
shown
in load
Fig.
2. measured
The
speed
applied
loadload
was
mm/min
during
static
shear
testing.
was
by aofload
installed
inside
controlled
by
capacity
of coupler
and
types
of energy
frame:
the
coupler
with
UTM,
while the
was
by
linear
displacement
(LDVTs)
controlled
by displacement
thethe
capacity
of recorded
coupler
andtwo
types
ofvariable
energy
frame:
thetransducers
coupler
with
attached
to
the
bottom
surface
of
the
specimen
by
an
aluminum
frame,
as
can
be
seen
in
Fig.
1.
capacity
high
strength
steel
energy
frame
were
used
in this
study.
800800
kNkN
capacity
andand
high
strength
steel
energy
frame
were
used
in this
study.
Figure
1. Static
Static
shear
testtest
setup
Fig.1.
shear
Fig.1.
Static
shear
test
2. Impact
shear
test
setup
Fig.Fig.
2.Figure
Impact
shear
testtest
setup
2. Impact
shear
setup
setup
setup
Fig. 2 shows the shear test machine at high strain rates. A shear test setup with the same specimen
size
andResults
boundary conditions as the static shear test was employed in an improved strain energy frame
3. Results
3.
impact machine (I-SEFIM) to investigate the shear resistance of UHPFRCs at high strain rates. The
The
shear
stress-versus-strain
ofelsewhere
UHPFRCs
the
different
strain
rates
is two
The
shear
stress-versus-strain
of
UHPFRCs
atshear
the
different
strain
rates
is
detail of
shear
impact
system
could be found
[19].atThe
stress
was
obtained
from
shown
in Fig.
3, while
their
shear
parameters
listed
in Table
3. The
equations
shown
in Fig.
3, while
their
shear
parameters
listed
in Table
3. The
equations
14 areare
to calculate
thethe
shear
strength,
shear
strain
capacity,
strain
rates,
andand
shear
peak
to calculate
shear
strength,
shear
strain
capacity,
strain
rates,
shear
peak
toughnesscan
be be
referred
in [19].
Generally,
thethe
shear
resistance
of UHPFRCs
toughnesscan
referred
in [19].
Generally,
shear
resistance
of UHPFRCs
increased
as as
thethe
applied
strain
rates
increased,
although
the the
shear
parameters
increased
applied
strain
rates
increased,
although
shear
parameters
Hoan, P. T., Thuong, N. T. / Journal of Science and Technology in Civil Engineering
dynamic strain gauges attached on the surfaces of the transmitter bar, while the shear strain of the
specimen was measured from the relative displacement of marked points on a fixed grip and a moved
grip by a high-speed camera system, as shown in Fig. 2. The speed of applied load was controlled by
the capacity of coupler and types of energy frame: the coupler with 800 kN capacity and high strength
steel energy frame were used in this study.
3. Results
The shear stress-versus-strain of UHPFRCs at the different strain rates is shown in Fig. 3, while
their shear parameters are listed in Table 3. The equations to calculate the shear strength, shear strain
capacity, strain rates, and shear peak toughness can be referred in [19]. Generally, the shear resistance
of UHPFRCs increased as the applied strain rates increased, although the shear parameters were
strongly dependent on the combination of fiber reinforcements. The L10S05 exhibited the highest
shear strength (τmax ) and shear peak toughness (T sp ) at static rate. The average τmax of L00S15,
L10S05, and L15S00 are 18.2, 24.4, and 20.8 MPa, while T sp of those are 0.51, 0.89, and 0.76 MPa,
respectively. Their γmax are 0.045, 0.050, and 0.054 as listed in Table 3. However, the shear strength
(31.9 MPa) of L15S00 is significantly higher than those of the L10S05 (30.1 MPa) and the L00S15
(26.80 MPa) at high strain rates. In addition, the L10S05 produced the highest value in terms of the
shear strain and the shear peak toughness. Their values of γmax and T sp are 0.088 and 1.40 MPa for
the L00S15, 0.107 and 1.91 MPa for the L10S05, and 0.06 and 1.12 MPa for the L15S00.
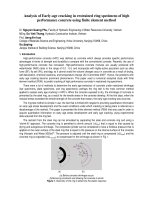
Failure of the specimens is shown in Fig. 4. All specimens failed with two major shear cracks,
accompanied by the formation of multiple-micro cracks. In addition, the number of cracks at high
strain rates (Fig. 4(a)) was significantly higher than at static rates (Fig. 4(b)).
4. Discussions
4.1. Synergistic effect of blending long and short fiber on shear resistance of UHP-HFRCs
The synergy evaluation of UHP-HFRCs using Eq. (1) is shown in Fig. 5. The Eq. (1) defines
synergy as the amount by which the performance of a hybrid system exceeds that of each monocomponent system as the same fiber volume content [5]:
S =
(V f )
(V f )
(V f )
)
− max(Rmono,a
, Rmono,b
Rhybrid,a+b
(V f )
(V f )
max(Rmono,a
, Rmono,b
)
(1)
(V f )
(V f )
(V f )
where Rhybrid,a+b
is the shear resistance of UHP-HFRC reinforced with fiber a and b, Rmono,a
, Rmono,b
are the shear resistance of ultra-high-performance mono-fiber-reinforced concrete (UHP-MFRC) containing fiber a and b, respectively. Notably, the UHP-HFRCs and UHP-MFRCs have the same total
fiber volume content, V f . A positive value of “S” indicates that the hybrid system performs better
than the mono system or the sum of individual fibers.
As can be seen in Fig. 5, the UHP-HFRC containing 1.0 vol.-% long fiber and 0.5 vol.-% short
fiber (L10S05) exhibited the positive synergy values for the shear strength (τmax ), shear peak toughness (T sp ), but the negative synergy value for the shear strain capacity (γmax ), at static rate. Whereas
they produced the best synergy in the Tsp, at high strain rates. Specifically, the synergy values for
τmax , γmax and T sp of L05S10 were 0.175, −0.075, and 0.160 at the static rate, and −0.056, 0.218, and
0.367 at the high strain rates, respectively. The reason for the synergy effect of the UHPFRCs at static
15
the
L10S05
produced
the
highest
ininterms
ofofof
the
shear
strain
and
the
shear
L00S15,
0.107
andTheir
1.91
MPa
for
L10S05,
and
0.06
and
1.12
MPa
for
the
the
L10S05
produced
the
highest
value
in
terms
the
shear
strain
and
the
shear
the
L10S05
produced
the
highest
value
the
shear
strain
and
the
shear
peak
toughness.
values
ofof
the
and
T
0.088
and
1.40
MPa
for
the
max
peak
toughness.
values
of
value
and
Tterms
0.088
and
1.40
MPa
for
the
max
spsp
peak
toughness.
Their
values
max
and
Tare
are
and
1.40
MPa
for
the
spare
L00S15,
0.107Their
and
1.91
MPa
for
the
L10S05,
and0.088
0.06
and
1.12
MPa
for
the
peak
toughness.
Their
values
of
and
T
are
0.088
and
1.40
MPa
for
the
L15S00.
peak
toughness.
Their
values
of
and
T
are
0.088
and
1.40
MPa
for
the
max
sp
max
sp
peak
toughness.
Their
values
of
and
T
are
0.088
1.40
L00S15,
0.107
and
1.91
MPa
for
the
L10S05,
and
0.06
and
1.12
MPa
for
the
max
sp
L00S15,
0.107
andand
1.91
MPa
forfor
thethe
L10S05,
andand
0.06
andand
1.12
MPa
forfor
thethe
L00S15,
0.107
1.91
MPa
L10S05,
0.06
1.12
MPa
L15S00.
L00S15,
0.107
and
1.91
MPa
for
the
L10S05,
and
0.06
and
1.12
MPa
for
the
L00S15,
0.107
and
1.91
MPa
for
the
L10S05,
and
0.06
and
1.12
MPa
0.107
and
1.91
MPa
for
the
L10S05,
and
0.06
and
1.12
MPa
forfor
thethe
L15S00.
L15S00.
30L00S15,
30
30
L15S00.
L10S05-S
L00S15-S
30
30
30L15S00-S
SP1
SP1
SP1
L15S00.
L15S00.
L15S00.
Hoan, P. T., Thuong,
N. T. / Journal
of Science and Technology
in Civil Engineering
L10S05-S
4040 40
L00S15-H
stress (MPa)
Shear(MPa)
(MPa)
stressstress
ShearShear
Shear stress (MPa)
Shear stress (MPa)
(MPa)
stress
Shear
(MPa)
stress
(MPa)
stress
ShearShear
3040 40L00S15-H
L00S15-H
40L00S15-H
30
L00S15-H
L00S15-H
L00S15-H
3030 30
2030 30 30
20
2020 20
1020 20 20
10
1010 10
40
-1
SP1(263 s )
-1
SP1(263 s )
SP2(270 s -1 )
-1
-1
-1
SP2(270
s
-1 s ) s ))
SP1(263
SP1(263
SP1(263
SP3(262ss -1))
-1
-1
SP3(262
-1 s ) ss-1 ))
SP2(270
SP2(270
SP2(270 sSP1(263
)-1 -1 -1
SP1(263
SP1(263
s )s )s )
-1
-1
-1 s ) s )
SP3(262
SP3(262
SP3(262
sSP2(270
) -1 -1
SP2(270
SP2(270
s -1 ) s ) s )
-1
-1
SP3(262
(MPa)
(MPa)
stressstress
ShearShear
stress (MPa)
Shear(MPa)
stress
stress (MPa)
Shear Shear
(MPa)
stress
Shear
stress (MPa)
Shear
(MPa)
Shear stress
b) b)
L10S05-S
L10S05-S
b)
L10S05-S
b)L10S05-S
L10S05-S
b) (b)
L10S05-S
40
b)
L10S05-S
b)
L10S05-S
b)
L10S05-S
L10S05-H
4040 40
-1
SP3(262
SP3(262
s )s )s )
40
SP1(247 s -1 )
SP1(247 s -1 )
SP2(254 s -1 )
SP2(254
s-1-1 )
-1 -1
SP3(223
SP1(247
SP1(247
SP1(247
s -1s) s ) ) s -1)
SP3(223
s )
-1
-1 s ) s -1 )
SP2(254
SP2(254
SP2(254 s ) -1 -1
SP1(247
SP1(247
s ) -1s )
SP1(247
s -1 )-1
-1
SP3(223
SP3(223
SP3(223
s ) s -1) s )-1
SP2(254
SP2(254
SP2(254
s -1 )s ) s )
L10S05-H
30 40L10S05-H
L10S05-H
40L10S05-H
40 30
L10S05-H
L10S05-H
3030 30L10S05-H
20
30
30 3020
-1
c) c)
L15S00-S
L15S00-S
c)
L15S00-S
c) (c)
L15S00-S
c) L15S00-S
L15S00-S
40 c)
c)
L15S00-S
L15S00-S
c)
L15S00-S
L15S00-H
4040 40
-1 -1
SP3(223
SP3(223
SP3(223
s )s ) s )
L15S00-H
30 40L15S00-H
4040 L15S00-H
30 L15S00-H
(MPa)
(MPa)
stressstress
ShearShear
stress (MPa)
Shear
(MPa)(MPa)
stressstress
ShearShear
(MPa)
stress
Shear
(MPa)
stress
Shear
(MPa)
Shear stress
a) L00S15-S
a) L00S15-S
a)
L00S15-S
a)
L00S15-S
a) (a)
L00S15-S
L00S15-S
40 a)a)
a)
L00S15-S
L00S15-S
L00S15-S
L00S15-H
(MPa)
stress (MPa)
Shear
(MPa)
stressstress
ShearShear
Shear stress (MPa)
Shear stress (MPa)
(MPa)
stress
(MPa)
stress
Shear
(MPa)
stress
ShearShear
40
(MPa)
stress (MPa)
Shear
(MPa)
stressstress
ShearShear
Shear stress (MPa)
Shear stress (MPa)
(MPa)
stress
Shear
(MPa)
stress
Shear
Shear stress (MPa)
stress (MPa)
Shear
(MPa)
(MPa)
stressstress
ShearShear
Shear stress (MPa)
Shear stress (MPa)
stress
Shear
(MPa)(MPa)
stress
(MPa)
stress
ShearShear
L00S15-S
L15S00-S
25 30
2530
SP2 SP1 30
30 30
SP2 SP1 3025
SP2SP1
30
30
30
L10S05-S
25L00S15-S
25
25L15S00-S
SP3
L10S05-S
SP2
L10S05-S
SP2
SP2
SP3
SP3
L15S00-S
SP1SP1 30
SP1SP1
SP1
L00S15-S
L15S00-S
SP1
SP1
SP1
SP1
30 30L00S15-S
30
30
30
30 30
20
SP3 202530
25
SP3 2520
SP3
SP2SP2
2525 25
25
L10S05-S
25
25
SP2
L10S05-S
SP2
SP2
SP2
SP2
SP2
L00S15-S
L15S00-S
SP2
L00S15-S
L15S00-S
SP1SP1SP1
SP1
SP1
L00S15-S
L15S00-S
20
20L10S05-S
20
SP1SP1
SP1 SP1
SP3SP3SP3 25 25
SP3SP3
SP3
SP3
25 25 25
25
SP3
25
SP3
SP2SP2SP2 15 25
25
SP2
SP2
15
SP2SP2 2015
SP2 SP2
20
2020 20
2020 20
20
SP3SP3SP3
SP3
15
15
15
SP3
SP3SP3
SP3 SP3
20 20 20
20 20
2020 20
10
10152015
15 15
1515 15
15
1510
10
10
10
15 15 15
15 15 15
1515 15
5
5
5
10
10
10
10
10
10 10
10 10
5
5
5
10 10 10
10 10 10
1010 10
5
5
05 5 5
0
0
5
5
5
5
0
0.1
0.15
0.2
0 0
0.05
0.1
0.15
0.2
0 0
0.05
0.1
0.15
0.2
0 0.05
strain
up to peak
g
0
0.05
0.1stress, g 0.15
0.25 5 5 0Shear strain
0.05up to peak
0.1 stress, g0.15
0.2 5 5 5 0 Shear strain
0.05 up to peak
0.1 stress,0.15
0.2
5 5 5Shear
Shear
strain
up
to
peak
stress,
g
Shear
strain
up
to
peak
stress,
g
Shear
strain
up
to
peak
stress,
g
0
0
0
0
0
0
0
0
0
0.050.05 0.10.1 0.1 0.15
0.150.15 0.20.2 0.2 0 0 0 0.05
0.050.05 0.10.1 0.1 0.15
0.150.15 0.20.20.2 0 0 0 0.05
0.05
0.15
0.05 0.10.10.1 0.15
0.15 0.20.20.2
0 0 0 0.05
Shear
strain
up
touppeak
stress,
Shear
strain
to
stress,
Shear
strain
to peak
stress,
Shear
strain
tostress,
peak
stress,
Shear
strain
uppeak
to stress,
peak
stress,
Shear
strain
to peak
stress,
strain
up
to peak
g g g
strain
upup
to peak
g g g
strain
upup
to up
peak
stress,
g g g
0 0 0Shear
0 0 0 Shear
0 0 0 Shear
0.05 0.1 0.10.1 0.150.15
0.15 0.20.20.2 0 0 0 0.05
0.05 0.10.10.1 0.15
0 0 0 0.050.05
0.05
0.150.15 0.20.2 0.2 0 0 0 0.05
0.050.05 0.1
0.1 0.1 0.15
0.150.15 0.2
0.2 0.2
Shear
strain
up
tostress,
peak
stress,
Shear
strain
to stress,
peak
stress,
Shear
strain
up
to peak
stress,
Shear
strain
up
to
g g g
Shear
strain
upup
to up
peak
g g g
Shear
strain
upuptoto
peak
stress,
gg g
Shear
strain
uppeak
to peak
stress,
Shear
strain
to peak
stress,
Shear
strain
peak
stress,
L15S00-H
L15S00-H
3030 30L15S00-H
2030 30
30
20
SP1(224 s -1 )
SP1(224 s -1 )
-1
SP2(243 s )
-1
-1 -1
SP2(243
s )
SP1(224
SP1(224
SP1(224
s -1 ) s )s )
SP3(232 s -1 )
-1
-1 -1
SP3(232
s
)
-1
SP2(243
SP2(243
SP2(243
sSP1(224
) s -1)s )-1
SP1(224
SP1(224
s -1s) ) s )
-1
-1
-1 s )s )-1
SP3(232
SP3(232
SP3(232
sSP2(243
)-1 -1
SP2(243
SP2(243
s s) ) s )
-1
-1
SP3(232
SP3(232
SP3(232
s -1s) ) s )
2020 20
2020 20
1020 20
20
10
10
20
20 2010
1010 10
1010 10
010 10 10
0 10 10
10010 10
10
0 0.05
0.050.05 0.1 0.1 0.150.15
0.2 0.2
0
0.1 0.1 0.15 0.15 0.2 0.2
0 0 0 0.05 0.05 0.1 0.1 0.15 0.15 0.2 0.2 0 0 0
0
0.05
Shear
strain
up
to
peak
stress,
g
Shear
strain
up touppeak
stress,
g g
Shear
strain
up
to
peak
stress,
g
Shear strain up to peak stress, g
Shear
strain
to peak
stress,
Shear strain up to peak stress, g
0 0
0 0
0
0 0 00
0
0.05 0.10.10.1 0.15
0.15 0.20.20.2
0.05
0.15
0.050.05 0.10.1 0.1 0.15
0.150.15 0.20.2 0.2 0 0 0 0.05
0.050.05 0.10.1 0.1 0.15
0.150.15 0.20.20.2 0 0 0 0.05
0 0
0.05
Shear
strain
tostress,
peak
stress,
Shear
strain
to peak
stress,
Shear
strain
uppeak
to stress,
peak
stress,
Shear
strain
up
touppeak
stress,
Shear
strain
to
peak
stress,
Shear
strain
to
stress,
strain
up
to peak
g g g
strain
upup
to up
peak
stress,
g g g
strain
upup
to peak
g g g
0 0 Shear
0 0 Shear
0
0 0 00Shear
0
0.050.05 0.1
0.1 0.1 0.15
0.150.15 0.2
0.2 0.2
0.05
0.150.15 0.20.2 0.2 0 0 0 0.05
0 0.050.05
0.05 0.1 0.10.1 0.150.15
0.15 0.20.20.2 0 0 0 0.05
0.05 0.10.1 0.1 0.15
0
Shear
strain
uppeak
to peak
stress,
Shear
strain
uptoto
peak
stress,
Shear
strain
to
peak
stress,
Shear
strain
up
tostress,
peak
stress,
Shear
up
to peak
stress,
Shear
strain
to stress,
peak
stress,
Shear
strain
up
to
g g g
Shear
strain
up
peak
stress,
gg g
Shear
strain
upup
to up
peak
g g g
(d)
L00S15-H
(e)
L10S05-H
(f)strain
L15S00-H
a) L00S15-H
b) L10S05-H
c) c)
L15S00-H
a) L00S15-H
b) L10S05-H
L15S00-H
a)
L00S15-H
b)
L10S05-H
c)
L15S00-H
L00S15-H
L10S05-H
L15S00-H
a)a)L00S15-H
b)b)L10S05-H
c)c)L15S00-H
Fig.Fig.
3.
Shear
stress-versus-strain
of
UHPFRCs
at
different
strain
rates
3.
Shear
stress-versus-strain
of
UHPFRCs
at
different
strain
rates
a)
L00S15-H
b)
L10S05-H
c)
L15S00-H
a)
L00S15-H
b)
L10S05-H
c)
L15S00-H
a) L00S15-H
b) L10S05-H
c) L15S00-H
Fig.
3.
Shear
stress-versus-strain
of
UHPFRCs
at
different
strain
rates
Fig.3.3.Shear
Shear
stress-versus-strain
atdifferent
different
strainrates
rates
Figurestress-versus-strain
3. Shear stress-versus-strain
ofUHPFRCs
UHPFRCs atat
different
strainstrain
rates
Fig.
ofofUHPFRCs
Fig.
stress-versus-strain
strain
rates
Fig.
3.Shear
Shear
stress-versus-strain
ofUHPFRCs
UHPFRCs
atdifferent
different
strain
rates
Fig.
3.3.Shear
stress-versus-strain
ofofUHPFRCs
atatdifferent
strain
rates
rates
(b) High strain rates
a)Static
Static
rates
High
strain
rates
a)(a)Static
rates
b) b)
High
strain
rates
a)
Static
rates
b)
High
strain
rates
Staticrates
rates
Highstrain
strainrates
rates
a)a)Static
b)b)High
Figure
4. Typical
failure of
shear
UHPFRCs
specimens
Fig.
4.
Typical
failure
of
shear
UHPFRCs
specimens
a)
Static
rates
b)
High
strain
rates
Fig.
4.
Typical
failure
of
shear
UHPFRCs
specimens
a)
Static
rates
b)
High
strain
rates
a) Static
rates
b) High strain
rates
Fig.
4.
Typical
failure
of
shear
UHPFRCs
specimens
Fig.4.4.Typical
Typicalfailure
failureofofshear
shearUHPFRCs
UHPFRCsspecimens
specimens
Fig.
Failure
of
the
specimens
is shown
in
Fig.
4.
All
specimens
failed
withtwo
two
Fig.
4.
Typical
failure
ofnot
shear
UHPFRCs
specimens
Fig.
4.
Typical
failure
ofin
shear
UHPFRCs
specimens
ofFig.
the
specimens
is
shown
Fig.
4.
All
specimens
with
4.
Typical
failure
of
UHPFRCs
specimens
rates Failure
was Failure
different
from
the
high
strain
rates
is shear
really
clear
but
likely
relatedfailed
tofailed
the difference
in
of
the
specimens
is
shown
in
Fig.
4.
All
specimens
with
two
Failure
ofthe
thespecimens
specimens
isshown
shown
inFig.
Fig.
4.All
Allspecimens
specimens
failed
with
twoatIn
Failure
of
is
in
4.
failed
with
two
major
shear
cracks,
accompanied
by
the
formation
of
multiple-micro
cracks.
crack
propagate
mechanism
in
the
UHPFRC
specimens
under
different
applied
strain
rates.
Unlike
major shear
cracks,
accompanied
the in
formation
of
multiple-micro
cracks.
In
Failure
ofcracks,
specimens
shown
Fig.
specimens
failed
with
two
Failure
ofthe
the
specimens
isby
shown
information
Fig.
4.All
All
specimens
failed
with
two
major
shear
accompanied
by
the
of
multiple-micro
cracks.
In
Failure
of
the
specimens
isisshown
information
Fig.
4.4.the
All
specimens
with
two
major
shear
cracks,
accompanied
by
the
formation
of
multiple-micro
cracks.
In
the
static
rates,
the
micro
and
macro cracks
almost
happen
at
same
time
owingfailed
to thecracks.
extreme
load
major
shear
cracks,
accompanied
by
the
of
multiple-micro
In
major
shear
cracks,
accompanied
the
formation
multiple-micro
cracks.
InIn
major
shear
cracks,
accompanied
the
formation
of
multiple-micro
cracks.
speeds.
The
difference
inaccompanied
the
strain-rate sensitivity
characteristics
the
long and short
fiber
might
major
shear
cracks,
bybyby
the
formation
ofofof
multiple-micro
cracks.
In
6
6
be another reason for the different synergy effect between static and high applied strain rates. The
66
6
synergy response of the L10S05 under shear loading, in this study, was the same as those under direct
6
6 6
tensile loads at high strain rates. Tran et al. [5] investigated the synergy response of the L10S05, under
static and high strain rate direct tensile loads, reported that the L10S05 exhibited the negative effects
16
Hoan, P. T., Thuong, N. T. / Journal of Science and Technology in Civil Engineering
Table 3. Test results
Shear
strength,
τmax
Strain rate
Test series
L00S15-S
Specimen
SP1
SP2
SP3
Type
s−1
Static
0.000667
Average
SD
L10S05-S
SP1
SP2
SP3
Static
Average
SD
L15S00-S
SP1
SP2
SP3
Static
Average
SD
L00S15-H
SP1
SP2
SP3
High
rates
Average
SD
L10S05-H
SP1
SP2
SP3
High
rates
Average
SD
L15S00-H
SP1
SP2
SP3
High
rates
Average
SD
MPa
DIF
0.045
0.048
0.042
0.045
0.003
1.0
0.59
0.51
0.42
0.51
0.08
1.0
1.0
0.049
0.050
0.051
0.050
0.001
1.0
0.93
0.93
0.79
0.89
0.08
1.0
20.33
20.98
20.99
20.8
0.4
1.0
0.060
0.051
0.053
0.054
0.005
1.0
0.84
0.72
0.73
0.76
0.06
1.0
235
260
270
257
26.93
26.11
27.22
26.8
0.6
1.48
1.44
1.50
1.47
0.080
0.104
0.079
0.088
0.014
1.77
2.31
1.75
1.94
1.44
1.59
1.15
1.40
0.22
2.86
3.15
2.28
2.76
272
254
223
230
29.81
29.71
30.80
30.1
0.6
1.24
1.22
1.26
1.2
0.105
0.078
0.136
0.107
0.029
1.95
1.56
2.71
2.1
1.65
1.27
2.81
1.91
0.80
2.04
1.66
3.68
2.5
224
243
232
232
30.00
33.10
32.59
31.9
1.7
1.44
1.59
1.57
1.5
0.059
0.052
0.069
0.060
0.008
1.09
0.96
1.27
1.1
0.93
0.85
1.59
1.12
0.41
1.22
1.11
2.08
1.5
0.000667
0.000667
0.000667
0.000667
DIF
18.63
17.92
18.02
18.2
0.4
1.0
24.80
23.57
24.80
24.4
0.7
Shear peak
toughness,
T sp
DIF
0.000667
MPa
Shear strain
at peak
stress, γmax
in term of post-cracking strength (σ pc ), but highly effective in terms of tensile strain capacity (εc ) and
peak toughness (T p ).
17
Notably, the UHP-HFRCs and UHP-MFRCs have the same total fiber volume
content, Vf. A positive value of “S” indicates that the hybrid system performs
better than the mono
system
orT.the
sum
of individual
fibers.
Hoan, P. T.,
Thuong, N.
/ Journal
of Science
and Technology
in Civil Engineering
0.6
Static rate
High strain rates
Synergy coefficent
0.4
0.367
0.218
0.2
0.175
0.160
0
-0.056
-0.2
-0.075
Shear stress
Shear strain Peak toughness
Shear parameters
Figure 5. Synergistic response of UHP-HFRCs
Fig. 5. Synergistic response of UHP-HFRCs
4.2.
rate effect
on shear
of UHPFRCscontaining
AsHigh
canstrain
be seen
in Fig.
5, resistance
the UHP-HFRC
1.0 vol.-% long fiber
DIFs, ratio
between
dynamic and
static responses,
of the shear
parameters
(τmax , for
γmax ,the
and 0.5The
vol.-%
short
fiberthe
(L10S05)
exhibited
the positive
synergy
values
T sp ) of UHPFRCs at high strain rates (up to 272 s−1 ) are plotted in Fig. 6, including DIFs for shear
shear
strength
(maxshear
), shear
peak toughness
(Tshear
negative
synergy
value
sp), but
strength
(Fig. 6(a)),
strain capacity
(Fig. 6(b)), and
peak the
toughness
(Fig. 6(c)).
Generally,
the UHPFRCs were found to be sensitive to the applied strain rates. As the strain increased from the
for the
shear strain capacity (max), at static rate. Whereas they produced the best
static rate (0.000667 s−1 ) to the high strain rates (up to 272 s−1 ), the DIFs of τmax of the L00S15,
L10S05,
1.47,strain
1.20, and
1.50, Specifically,
while the DIFs ofthe
γmaxsynergy
were 1.94,values
2.10, andfor
1.10,
synergy
in and
theL15S00
Tsp, atwere
high
rates.
max,
respectively. Those DIFs of T sp , which is shown in Fig. 6(c) were 2.76, 2.50, and 1.50.
3 3 3
DIF of shear strength
DIF of shear strength
DIF of shear strength
1.51.5 1.5
L15S00
L15S00
L15S00
1.201.201.20
1 1 1
L00S15
L00S15
L00S15
L10S05
L10S05
L10S05
1.94
2 2 2 1.94 1.94
2.102.102.10
L15S00
L15S00 3 3
L15S00
0 0 0
L00S15
L10S05
L15S00
L00S15 L10S05
L10S05 L15S00
L15S00
L00S15
(a) Shear strength
strength
a)a)Shear
strength
a)Shear
Shear
strength
3
L15S00
L15S00
L15S00
2.762.762.76
2.502.502.50
2 2 2
1.501.501.50
1 1 1
0 0 0
L00S15
L10S05
L15S00
L00S15 L10S05
L10S05 L15S00
L15S00
L00S15
Types
of UHP-HFRCs
Types
of UHP-HFRCs
Types
of UHP-HFRCs
L00S15
L00S15
L00S15
L10S05
L10S05
L10S05
1.101.101.10
1 1 1
0.50.5 0.5
8
4 4 4
1.501.501.50
DIF of shear strain
DIF of shear strain
DIF of shear strain
1.471.471.47
L00S15
L00S15
L00S15
L10S05
L10S05
L10S05
DIF of shear peak toughness
DIF of shear peak toughness
DIF of shear peak toughness
2 2 2
Types
of UHP-HFRCs
Types
of UHP-HFRCs
Types
of
UHP-HFRCs
(b) Shear strain
strain
b)b)Shear
strain
b)Shear
Shear
strain
0 0 0
L00S15
L10S05
L15S00
L00S15L10S05
L10S05L15S00
L15S00
L00S15
Types
of UHP-HFRCs
Types
of UHP-HFRCs
Types
of
UHP-HFRCs
(c) Shear peak toughness
peak
toughness
c)c)Shear
peak
toughness
c)Shear
Shear
peak
toughness
Figure 6. Strain rate effect on shear resistance of UHPFRCs
Fig.
rate
effect
resistance
Fig.
6.6.Strain
rate
effect
ononshear
resistance
ofofUHPFRCs
Fig.
6.Strain
Strain
rate
effect
onshear
shear
resistance
ofUHPFRCs
UHPFRCs
The average DIF (1.50) of the L15S00 for τmax at high strain rate up to 272 s−1 was found to be
Fig.
the
experimental
shear
strength
(exp
)and
calculated
shear
Fig.
7 7plots
the
experimental
shear
strength
((exp
)exp
calculated
shear
Fig.
7plots
plots
the
experimental
shear
strength
)and
and
calculated
shear
significantly lower than those of tensile strength. The DIF of the tensile
strength (σ pc ) of UHPFRC
strength
(cal
)ofof
UHPFRCs
strain
rates.
the
cal
was
calculated
strength
(1.5
(cal
)cal
atathigh
strain
rates.
InInwhich,
cal
calculated
containing
vol.-%
steel fibers
was
reported
as
about
3.0
at
thethe
high
strain
rate
ofcalculated
21.4 s−1
strength
) UHPFRCs
ofshort
UHPFRCs
athigh
high
strain
rates.
Inwhich,
which,
the
was
was
cal
proposed
equation
and
Kim.
(2017)
[19],
(2):
bybyabyaproposed
equation
ofofNgo
and
Kim.
[19],
asasEq.
(2):
a proposed
equation
ofNgo
Ngo
and
Kim.
(2017)
[19],
asEq.
Eq.
(2):
18(2017)
111
DIF
DIF
==
=
DIF
max max max
)(0.582
0.07023
0.582
(()
)0.582
0.07023
0.07023
110
s s s 110
s/ s / s
/110
110
110
s/ s / s
/110
(2)(2)(2)
oefficient 0.07023 in Eq. (2) was kept for the L15S00 and justified to 0.06 fo
he L00S15 and 0.048 for the L10S05, respectively, while the exponent (0.582
P. T., Thuong, N. T. / Journal
of Science
Technology
in Civil
Engineering of all investigate
as maintained. AsHoan,
demonstrated
in Fig.
7,andthe
shear
strength
[5]. could
The lowerbe
ratepredicted
sensitivity of τby
comparison
the σ pc of UHPFRCs,
was also
max , in
HPFRCs
using
the with
emperical
proposed
by reported
Ngo and Kim
and explained by [19] owing to the lower inertial effect, in the shear specimen, of mortar matrix
2017). surrounding fibers.
2
Exp_L00S15
Exp_L10S05
DIF for shear strength
Exp_L15S00
1.5
Cal_L00S15
Cal_L10S05
Cal_L00S15
1
0.5
0.00010.001 0.01
0.1
1
10
-1
Strain rate (s )
100 1000
Figure 7. Strain rate effect on shear resistance of UHPFRCs
Fig. 7. Strain rate effect on shear resistance of UHPFRCs
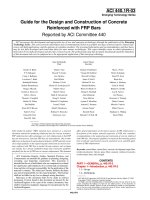
Fig. 7 plots the experimental shear strength (τexp ) and calculated shear strength (τcal ) of UHPFRCs
at high strain rates. In which, the τcal was calculated by a proposed equation of [19], as Eq. (2):
DIFτmax =
1
γ˙ s < γ˙ ≤ 110/s
0.07023 × (˙γ)0.582 γ˙ > 110/s
1
(2)
where DIFτmax is the DIFs for the shear strength, γ˙ s is static strain rate (0.000667 s−1 in this study), and
γ˙ is the applied shear strain rates. Notably, the coefficient 0.07023 in Eq. (2) was kept for the L15S00
and justified to 0.06 for the L00S15 and 0.048 for the L10S05, respectively, while the exponent (0.582)
was maintained. As demonstrated in Fig. 7, the shear strength of all investigated UHPFRCs could be
predicted by using the emperical proposed by [17].
5. Conclusions
The effects of blending fibers on the shear resistance of UHPFRCs at both static and higher strain
rates were investigated using a new shear test method. Specimens with the same size and boundary
conditions were used at both static and high strain rates to minimize the potential effects of inertia
and boundary conditions on the test results. The following observations and conclusions can be drawn
from this study:
- All the investigated UHPFRCs were sensitive to the applied strain rate, especially the L15S00.
- The L10S05 generated high synergy in shear strength, shear peak toughness at static rate, but
high synergy in shear strain and shear peak toughness at high strain rates.
19
Hoan, P. T., Thuong, N. T. / Journal of Science and Technology in Civil Engineering
Acknowledgement
This research is funded by Vietnam National Foundation for Science and Technology Development (NAFOSTED) under grant number 107.01-2018.22.
References
[1] Wille, K., Naaman, A. E., Parra-Montesinos, G. J. (2011). Ultra-High Performance Concrete with Compressive Strength Exceeding 150 MPa (22 ksi): A Simpler Way. ACI Materials Journal, 108(1).
[2] Wille, K., Kim, D. J., Naaman, A. E. (2011). Strain-hardening UHP-FRC with low fiber contents. Materials and Structures, 44(3):583–598.
[3] Kang, S.-T., Lee, Y., Park, Y.-D., Kim, J.-K. (2010). Tensile fracture properties of an Ultra High Performance Fiber Reinforced Concrete (UHPFRC) with steel fiber. Composite Structures, 92(1):61–71.
[4] Yoo, D.-Y., Kim, S., Park, G.-J., Park, J.-J., Kim, S.-W. (2017). Effects of fiber shape, aspect ratio,
and volume fraction on flexural behavior of ultra-high-performance fiber-reinforced cement composites.
Composite Structures, 174:375–388.
[5] Tran, N. T., Kim, D. J. (2017). Synergistic response of blending fibers in ultra-high-performance concrete
under high rate tensile loads. Cement and Concrete Composites, 78:132–145.
[6] Wille, K., Naaman, A. E. (2010). Fracture energy of UHPFRC under direct tensile loading. In FraMCoS-7
International Conference, 65–72.
[7] Kim, D. J., Wille, K., Naaman, A. E., El-Tawil, S. (2012). Strength dependent tensile behavior of strain
hardening fiber reinforced concrete. RILEM Bookseries, 2:3–10.
[8] Hannawi, K., Bian, H., Prince-Agbodjan, W., Raghavan, B. (2016). Effect of different types of fibers
on the microstructure and the mechanical behavior of ultra-high performance fiber-reinforced concretes.
Composites Part B: Engineering, 86:214–220.
[9] Wu, Z., Shi, C., He, W., Wu, L. (2016). Effects of steel fiber content and shape on mechanical properties
of ultra high performance concrete. Construction and Building Materials, 103:8–14.
[10] Wu, Z., Shi, C., He, W., Wang, D. (2017). Static and dynamic compressive properties of ultra-high
performance concrete (UHPC) with hybrid steel fiber reinforcements. Cement and Concrete Composites,
79:148–157.
[11] Yu, R., Spiesz, P., Brouwers, H. J. H. (2014). Static properties and impact resistance of a green Ultra-High
Performance Hybrid Fibre Reinforced Concrete (UHPHFRC): experiments and modeling. Construction
and Building Materials, 68:158–171.
[12] Wu, Z., Shi, C., He, W., Wang, D. (2016). Uniaxial compression behavior of ultra-high performance
concrete with hybrid steel fiber. Journal of Materials in Civil Engineering, 28(12):06016017.
[13] Park, S. H., Kim, D. J., Ryu, G. S., Koh, K. T. (2012). Tensile behavior of ultra high performance hybrid
fiber reinforced concrete. Cement and Concrete Composites, 34(2):172–184.
[14] Park, J. K., Kim, S.-W., Kim, D. J. (2017). Matrix-strength-dependent strain-rate sensitivity of strainhardening fiber-reinforced cementitious composites under tensile impact. Composite Structures, 162:
313–324.
[15] Kim, D. J., Park, S. H., Ryu, G. S., Koh, K. T. (2011). Comparative flexural behavior of hybrid ultra high
performance fiber reinforced concrete with different macro fibers. Construction and Building Materials,
25(11):4144–4155.
[16] Millard, S. G., Molyneaux, T. C. K., Barnett, S. J., Gao, X. (2010). Dynamic enhancement of blastresistant ultra high performance fibre-reinforced concrete under flexural and shear loading. International
Journal of Impact Engineering, 37(4):405–413.
[17] Ngo, T. T., Park, J. K., Pyo, S., Kim, D. J. (2017). Shear resistance of ultra-high-performance fiberreinforced concrete. Construction and Building Materials, 151:246–257.
[18] Ngo, T. T., Kim, D. J., Moon, J. H., Kim, S. W. (2018). Strain rate-dependent shear failure surfaces of
ultra-high-performance fiber-reinforced concretes. Construction and Building Materials, 171:901–912.
[19] Ngo, T. T., Kim, D. J. (2018). Shear stress versus strain responses of ultra-high-performance fiberreinforced concretes at high strain rates. International Journal of Impact Engineering, 111:187–198.
20