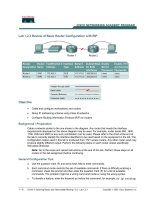
Tài liệu Experiences in Design and Implementation of a High Performance Transport Protocol doc
Bạn đang xem bản rút gọn của tài liệu. Xem và tải ngay bản đầy đủ của tài liệu tại đây (301.8 KB, 32 trang )
Experiences in Design and Implementation
of a High Performance Transport Protocol
Yunhong Gu, Xinwei Hong, and Robert L. Grossman
National Center for Data Mining
Outline
•
TCP’s inefficiency in grid applications
•
UDT
•
Design issues
•
Implementations issues
•
Conclusion and future work
TCP and AIMD
•
TCP has been very successful in the
Internet
–
AIMD (Additive Increase Multiplicative
Decrease)
•
Fair: max-min fairness
•
Stable: globally asynchronously stable
•
But, inefficient and not scalable
–
In grid networks (with high bandwidth-delay
product)
•
RTT bias
Efficiency of TCP
1 Gb/s link, 200ms RTT, between Tokyo and Chicago
28 minutes
On 10 Gb/s link, 200ms RTT, it will take 4 hours 43
minutes to recover from a single loss.
TCP’s throughput model:
It needs extremely low loss rate on high bandwidth-delay
product networks.
pRTT
S
2
3
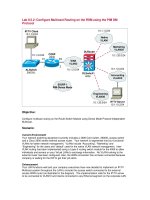
Fairness of TCP
100ms
1 Gb/s
1ms
1Gb/s
Merge two real-time data
streams
From Chicago 1 to Chicago 2:
800Mbps
From Amsterdam to Chicago 2:
80Mbps
The throughput is limited by the
slowest stream!
Amsterdam
Chicago 2
Chicago 1
UDT – UDP-based Data Transfer Protocol
•
Application level transport protocol built
above UDP
•
Reliable data delivery
•
End-to-end approach
•
Bi-directional
•
General transport API; not a (file transfer)
tool.
•
Open source
UDT Architecture
DATA
ACK
ACK2
NAK
Sender
Recver
Sender
Recver
Pkt. Scheduling Timer
ACK Timer
NAK Timer
Retransmission Timer
Rate Control Timer
Sender
UDT – Objectives
•
Goals
–
Easy to install and use
–
Efficient for bulk data transfer
–
Fair
–
Friendly to TCP
•
Non-goals
–
TCP replacement
–
Messaging service
Design Issues
•
Reliability/Acknowledging
•
Congestion/Flow Control
•
Performance evaluation
–
Efficiency
–
Fairness and friendliness
–
Stability
Reliability/Acknowledging
•
Acknowledging is expensive
–
Packet processing at end hosts and routers
–
Buffer processing
•
Timer-based selective acknowledgement
–
Send acknowledgement per constant time (if
there are packets to be acknowledged)
•
Explicit negative acknowledgement
Congestion Control
•
AIMD with decreasing increases
•
Increase formula
•
Decrease
–
1/9
•
Control interval is constant
–
SYN = 0.01 second
SYNS
x
xCL
11500
10)(
))(log(
⋅⋅=
−−
τ
α
UDT Algorithm
C (Mbps) L - C (Mbps) Increment (pkts/SYN)
[0, 9000) (1000, 10000] 10
[9000, 9900) (100, 1000] 1
[9900, 9990) (10, 100] 0.1
[9990, 9999) (1, 10] 0.01
[9999, 9999.9) (0.1, 1] 0.001
9999.9+ <0.1 0.00067
L = 10 Gbps, S = 1500 bytes
UDT: Efficiency and Fairness Characteristics
•
Takes 7.5 seconds to reach 90% of the link
capacity, independent of BDP
•
Satisfies max-min fairness if all the flows
have the same end-to-end link capacity
–
Otherwise, any flow will obtain at least half of
its fair share
•
Does not take more bandwidth than
concurrent TCP flow as long as
6/10
822
⋅≤⋅
SYNLRTT
Efficiency
0 10 20 30 40 50 60 70 80 90 100
0
200
400
600
800
1000
Time (s)
Throughput (Mbps)
to Chicago, 1Gbps, 0.04ms
to Canarie, OC-12, 16ms
to Amsterdam, 1Gbps, 110ms
•
UDT bandwidth utilization
–
960Mb/s on 1Gb/s
–
580Mb/s on OC-12 (622Mb/s)
0 10 20 30 40 50 60 70 80 90 100
0
200
400
600
0 10 20 30 40 50 60 70 80 90 100
320
322
324
326
328
330
Time (s)
Throughput (Mbps)
Fairness
•
Fair bandwidth sharing between networks with
different RTTs and bottleneck capacities
–
330 Mb/s each for the 3 flows from Chicago to Chicago
Local via 1Gb/s, Amsterdam via 1Gb/s and Ottawa via
622Mb/s
Fairness
10
-2
10
-1
10
0
10
1
10
2
10
3
0.8
0.85
0.9
0.95
1
RTT (ms)
Fairness Index
UDT
TCP
•
Fairness index
–
Simulation: Jain’s Fairness Index for 10 UDT
and TCP flows over 100Mb/s link with
different RTTs
RTT Fairness
10
0
10
1
10
2
10
3
0.9
0.92
0.94
0.96
0.98
1
RTT (ms)
RTT Fairness
•
Fairness index of TCP flows with different
RTTs
–
2 flows, one has 1ms RTT, the other varies
from 1ms to 1000ms
Fairness and Friendliness
50 TCP flows and 4
UDT flows between
SARA and StarLight
Realtime snapshot of
the throughput
The 4 UDT flows
have similar
performance and
leave enough space
for TCP flows
TCP Friendliness
0 1 2 3 4 5 6 7 8 9 10
20
30
40
50
60
70
80
Number of UDT flows
TCP Throughput (Mbps)
•
Impact on short life TCP flows
–
500 1MB TCP flows with 1-10 bulk UDT
flows, over 1Gb/s link between Chicago and
Amsterdam
Stability
10
-2
10
-1
10
0
10
1
10
2
10
3
0
0.2
0.4
0.6
0.8
RTT (ms)
Stability Index
UDT
TCP
•
Stability index of UDT and TCP
– Stability: average standard deviation of throughout
per unit time
– 10 UDT flows and 10 TCP flows with different RTTs
Implementations Issues
•
Efficiency and CPU utilization
•
Loss information processing
•
Memory management
•
API
•
Conformance
Efficiency and CPU utilization
•
Efficiency = Mbps/MHz
•
Maximize throughput
–
Use CPU time as little as possible, so that CPU
won’t be used up before network bottleneck is
reached
–
Remove CPU burst, which can cause packet
loss: even distribution of processing
•
Minimize CPU utilization
Loss Processing
•
On high BDP networks, the number of lost
packets can be very large during a loss event
•
Access to the loss information may take long time
•
Acknowledge may take several packets
0 10 20 30 40 50 60 70 80 90 100
0
1000
2000
3000
Loss Events
Number of Loss Packets
Loss Processing
•
UDT loss processing
–
Most loss are continuous
–
Record loss event other than lost packets
–
Access time is almost constant
0 10 20 30 40 50 60 70 80 90 100
0
2
4
6
8
Loss Events
Access Time (us)
Memory Processing
•
Memory copy avoidance
•
Overlapped IO
•
Data scattering/gathering
•
Speculation of next packet
Protocol Buffer Protocol Buffer
User Buffer
Data
New Data