A study on energy consumption of hotel buildings in Vietnam
Bạn đang xem bản rút gọn của tài liệu. Xem và tải ngay bản đầy đủ của tài liệu tại đây (341.25 KB, 8 trang )
Journal of Science and Technology in Civil Engineering NUCE 2018. 12 (5): 109–116
A STUDY ON ENERGY CONSUMPTION OF HOTEL BUILDINGS
IN VIETNAM
Mac Van Data , Tran Ngoc Quanga,∗
a
Faculty of Environmental Engineering, National University of Civil Engineering,
55 Giai Phong road, Hai Ba Trung district, Hanoi, Vietnam
Article history:
Received 13 July 2018, Revised 13 August 2018, Accepted 25 August 2018
Abstract
This paper aims to determine energy use intensity (EUI) and the percentage of end-use energy consumption in
hotel buildings in major cities of Vietnam, including Hanoi, Da Nang and Ho Chi Minh City (HCMC). Data
from 32 hotels were gathered from the website on energy efficiency promotion of Ministry of Construction. The
average EUI in the whole country was 151 kWh/m2 .year, and the figures for Hanoi, Da Nang, and HCMC were
184; 71 and 212 kWh/m2 .year, respectively. At the same time, the structure of end-use energy consumption
was estimated, of which 54% for heating, ventilation and air conditioning (HVAC), 10% for lighting, 19% for
plug equipment and 17% for lifts.
Keywords: energy consumption; energy use intensity (EUI); end-use energy consumption.
/>
c 2018 National University of Civil Engineering
1. Introduction
Hotels are classified as one of the highest energy consumption building categories. According to
[1], hotels together with offices and retails were the most energy consumption, typically accounting
for over 50% of the total energy consumption in UK, 64% in US, and 85% in Spain. In a study on
the energy efficiency of 29 hotel buildings in Singapore, the average energy use intensity (EUI) in
these hotel buildings was determined as 427 kWh/m2 .year [2]. In a similar study of 16 hotels in Hong
Kong, the average EUI was calculated about 564 kWh/m2 .year [3]. And the average EUI for hotel
buildings was 160 kWh/m2 .year in New Zealand [4].
In recent years, the number of hotel buildings has been increasing rapidly in Vietnam. By the
end of 2016, the number of upper 3-star hotels reached 784 in Vietnam, 31.1% higher compared
to those in 2013 [5]. Simultaneously, the number of visitors came to HCMC, Hanoi, and Da Nang
has kept increasing in recent years [5]. High demand for hotel service is associated with the massive
consumption of energy, and it is an important issue that needs to be solved in Vietnam. However, there
was only a study in 2000 mentioned on energy consumption of hotels in Vietnam [6]. Therefore, this
paper aims to generalize the situation of electrical energy consumption for hotel buildings in three
largest cities in Vietnam, and primary assess factors affecting energy consumption in this building
category.
∗
Corresponding author. E-mail address: (Quang, T. N.)
109
Dat, M. V., Quang, T. N. / Journal of Science and Technology in Civil Engineering
2. Methodology
2.1. Source of data and classification of hotels
Data used for this study were gathered from the website on energy efficiency promotion of Ministry of Construction, which built up based on surveys data for buildings in Vietnam in 2015 by the
project “Vietnam Clean Energy Program - VCEP”. Data for hotel buildings in Hanoi, Da Nang and
HCMC were collected by survey form, which consists of information on building characteristic, architecture and energy consumption by building equipment. At the same time, the comfort and luxury
levels of hotels normally classified by star (from 3-star to 5-star) were applied for the energy consumption assessment.
2.2. Calculation of energy use intensity
a. Building energy use intensity (EUI)
Energy use intensity (EUI) is expressed by a ratio between annual energy consumption and total
gross floor area (GFA) of building. The formula is as below [7]:
EUI =
Anual Energy Consumption
GFA
(1)
where EUI is energy use intensity (kWh/m2 .year); Annual Energy Consumption is energy consumption of the building for one year (kWh); GFA is total gross floor areas of the building including
basement floors (m2 ).
Energy consumption of the building was calculated based on monthly electricity bills in the year
of 2015, while GFA data were gathered from as-built drawings and/or directly measured on site.
b. End-use energy consumptions
End-use energy consumption, including heating, ventilation and air conditioning (HVAC), lighting, plug equipment and lift was determined based on the number of equipment and their installed
capacity, coincident factor, operating time, capacity used factor.
First, energy consumptions of lighting and lift are determined by formulas:
n
ECday =
(ni .Pi .hi .Ki µi )
(2)
i=1
ECyear = ECday .D.K
(3)
where ECyear is daily energy consumption (kWh/day); ni is the quantity of lamps or lifts type i; Pi is
the installed capacity of lamps or lifts type i (kW); hi is the daily operating time of lamps or lifts type
i (hours), Ki is the coincident factor of lamps or lifts type i; µi is the efficiency of lamps or lifts type
i; ECyear is annual energy consumption (kWh/year); D is the number of days lamps or lifts operated
in a year (day); K is lamps or lifts coincident factor.
Second, energy consumption by HVAC is total electric energy consumption of split and centralized air conditioners. Split air conditioner is determined by formula (2) and (3), while centralized air
conditioner (CAC) is determined as below:
Center
ECday
= (Qi /COPi ) .Ki .hi
(4)
Center
Center
ECyear
= ECday
.D.K
(5)
110
Dat, M. V., Quang, T. N. / Journal of Science and Technology in Civil Engineering
Center
where ECday
is daily energy consumption (kWh/day); Qi is the cooling capacity of CAC type i
(kW); COPi is the coefficient of performance of CACi ; Ki is the coincident factor of CAC type i
Center
during a day; hi is the duration of daily operation of CAC type i (hours); ECday
is annual energy
consumption (kWh/year); D is the duration of annual CAC operation (day); K is CAC coincident
factor.
Finally, energy consumption by plug equipment is estimated by extracting from the total building
energy consumption by excluding the energy consumption of HVAC, lighting and lift.
2.3. Data analysis
Data analysis is based on SPSS software version 16.0 (SPSS Inc.) with a confidence level of 5%.
3. Results and discussion
3.1. General information on surveyed hotel buildings
The information of 32 hotel buildings in Hanoi, Da Nang and HCMC was analyzed and presented
in Table 1. By locations, the number of hotels was comparable among three cities, of which 9 buildings
(28%) in Hanoi, 12 (37%) in Da Nang, and 11 (35%) in HCMC.
The classification of hotels by their star is presented in Table 1. The number of 4- and 5-star hotels
(over 75%) were higher than 3-star hotels (below 25%) in Hanoi and HCMC, while it is opposite in
Da Nang, where the figure for 4- and 5-star hotels was lower than 3-star hotels (42% and 58%,
respectively).
Table 1. General statistic of surveyed hotels in three major cities in Vietnam
Hanoi
Type of hotel
3-star
4- and 5-star
Total
% for whole country
Da Nang
HCMC
Number
%
Number
%
Number
%
2
7
9
22.2%
77.8%
100%
7
5
12
58.3%
41.7%
100%
1
10
11
9.1%
90.9%
100%
28%
37%
35%
3.2. Electric energy consumption
Monthly electric energy consumption
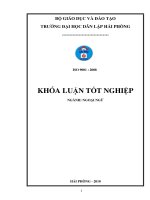
According to the data from monthly electricity bills, it is clear that building electric energy consumption in Hanoi was higher in summer and winter (May to November). In Da Nang, highest building energy consumption was during summer (June to August), while building energy consumption in
HCMC was quite stable all year round (Fig. 1). The energy consumption for lighting, lift and equipment was quite stable round the year, while HVAC is heavily dependent on weather conditions [2].
With high temperature all year round, energy consumption for HVAC in HCMC was highest, while in
Da Nang, HVAC energy consumption is just few summer months, leading to lowest building energy
consumption. In case of Hanoi, HVAC is used for both hot summer months (cooling) and cold winter
months (heating), it makes hotel energy consumption in Hanoi be higher compared to those in Da
Nang, but still lower than those in HCMC.
111
while in Danang, HVAC energy consumption is just few summer months, leading to
lowest building energy consumption. In case of Hanoi, HVAC is used for both hot
summer months (cooling) and cold winter months (heating), it makes hotel energy
consumption in Hanoi be higher compared to those in Danang, but still lower than those
in HCMC.
Dat, M. V., Quang, T. N. / Journal of Science and Technology in Civil Engineering
Energy Consumption (kWh)
600000
500000
400000
Hanoi
300000
Da Nang
200000
HCM
100000
0
1
2
3
4
5
6
7
Month
8
9
10
11
12
Figure 1. Average monthly energy consumption of hotel buildings in Vietnam
Figure 1. Average monthly energy consumption of hotel buildings in Vietnam.
Key end-use energy consumption
Key end-use energy consumption
The percentages of end-use energy consumption of the hotel buildings in
The Vietnam
percentages
end-use
energy2. consumption
the hotelofbuildings
in Vietnam are
are of
shown
in Table
Overall, the of
percentage
energy consumption
forshown in
Table 2. Overall, the percentage of energy consumption for HVAC was highest with 54%, the figure for
lighting was lowest at 10%, while the figures for equipment and lift were 19% and 17%, respectively.
The results of this study were similar to those in US, UK, Spain [1] and Hong Kong [3] (Table 3).
Table 2. The percentage of end-use energy consumptions at hotel buildings in three cities in Vietnam
Hanoi
Energy end uses
Lighting
Equipment
HVAC
Lift
Total
Da Nang
HCMC
Vietnam
Mean (%)
SD
Mean (%)
SD
Mean (%)
SD
Mean (%)
SD
12
17
50
21
100
7
8
12
10
7
23
53
18
100
6
19
24
18
12
16
60
11
100
7
7
18
11
10
19
54
17
100
7
13
19
14
Table 3. The comparisons of end-use energy consumptions of hotel buildings in Vietnam and the World
Energy end uses
Source
Lighting
Equipment
HVAC
Lift
Others
This study (%)
USA (%)
UK (%)
Spain (%)
Hong Kong (%)
10
19
54
17
-
[1]
22
13
48
21
[1]
17
5
55
23
[1]
33
10
52
5
[3]
17
45
7
31
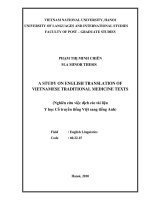
Overall the percentage of energy consumption for HVAC was highest, at about 50%, 53% and
54% in Hanoi, Da Nang and HCMC, respectively; for lighting ranged of 7–12%; while equipment
from 16–23% and lift from 12–21% (Table 2, Fig. 2).
112
Dat, M. V., Quang, T. N. / Journal of Science and Technology in Civil Engineering
Figure 2. The percentage of end-use energy consumptions of hotel buildings in Vietnam
3.3. Energy use intensity (EUI)
The statistical description of EUIs for hotel buildings is presented in Table 4. The average EUI
for the whole country was 151 kWh/m2 .year; the detail figure for Hanoi, Da Nang and HCMC was
184; 70.6 and 212.3 kWh/m2 .year, respectively.
Table 4. EUIs of hotel buildings in three cities in Vietnam (kWh/m2 .year)
City
Hanoi
Da Nang
HCMC
Whole Country
Number of Hotel
Mean
Std. Deviation
Maximum
Minimum
9
12
11
32
184.0
70.6
212.3
151.2
59.16
48.28
59.62
83.85
265.90
203.35
326.15
326.15
99.65
28.16
115.24
28.16
The difference of hotel EUIs in different regions could be understood. Firstly, energy consumption
of hotel buildings depends on the number of visitors in a year [8]. Secondly, the main reason is the
influence of climate conditions. The relationship between energy consumption of HVAC (the highest
energy usage in the buildings) and weather conditions was studied by many researchers [2]. In this
study, Hanoi (the north of Vietnam) represents for monsoon tropical climate with hot and humid
weather during summer and cold weather during winter; while HCMC (the south of Vietnam) locates
at a hot climate region with high yearly average ambient temperature. Da Nang (the center of Vietnam)
is middle of the two regions, where the weather is milder. These climate conditions are strongly
influenced the use of energy for building air conditioning. The lowest hotel energy consumption
in Da Nang may be due to the practice of visitors. Unlike Hanoi and HCMC, visitors in Da Nang
usually spend more their time outside going to the beach, traveling to attracted tourism places in and
113
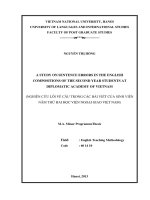
the average hotels EUI of this study were lower than those in Spain, where the average
EUI of 4- and 3-star hotels were about 179 and 129 kWh/m2.year, respectively [9]. The
other study in Shanghai was determined that average EUI of 3-, 4- and 5-star hotels
were about 126, 235 and 280 kWh/m2.year, respectively [10] (Fig. 3).
Dat, M. V., Quang, T. N. / Journal of Science and Technology in Civil Engineering
Table 4. EUIs of hotel buildings in three cities in Vietnam (kWh/m2.year)
surrounding Da Nang than staying inside hotels. Furthermore, during nighttime, they can open hotel
room windows for utilizing
natural
Number
of beach cool wind instead of using air conditioning.
City reason to consider is that
Mean
Std.consumption
Deviation in
Maximum
Minimum
The other
the energy
hotels is strongly
dependent on
Hotel
their stand (number of star). Across the country the average EUI of 4- and 5-star hotels was about
Hanoi
9
184.0
59.16
265.90
99.65
170 kWh/m2 .year, significantly higher than that at 3-star hotels (111 kWh/m2 .year) (Fig. 3). Accord2
203.35which was28.16
ing toDanang
[6], the average EUI of 12
4-star hotels 70.6
was identified 48.28
141 kWh/m .year,
lower than
2
this study,
but for 3-star hotels11
of 143 kWh/m
higher compared
to this study.
For interHCMC
212.3.year, which59.62
326.15
115.24
national comparison, the average hotels EUI of this study were lower than those in Spain, where the
Whole
average EUI of 4- and 3-star hotels
kWh/m2 .year,
respectively [9].
The other
32 were about
151.2179 and 12983.85
326.15
28.16
studyCountry
in Shanghai was determined that average EUI of 3-, 4- and 5-star hotels were about 126, 235
and 280 kWh/m2 .year, respectively [10] (Fig. 3).
EUI (kWh/m2.year)
300
250
200
150
100
50
0
Figure 3. Average EUI of 3-, 4- and 5-star hotels in Vietnam and the world
Figure 3. Average EUI of 3-, 4- and 5-star hotels in Vietnam and the world
EUI of hotel buildings in Vietnam and the World
EUI of hotel
buildings
Vietnam
andofthehotel
Worldbuildings in Vietnam was about 151
Overall,
the in
average
EUI
2
kWh/m .year, which was lower than those in other countries [1-4, 8, 11-13]
Overall, the average EUI of hotel buildings in Vietnam was about 151 kWh/m2 .year, which was
lower than those in other countries [1–4, 8, 11–13].
There are many studies about average EUI of hotel buildings in Asia. In Singapore, the average
EUI of 29 hotel buildings was about 427 kWh/m2 .year [2], while the figures for Taiwan [8], Hong
Kong in 1994 [11] and Hong Kong in 1998 [3] were about 295, 366 and 564 kWh/m2 .year respectively
(Fig. 4).
Compared with some countries in Europe and the USA, the average EUI for this study was also
lower. In the USA (2003), the figure was identified about 316 kWh/m2 .year [1], while the average
EUI for New Zealand in 2000 [4], Europe (Hilton International) [12] and Turkey [13] were about 160,
364, and 388 kWh/m2 .year respectively (Fig. 4).
The reasons for the EUIs of hotel buildings in Vietnam lower than other hotels worldwide could be:
1. Due to the difference in climate conditions – actually, the summer in Europe [12, 13] and
New Zealand [4] is cooler, but their winter is longer and extremely colder. It requests more energy
114
Dat, M. V., Quang, T. N. / Journal of Science and Technology in Civil Engineering
consumption for building heating. In case of Singapore [2], the country is near the equator with year
around hot climate. Therefore, they consumed more energy for air cooling.
2. Due to the difference in the definition of building energy consumption: in this study, only
electric energy was counted for, while in others [3, 8], it included oil and gas.
3. Due to the difference in the calculation of building gross floor area (GFA), which was the total
area of all building floors, including basements, while others [2, 3] only counted from ground and
upper floors.
EUI (kWh/m2.year)
600
500
400
300
200
100
0
Figure 4. The figures compare average EUI between this study and other countries
4. Conclusion
The total building and their end-use energy consumption and average EUIs of 32 hotel buildings in
Hanoi, Da Nang and HCMC were quantified. Average EUI of hotels building was 151 kWh/m2 .year. It
was significantly lower than other hotels worldwide. The percentages of end-use energy consumptions
were estimated for 54%, 10%, 19% and 17% for HVAC, lighting, plug equipment and lift, respectively.
The results were relevant to those in some oversee countries.
References
[1] Pérez-Lombard, L., Ortiz, J., Pout, C. (2008). A review on buildings energy consumption information.
Energy Build, 40(3):394–398.
[2] Priyadarsini, R., Xuchao, W., Eang, L. S. (2009). A study on energy performance of hotel buildings in
Singapore. Energy and Buildings, 41(12):1319–1324.
[3] Deng, S.-M., Burnett, J. (2000). A study of energy performance of hotel buildings in Hong Kong. Energy
and Buildings, 31(1):7–12.
[4] Becken, S., Frampton, C., Simmons, D. (2001). Energy consumption patterns in the accommodation
sector–the New Zealand case. Ecological Economics, 39(3):371–386.
[5] Vietdata (2016). General statistic of international and domestic visitors arrived Vietnam in 2015.
[6] Trung, D. N., Kumar, S. (2005). Resource use and waste management in Vietnam hotel industry. Journal
of Cleaner Production, 13(2):109–116.
115
Dat, M. V., Quang, T. N. / Journal of Science and Technology in Civil Engineering
[7] Yahya, S. N. N. S., Ariffin, A. R. M., Ismail, M. A. (2015). Building energy index and students’ perceived performance in public university buildings. In Renewable Energy in the Service of Mankind Vol I,
Springer, 541–550.
[8] Wang, J. C. (2012). A study on the energy performance of hotel buildings in Taiwan. Energy and
Buildings, 49:268–275.
[9] Rosselló-Batle, B., Moià, A., Cladera, A., Martínez, V. (2010). Energy use, CO2 emissions and waste
throughout the life cycle of a sample of hotels in the Balearic Islands. Energy and Buildings, 42(4):
547–558.
[10] Yao, Z., Zhuang, Z., Gu, W. (2015). Study on energy use characteristics of hotel buildings in Shanghai.
Procedia Engineering, 121:1977–1982.
[11] Lam, J. C., Chan, A. L. S. (1994). Characteristics of electricity consumption in commercial buildings:
Survey of electricity consumption in fully air-conditioned office buildings and hotels in Hong Kong,
implications for energy conservation in buildings. Building Research and Information, 22(6):313–318.
[12] Bohdanowicz, P., Martinac, I. (2007). Determinants and benchmarking of resource consumption in
hotels–Case study of Hilton International and Scandic in Europe. Energy and Buildings, 39(1):82–95.
¨ ut, S., Soner, S. (2006). Energy efficiency assessment for the Antalya Region hotels in Turkey. Energy
[13] On¨
and Buildings, 38(8):964–971.
116