A big data analytics framework for IoT applications in the cloud
Bạn đang xem bản rút gọn của tài liệu. Xem và tải ngay bản đầy đủ của tài liệu tại đây (757.3 KB, 12 trang )
VNU Journal of Science: Comp. Science & Com. Eng., Vol. 31, No. 2 (2015) 44–55
A Big Data Analytics Framework
for IoT Applications in the Cloud
Linh Manh Pham
University of Grenoble Alpes, Grenoble, France
Abstract
The Internet of Things (IoT) is an evolution of connected networks including million chatty embedded devices. A
huge amount of data generated day by day by things must be aggregated and analyzed with technologies of the
“Big Data Analytics”. It requires coordination of complex components deployed both on premises and Cloud
platforms. This article proposes BDAaaS, a flexibly adaptive cloud-based framework for real-time Big Data
analytics. The framework collects and analyzes data for IoT applications reusing existing components such as IoT
gateways, Message brokers and Big Data Analytics platforms which are deployed automatically. We demonstrate
and evaluate BDAaaS with the implementation of a smart-grid use case using dataset originating from a practical
source. The results show that our approach can generate predictive power consumption fitting well with real
consumption curve, which proves its soundness.
c 2015 Published by VNU Journal of Sciences.
Manuscript communication: received 28 April 2015, revised 20 June 2015, accepted 25 June 2015
Correspondence: Linh Manh Pham,
Keywords: Big Data Analytics, Cloud Computing, Event Stream Processing, Internet of Things.
1. Introduction
Millions of chatty embedded devices such as
wireless sensors, RFID, mobile sensors have been
operating in the connected networks of Internet of
Things (IoT). According to Forbes, the number
of connected things will be approximately 41
billions by the end of 2020 [1]. IoT fully
benefits from economic models offered by upto-date technologies from Cloud computing (i.e.
pay-as-you-go style), which improves the quality
of service delivered to customers and helps
them to satisfy their legal and contractual duties.
However, associated IoT services require the
collecting of huge amount of data produced
by swarms of sensors using dedicated gateways
and the analysis these data using “Big Data
Analytics” platforms (BDA for short). The BDA
offers models (e.g. Map-Reduce, ESP, CEP [2])
and technologies (e.g. Hadoop, Storm [3]),
deployed on Cloud [4]. Moreover, deploying
a BDA infrastructure often requires engineers
with skills in various technologies of Cloud
computing, Big Data, IoT as well as knowledge
in diverse business domains such as smart grid,
healthcare, supply chain, etc. Gartner forecasts
that the projects in Big Data will globally create
4.4 million IT jobs by 2015 [5]. However,
this number is underestimated with the billions
of “chatty” connected things which will be
integrated continuously in the next few years.
This practice will create a new kind of job
which requires people who are both business and
domain experts to design and deploy complex
analytic workflows and to interpret big data
results. These experts need the efficient tools to
coordinate all the phases in an automatic manner.
The BDAaaS is a framework to provide
specifications for generating specific cloudbased PaaS of real-time BDA applications.
L.M. Pham / VNU Journal of Science: Comp. Science & Com. Eng., Vol. 31, No. 2 (2015) 44–55
The BDAaaS project targets the people who are
not expert of Cloud deployment and configuration
(i.e.
D&C process).
It enables to build
complex workflows of standard analytics, sensor
data sources and data viz components and to
deploy them both on the IoT gateways and on
virtual servers hosted by one or several Cloud
platforms. Moreover, the framework aims to
design and deploy rapidly SaaS for BDA. The
main motivation of BDAaaS is not only to
ease the provisioning of such real-time BDA
applications but also to collect and analyze data
from IoT gateways to Cloud hosting. The
objectives of the framework are to
• ease the D&C works of the components
involved in the collecting and filtering
workflows from the IoT gateways to the
streaming processors deployed on a Cloud
platform.
• provide statistic��������������������������������������������������������������������������������������������������������������������������������������������������������������������������������������������������������������������������������������������������������������������������������������������������������������������������������������������������������������������������������������������������������������������������������������������������������������������������������������������������������������������������������������������������������������������������������������������������������������������������������������������������������������������������������������������������������������������������������������������������������������������������������������������������������������������������������������������������������������������������������������������������������������������������������������������������������������������������������������������������������������������������������������������������������������������������������������������������������������������������������������������������������������������������������������������������������������������������������������������������������������������������������������������������������������������������������������������������������������������������������������������������������������������������������������������������������������������������������������������������������������������������������������������������������������������������������������������������������������������������������������������������������������������������������������������������������������������������������������������������������������������������������������������������������������������������������������������������������������������������������������������������������������������������������������������������������������������������������������������������������������������������������������������������������������������������������������������������������������������������������������������������������������������������������������������������������������������������������������������������������������������������������������������������������������������������������������������������������������������������������������������������������������������������������������������������������������������������������������������������������������������������������������������������������������������������������������������������������������������������������������������������������������������������������������������������������������������������������������������������������������������������������������������������������������������������������������������������������������������������������������������������������������������������������������������������������������������������������������������������������������������������������������������������������������������������������������������������������������������������������������������������������������������������������������������������������������������������������������������������������������������������������������������������������������������������������������������������������������������������������������������������������������������������������������������������������������������������������������������������������������������������������������������������������������������������������������������������������������������������������������������������������������������������������������������������������������������������������������������������������������������������������������������������������������������������������������������������������������������������������������������������������������������������������������������������������������������������������������������������������������������������������������������������������������������������������������������������������������������������������������������������������������������������������������������������������������������������������������������������������������������������������������������������������������������������������������������������������������������������������������������������������������������������������������������������������������������������������������������������������������������������������������������������������������������������������������������������������������������������������������������������������������������������������������������������������������������������������������������������������������������������������������������������������������������������������������������������������������������������������������������������������������������������������������������������������������������������������������������������������������������������������������������������������������������������������������������������������������������������������������������������������������������������������������������������������������������������������������������������������������������������������������������������������������������������������������������������������������������������������������������������������������������������������������������������������������������������������������������������������������������������������������������������������������������������������������������������������������������������������������������������������������������������������������������������������������������������������������������������������������������������������������������������������������������������������������������������������������������������������������������������������������������������������������������������������������������������������������������������������������������������������������������������������������������������������������������������������������������������������������������������������������������������������������������������������������������������������������������������������������������������������������������������������������������������������������������������������������������������������������������������������������������������������������������������������������������������������������������������������������������������������������������������������������������������������������������������������������������������������������������������������������������������������������������������������������������������������������������������������������������������������������������������������������������������������������������������������������������������������������������������������������������������������������������������������������������������������������������������������������������������������������������������������������������������������������������������������������������������������������������������������������������������������������������������������������������������������������������������������������������������������������������������������������������������������������������������������������������������������������������������������������������������������������������������������������������������������������������������������������������������������������������������������������������������������������������������������������������������������������������������������������������������������������������������������������������������������������������������������������������������������������������������������������������������������������������������������������������������������������������������������������������������������������������������������������������������������������������������������������������������������������������������������������������������������������������������������������������������������������������������������������������������������������������������������������������������������������������������������������������������������������������������������������������������������������������������������������������������������������������������������������������������������������������������������������������������������������������������������������������������������used
by OpenHAB for executing the home automation
actions. The OpenHAB rule engine evaluates
and executes ECA rules which are written in
a DSL based on Eclipse XText and XTend.
ECA rules are triggered on sensor value changes,
command emission and timer expiration. Events
(e.g. state changes and commands) can be
“imported” or “exported” using bindings for
MQTT, XMPP, Twitter, etc. OpenHAB can be
installed and run on embedded boards, some of
which are Raspberry Pi, Beaglebone Black and
Intel Galileo.
For the smart-grid use case, we have developed
a new OpenHAB plugin (called binding) in order
to replay the sensor log files containing the smart-
48
L.M. Pham / VNU Journal of Science: Comp. Science & Com. Eng., Vol. 31, No. 2 (2015) 44–55
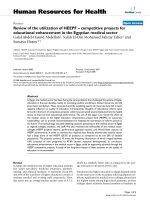
Fig. 2: The BDAaaS’s components for the smart-grid use case.
plug measurements (e.g. timestamped load and
work) of each house. OpenHAB-BDAaaS is the
packaging of OpenHAB for the BDA applications
including the plug-in and the data files. This
package can be deployed on both embedded
boards and virtual machines with one instance per
house.
3.2. MQTT Brokers
MQ Telemetry Transport (MQTT) [19] is a
transport data protocol for M2M networks. It
is devised for supporting low-bandwidth and
unreliable networks, as illustrated by satellite
links or sensor networks. MQTT follows the
publish-subscribe pattern between the sensors
and one or more sinks like M2M gateways,
etc. MQTT is now an OASIS standard. The
main robust and open-source implementations of
MQTT brokers are Mosquitto and RabbitMQ.
3.3. Speed Layer for Real-time Analytics
For the speed layer of the lambda architecture,
we have chosen the Apache Storm platform.
Storm is a real-time event-stream processing
system. It is designed to deploy a processing
chain in a distributed infrastructure such as a
Cloud platform (IaaS). Storm can be applied
successfully to the analysis of real-time data and
events for sensor networks (real-time resource
forecasting, consumption prediction), log file
system (monitoring and DDoS attack detection),
finance (risk management), marketing and social
networks (trend, advertising campaign). Initially
developed by Twitter, its challengers are Apache
S4 (Yahoo!), Spark Streaming, Millwheel
(Google), and Apache Samza (LinkedIn). For
the use case, we have developed a new Storm
input components (called spout) in order to
generate sensor tuples from the MQTT brokers
by subscribing on the MQTT topics with one
spout per house.
3.4. Historical Data Storage
In the speed layer, the Storm topology needs to
maintain some execution ongoing state. This is
the case for the sliding window average of sensor
values. To do this we use Storm with Cassandra
for our real-time power consumption prediction.
L.M. Pham / VNU Journal of Science: Comp. Science & Com. Eng., Vol. 31, No. 2 (2015) 44–55
# An Azure VM
VM_AZURE {
alias : VM Azure ;
installer : iaas ;
children : Storm_Cluster ,
Cassandra ;
}
# A BeagleBone Black
BOARD_BEAGLEBONE {
alias : BeagleBone Black ;
installer : embedded ;
children : OpenHAB ;
}
49
# Storm Cluster for ESP
Storm_Cluster {
alias : Storm Cluster ;
installer : bash ;
imports : Nimbus . port , Nimbus . ip ;
children : Nimbus , Storm_Supervisor ;
}
# OpenHAB : A Home Automation Bus
OpenHAB {
alias : OpenHAB ;
installer : puppet ;
exports : ip ,
brokerChoice = Mosquitto ;
imports : Mosquitto . ip ,
Mosquitto . port ;
}
...
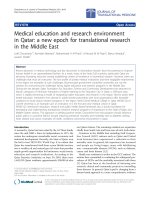
Fig. 3: Components of the smart-grid use case under the orchestrator’s DSL.
Cassandra is an open source distributed database
management system (NoSQL solution). It is
created to handle large amounts of data spread
out across many nodes, while providing a
highly available service with no single point
of failure.
Cassandra’s data model allows
incremental modifications of rows.
3.5. Visualization Dashboard
For the forecast visualization, we have
developed a simple dashboard displaying charts
of current and predicted consumptions for
suppliers and consumers. The dashboard is
a simple HTML5 webapp using the Grafana,
Bootstrap and AngularJS libraries. The webapp
gets the data from the historical storage and
subscribes to real-time updates through a
websocket.
3.6. D&C Manager
As mentioned, DSL of our chosen Cloud
orchestrator is a hierarchical language which
allows sysadmins to describe naturally multitier complex applications such as Java EE,
OSGi, IoT, etc. Smart grid is a multi-tier
BDA application implementing two layers of
lambda architecture (speed and serving ones)
and other layers including sensor data collecting,
encapsulated message dispersion, etc. Thus it
is a just-right solution for our application. The
configuration of components in smart-grid use
case under the orchestrator’s DSL are excerpted
and shown in Figure 3. We see that some
components may have their children which are
OpenHAB in the case of BOARD BEAGLEBONE
and Storm Cluster, Cassandra in the case of
VM AZURE, respectively. The components at
sublayer, in turn, may contain subcomponents
which are either stubs or not. Puppet and Bash
is some of many choices for configuration tools.
The components can exchange the configuration
information using export/import variables. This
mechanism help resolving inter-dependencies
among components dynamically at runtime. For
instance, like shown in Figure 3 and 4, an instance
of Nimbus exports its port and IP which will be
imported by a specific instance of Storm cluster.
It is worth noting that an instance can be either
exporter or importer like OpenHAB instance in
Figure 3. This exchangeable mechanism is also
detailed in [10]. Overall, we can see how is
easy to describe and replace components with the
hierarchy, which conforms to the design principle
of the BDAaaS itself.
50
L.M. Pham / VNU Journal of Science: Comp. Science & Com. Eng., Vol. 31, No. 2 (2015) 44–55
# A VM Azure with Nimbus
instance of VM_AZURE {
name : vm - azure - nimbus -1;
instance of Nimbus {
name : nimbus - storm -1;
port : 6627;
}
}
# A BeagleBone Board for OpenHAB
instance of BOARD_BEAGLEBONE {
name : board - bb - openhab -1;
instance of OpenHAB {
name : openhab -1;
}
}
# A VM EC2 for Message Broker
instance of VM_EC2 {
name : vm - ec2 - mosquitto -1;
instance of Mosquitto {
name : mosquitto -1;
port : 1883;
}
}
# A VM OpenStack with Cassandra
instance of VM_OpenStack {
name : vm - openstack - cassandra -1;
instance of Cassandra {
name : cassandra -1;
}
}
...
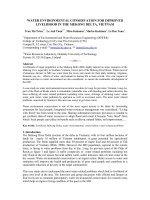
Fig. 4: Instances of components of the smart-grid use case under the orchestrator’s DSL.
4. Validating Experiments
In order to evaluate our work, we implement
the smart-grid use case on a hybrid Cloud
environment. Each house is represented by an
OpenHAB process which publishes the given
dataset related to the house (approximately
2.5 GB per house).
The 2.5 GB dataset
files are preloaded on microSD cards. These
gateways are deployed on Beaglebone Black [20]
embedded boards. The publication is done with
the OpenHABs MQTT binding. The MQTT
topic hierarchy contains a distinct topic for
each house. The Storm topology’s spout (see
Section 4.2) subscribes to the MQTT topics and
then retrieves data by sending them as a stream
of Storm tuples over the analysis chain. The
aggregated data and results are finally stored
in an Apache Cassandra database which is in
our OpenStack private Cloud for safety. The
cluster of MQTT brokers, containing the topics,
and the publishers are hosted on EC2 public
Cloud virtual machines. The Storm cluster
has 3 worker nodes, each corresponding to a
virtual machine instance on the Cloud of Azure
for taking advantage of computing strength of
our granted Microsoft infrastructure. Instead
of deploying on Beaglebone Black, OpenHAB
processes publishing the dataset can also be
deployed and run on any virtual machines or
containers on the Cloud. In either case, the
D&C process is performed automatically by the
chosen orchestrator. Figure 4 shows a short
extract about instances of the experiment under
the orchestrator’s DSL. We can see how this
hierarchical language is successful in describing
the distributed multi-tier complex applications.
4.1. The Dataset
The smart-grid application uses dataset based
on practical records collecting from smart plugs,
which are deployed in private households of 40
houses located in Germany. Those data are
collected roughly every second for each sensor
in each smart plug. It is worth noting that the
data set is gathered in an real-world, uncontrolled
environment, which implies the possibility of
producing imperfect data and measurements. A
measurement scenario is described as follows.
The topmost entity is a house, identified by a
unique house ID. Every house combines one
or more households, identified by a unique
household ID within a house. One or more
smart plugs are installed in every household,
L.M. Pham / VNU Journal of Science: Comp. Science & Com. Eng., Vol. 31, No. 2 (2015) 44–55
51
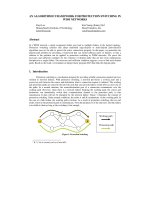
Fig. 5: The Storm topology used in the smart-grid use case.
each identified by an unique plug ID within a
household. Every smart plug contains one or
more types of sensors (e.g. load or work). The
collected data stored preliminarily in a commaseparated file consisting of 4055 millions of
measurements for 2125 plugs distributed across
40 houses. An one-month period of power
consumption is recorded with the first timestamp
equal to 1377986401 (01/01/2013, 00:00:00)
and the last timestamp equal to 1380578399
(30/09/2013, 23:59:59). All events in the data file
are sorted by the timestamp value with the same
timestamp ordered randomly. The fields included
in this file are:
• houseID an unique identifier of a house
• value value of the measurement
Our mission is to replay these data and spray it
out by a plug-in of OpenHAB (see Section. 3.1).
The goal of the analysis is the real-time prediction
of power consumption in several thousands of
houses. For the sake of the demonstration, data
induced from smart plugs are stored in individual
files (one per house). Those files are replayed
by OpenHAB threads (each one emulates an IoT
gateway). Each OpenHAB thread sends (i.e.
publishing) the data recorded in the file using
the MQTT protocol. The data are then sent
to the machines running the real-time analysis
platform through MQTT brokers (Mosquitto and
RabbitMQ). The real-time analysis platform is
a Storm topology which analyzes the power
consumption measurements and computes the
overall load in the next half-hour.
• property character representing for type of
the measurement
4.2. Storm Topology
Forecasting
• plugID an unique identifier within a
household of a smart plug
Storm is an open source distributed real-time
computation system. It provides a programming
model for implementing real-time processing
on a cluster of physical or virtual machines.
To handle the consumption prediction query in
• id an unique identifier of a gauge
• timestamp timestamp of a gauge
• householdID an unique identifier of a
household within a house
for
Real-time
Load
52
L.M. Pham / VNU Journal of Science: Comp. Science & Com. Eng., Vol. 31, No. 2 (2015) 44–55
a continuous and scalable manner we use a
Storm-based solution. The elaborations consist
of queries that are continuously evaluated on
the events supplied as input. Storm cluster is
composed of two kinds of nodes: a master node
which runs a daemon called Nimbus and worker
ones which run a daemon called Supervisor.
The Nimbus is responsible for distributing code
around the cluster, assigning tasks to machines
and monitoring for failures. Each supervisor
listens for works assigned to its node, it starts
and stops worker processes when necessary based
on what Nimbus has assigned to it. Each worker
process executes a subset of a topology; a running
topology may consist of many worker processes
spread across many nodes.
A topology is a graph of computation. Each
node in a topology encompasses a processing
logic, and links between nodes indicate data flows
between these ones. The unit of information
that is exchanged among components is referred
as a tuple, which is a named list of values.
There are two types of components which are
spout and bolt. A spout component encapsulates
the production of tuples. A bolt encapsulates a
processing logic manipulating the tuples such as
filtering.
The communication patterns among components
are represented by streams, unbounded sequences
of tuples that are emitted by spouts or bolts and
consumed by bolts. Each bolt can subscribe to
many distinct streams in order to receive and
consume their tuples. Both spouts and bolts can
emit tuples on different streams as needed.
We pose a solution based on Trident [21],
a high-level abstraction of Storm topology for
doing real-time computing. Our Trident topology
produces a source of streams (e.g. MQTT spout)
that emits a stream of load/work measurements
for each plug. For construct a forecast model that
operates on long term historical data with on live
data, we have two processes which consume this
stream as indicated in Figure 5:
• A first processing step computes average
consumption for N equal-size slices of |s|
seconds for each plug and house (with an
aggregated treatment). We use Cassandra
database to store such data.
• The second processing computes the
consumption forecast for each temporal
resolution (1, 5, 15, 60 and 120 minutes) at
each level, e.g. houses and plugs. To take
into account the long term historical data,
the prediction model uses the stored results
from the first processing chain.
To generalize the query answer, our framework
allows to apply/test several forecasting
paradigms, with possibility to use external
or in-house existing implementation, e.g. in R or
Python. For this particular experiment, the model
determines the per-house prediction value of load
at slice s[i+2] with “i” stands for index of current
slice as follows:
1
L(s[i + 2]) = (L(s[i]) + median({L(s[ j])}))
2
where L(s[i]) is the average load for current
slice s[i] calculated as a sum of average values
for each smart plug within the house. {L(s[ j])} is
a set of average load values for all slices s[j] at the
same time window with s[i+2] of days in the past
within the given period.
The diagram in the Figure 5 presents our
suggested topology which is submitted to Storm
clusters for execution.
Fig. 6: Power consumption (effective and prediction)
for house #1.
4.3. Result Discussion
Figure 6 and 7 show the results of predictions
with 1-minute resolution for houses #1 and #30
L.M. Pham / VNU Journal of Science: Comp. Science & Com. Eng., Vol. 31, No. 2 (2015) 44–55
Fig. 7: Power consumption (effective and prediction)
for house #30.
respectively. The real power consumption is
displayed by a red line and the prediction one
is represented by a green dotted-line. We can
see that the form and trend of the prediction
lines almost fit into the form of real consumption
curves. In the house #1, the drop-down of the
consumption around 50th minute is forecasted
exactly and timely. Moreover, these results have
been obtained soon enough to allow a smooth
analysis of the incoming consumption data from
the smart plugs. This proves for the soundness
and efficiency of proposed framework.
5. Related Work
Since the BDAaaS is a flexible cloud-based
PaaS framework for real-time BDA, we compare
it with Cloud frameworks for BDA and Cloud
frameworks for IoT.
Talia in [22] states that cloud-based analytic
platforms will become popular within a couple
of years. These analytic platforms based on
both open source systems such as Apache
Hadoop, SciDB, etc. and proprietary solutions
such as Storm, Splunk, IBM, InsightsOne,
etc. Data Mining Cloud Framework as a Data
Analytic (DAPaaS) programming environment
for development of BDA applications are
presented, including supports for single-task
and parameter-sweeping data mining programs.
A workflow framework running on Cloud
systems using service-oriented approach and
graph programming is being integrated into the
project.
Commercial Big Data as-a-Service
53
(BDaaS) solutions are currently available and
built on open-source solutions.
Proprietary
products of Splunk such as Splunk Storm or
Splunk Cloud [23] are cloud-based services that
consume, search and visualize different sources
of machine data. This multi-tenant DA SaaS
model provides analyzing and monitoring suites
for developers, application support staffs, system
administrators, and security analysts who have to
deal with a bulk of data every single day. Amazon
Kinesis offers real-time processing, scalable data
throughput and volume which accommodate up
to “hundreds of terabytes of data per hour from
hundreds of thousands of sources” [24]. Users
only need to feed a stream and select a size
of shard as input parameters of the framework.
Enriched data is delivered to Amazon storage
such as S3, DynamoDB or Redshift as options
by Kinesoft applications. Druid is designed
for real-time exploratory queries on sheer-size
data set [25]. This analytic data store solution
advocates streaming single and seldom-changing
data sources into Druids cluster, which then
can be queried by client. Recently, ARM had
announced the mbed Device Server. These
Cloud providers offer DA services to the general
PaaS. In comparison with these suppliers, the
BDAaaS project aims to providing a PaaS Cloud
framework for real-time BDA and digesting IoT
data, which covers the D&C process of software
components on both M2M gateways and Cloud
machines.
On the other hand, several Cloud providers
are targeting specially IoT application domains.
They provide mainly a Messaging-as-a-Service
for IoT message brokering and support principal
IoT protocols such as MQTT, STOMP, CoAP,
M3DA, XMMP, AMQP, etc. which are promoted
by various organizations and vendors including
M2M Alliance, ESTI M2M, OASIS, etc. Most
of them provides specific analytic solutions.
However, those solutions are not portable from
one provider to another.
Interoperability,
portability and hybrid cloud configuration are
seriously compromised. We mention here several
IoT cloud providers as in the cases of Xively,
Axeda, Open.sen.se, thingworx, SKYNET.im,
54
L.M. Pham / VNU Journal of Science: Comp. Science & Com. Eng., Vol. 31, No. 2 (2015) 44–55
ClearBlade, 2lemetry, AirVantage, WSO2 MB,
Eurotech EDC, etc.
A similar scalable cloud-based framework for
Big Data analytics in power grid, validated in a
micro-grid at USC campus, has been proposed by
Simmhan, et al. [26]. This framework provides
a pipeline mechanism to integrate information
from various sources, digest and store them
in static repositories for sharing knowledge.
To purvey agile demand prediction, models of
machine learning are trained over massive set
of data. Although the system is implemented
and orchestrated on hybrid Clouds, the D&C
process on all over the frameworks is performed
manually that is error-prone and time consuming.
Our work proposes a D&C manager to automate
this processes through multiple clouds, including
private, public IaaS and PaaS.
6. Conclusion and Perspectives
This paper demonstrates the BDAaaS project
in the aspects of a novel framework and
its implementation for a smart-grid use case.
The BDAaaS project aims to deliver a selfadaptive cloud-based framework for real-time
BDA. The BDAaaS framework collects and
analyzes data for IoT services using existing
components such as M2M gateways, Message
brokers or Message-as-a-Service providers and
BDA platforms. For the smart-grid use case,
BDAaaS deploys OpenHAB processes for house
gateways, several MQTT brokers and a Storm
topology which analyze the sensor data stream of
the smart-grid application for power prediction.
These experiments validate the soundness and
efficiency of BDAaaS’s framework.
A perspective to the work is the monitoring and
dynamic reconfiguration of the MQTT brokers
and the Storm topology for scalability and
availability. The architecture should be monitored
and reconfigured in order to adjust the number
of Storm nodes according to the load of MQTT
messages sent by the OpenHAB instances. The
scalability of our topology should thus also be
able to cope with the various dataload in order to
guarantee an efficient analysis. Storm provides
variety of metrics that can be used to see if a
certain bolt becomes a bottleneck in the topology,
we can then increase its parallelism. In addition,
if the resources allocated to the Storm topology
are no longer enough, extra resources can be
provisioned on the Cloud.
A second perspective is the experiment of
the BDAaaS PaaS for a smart-city use case
in the context of an university campus 1 . In
this use case, a set of sensor motes collects
environmental data in the university campus
(weather, indoor and outdoor air quality, noise
levels inside university buildings, etc.). The
sensors send the data to an IoT station using
the LoRa communication technology. LoRa 2
enables to send few data at low bitrate and low
power over dozen of kilometres. The data will be
analyzed by the BDAaaS PaaS in order to define
better policies for the campus which is a district
of a city.
References
[1] Forbes, Internet of Things By The Numbers:
Market Estimates And Forecasts, August 2014,
“ />internet-of-things-by-the-numbers-market-estimatesand-forecasts/”
[2] James Manyika et al., ”Big data: The next frontier for
innovation, competition, and productivity,” McKinsey
Global Institute, Tech. rep. May 2011.
[3] Storm, “ visited on August
2015.
[4] Ignacio M. Llorente, Key Challenges in Cloud
Computing to Enable Future Internet of Things,
The 4th EU-Japan Symposium on New Generation
Networks and Future Internet, January 2012,
“ />[5] Gartner says big data creates big jobs: 4.4 million
IT jobs globally to support big data by 2015.
‘ />visited on August 2015.
[6] OpenStack, “ visited on
August 2015.
[7] Microsoft Azure Cloud Platform, “http://www.
windowsazure.com,” visited on August 2015.
[8] Amazon EC2 Cloud Platform, “zon.
com/ec2/,” visited on August 2015.
1
2
/> />
L.M. Pham / VNU Journal of Science: Comp. Science & Com. Eng., Vol. 31, No. 2 (2015) 44–55
[9] Lambda Architecture: A state-of-the-art. “http://www.
datasalt.com/2014/01/lambda-architecture-a-state-ofthe-art/,” visited on August 2015.
[10] Pham, L.M.; Tchana, A.; Donsez, D.; Zurczak,
V.; Gibello, P.-Y.; de Palma, N., ”An adaptable
framework to deploy complex applications onto multicloud platforms,” 2015 IEEE RIVF, pp.169,174, 25-28
Jan. 2015 doi: 10.1109/RIVF.2015.7049894
[11] VMware vSphere, “ />vsphere,” visited on August 2015.
[12] OpenHAB, “,” visited on
August 2015.
[13] Mosquitto, ‘ visited on August
2015.
[14] RabbitMQ, “ visited on
August 2015.
[15] Apache Cassandra, “,”
visited on August 2015.
[16] OSGi Alliance Specifications, “ />Specifications/HomePage,” visited on August 2015.
[17] Patrick Th. Eugster, Pascal A. Felber, Rachid
Guerraoui, and Anne-Marie Kermarrec. 2003.
The many faces of publish/subscribe. ACM
Comput. Surv. 35, 2 (June 2003), 114-131.
DOI=10.1145/857076.857078
55
[18] OSGi Event Admin Service Specification, Version 1.3,
OSGi Alliance Specifications, Chapter 113, pp 295314
[19] MQ Telemetry Transport, “,” visited on
August 2015.
[20] Beaglebone Black, “ />visited on August 2015.
[21] Trident, “ />Trident-tutorial.html,” visited on August 2015.
[22] Talia, D., ”Clouds for Scalable Big Data Analytics,”
Computer , vol.46, no.5, pp.98,101, May 2013, doi:
10.1109/MC.2013.162
[23] SplunkCloud, “ us/products/
splunk-cloud.html,” visited on August 2015.
[24] Amazon Kinesis, “ />visited on August 2015.
[25] Druid, “ visited on August 2015.
[26] Simmhan, Y.; Aman, S.; Kumbhare, A.; Rongyang
Liu; Stevens, S.; Qunzhi Zhou; Prasanna, V.,
”Cloud-Based Software Platform for Big Data
Analytics in Smart Grids,” Computing in Science &
Engineering, vol.15, no.4, pp.38,47, July-Aug. 2013,
doi: 10.1109/MCSE.2013.39


![development with the force.com platform [electronic resource] building business applications in the cloud](https://media.store123doc.com/images/document/14/y/zs/medium_Qs04cLaWf8.jpg)