Performance of anthropometric indicators as predictors of metabolic syndrome in Brazilian adolescents
Bạn đang xem bản rút gọn của tài liệu. Xem và tải ngay bản đầy đủ của tài liệu tại đây (583.4 KB, 9 trang )
Oliveira and Guedes BMC Pediatrics (2018) 18:33
/>
RESEARCH ARTICLE
Open Access
Performance of anthropometric indicators
as predictors of metabolic syndrome in
Brazilian adolescents
Raphael Gonçalves de Oliveira1* and Dartagnan Pinto Guedes2
Abstract
Background: It is not clear which is the best anthropometric indicator to predict metabolic syndrome (MetS) in
adolescents. Our objective was to identify the predictive power, with respective cut-off points, of anthropometric
indicators associated with the quantity and distribution of body fat for the presence of MetS and to determine the
strength of the association between the proposed cut-off points and MetS in adolescents.
Methods: The sample consisted of 1035 adolescents (565 girls and 470 boys) aged between 12 and 20 years. Four
anthropometric indicators were considered: waist circumference (WC), body mass index (BMI), waist-height ratio
(WHtR), and conicity index (C-Index). MetS was defined according to the criteria of the International Diabetes Federation.
Predictive performance was described through analysis of Receiver Operating Characteristic (ROC) curves with a 95%
confidence interval. The most accurate cut-off points were identified through sensitivity, specificity and Area Under the
Curve (AUC) values.
Results: The four anthropometric indicators presented significant AUCs close to 0.70. At younger ages (12-15 years) the
girls presented a statistically greater capacity to discriminate MetS; however, at more advanced ages (16-20 years) both
sexes presented similar AUCs. Among the anthropometric indicators investigated, regardless of sex and age, the WHtR
showed the highest discriminant value for MetS, while the C-Index demonstrated a significantly lower capacity to predict
MetS. The AUCs equivalent to WC and BMI did not differ statistically. The proposed cut-off points for WHtR (12-15 years
= 0.46, 16-20 years = 0.48) presented the highest values of sensitivity and specificity, between 60% and 70%, respectively.
Conclusion: Considering that the best AUC was found for WHtR, we suggest the use of this anthropometric indicator,
with the cut-off points presented herein, for the prediction of MetS in adolescents with characteristics similar to the
study sample.
Keywords: Anthropometry, Obesity, Adiposity, Prediction, Diagnosis, Accuracy
Background
Metabolic syndrome (MetS) refers to a set of risk factors
that, when altered, may increase the chances of developing
cardiovascular diseases and diabetes mellitus [1–3]. The
risk factors include: excess abdominal fat, high blood pressure and triglyceride rates, and altered high density lipoproteins and glycemia [3].
The literature presents strong evidence that cardiometabolic alterations, manifested in adulthood, result from
* Correspondence:
1
Universidade Estadual do Norte do Paraná (UENP), Centro de Ciências da
Saúde. Alameda Padre Magno, 841, Nova Alcântara, Jacarezinho, PR CEP:
86.400-000, Brazil
Full list of author information is available at the end of the article
complex interactions between a variety of risk factors that
may originate in childhood and adolescence [4, 5]. Therefore,
young people who eventually present MetS, with advancing
age, tend to be more predisposed to the onset of cardiovascular disease and diabetes mellitus. Thus, early detection of
the presence of MetS in the young population is defined as
an important primary care strategy that can effectively contribute to the prevention of cardiometabolic outcomes in
adulthood and reduce public health expenditures.
However, as the diagnosis of MetS involves invasive laboratory tests to determine the plasma lipid profile and
glycemic rate, its inclusion on a large scale in the routine
monitoring of the health status of adolescents is complex.
© The Author(s). 2018 Open Access This article is distributed under the terms of the Creative Commons Attribution 4.0
International License ( which permits unrestricted use, distribution, and
reproduction in any medium, provided you give appropriate credit to the original author(s) and the source, provide a link to
the Creative Commons license, and indicate if changes were made. The Creative Commons Public Domain Dedication waiver
( applies to the data made available in this article, unless otherwise stated.
Oliveira and Guedes BMC Pediatrics (2018) 18:33
In this sense, efforts have been directed in the attempt to
indicate more affordable and inexpensive alternatives for
epidemiological tracking and, thus, direct specific procedures to those at risk of developing MetS [6–10].
Results found in previous studies suggest that excess
body fat is characterized as an important contributor to
triggering MetS in the pediatric population [11–13]. In
this context, several anthropometric indicators have been
proposed to make inferences about body fat profiles. In
epidemiological surveys, the body mass index (BMI) is the
most widely used anthropometric indicator and offers indications related to the total quantity of body fat [14]. In
addition, waist circumference (WC), waist-height ratio
(WHtR), and the conicity index (C-Index) have been proposed and successfully tested to measure cardiometabolic
risk in young people due to their ability to provide estimates of centripetal concentration of body fat [15, 16].
Considering that the anthropometric indicators associated with the quantity and distribution of body fat are easy
to handle, are not invasive and have low cost, it is important to identify the predictive power of each anthropometric indicator and its respective cut-off points for detection
of MetS in young population. However, it should be
pointed out that this referral does not seek to replace
medical intervention, since it does not exclude the need to
identify the individual components to confirm the diagnosis of MetS. Screening, when performed in environments
with high concentrations of young people, such as schools,
can reach a high number of adolescents, especially those
who have difficulty accessing or do not attend the health
system. Thus, once the adolescents most likely to present
MetS have been identified, they can be referred for specialized medical follow-up.
Some studies have evaluated the predictive capacity of
anthropometric indicators to detect MetS; however, conflicting data were found. Kelishadi et al. [6] found WC to
be the best predictor, followed by BMI and WHtR. In contrast, in the study by Jung et al. [7] BMI was the best predictor, followed by WC and WHtR. Nambiar et al. [8]
found WHtR to be a better predictor compared to BMI,
while WC did not demonstrate significant predictive capacity. Benmohammed et al. [9] found better predictive
capacity for WHtR, followed by WC and BMI.
In addition to the divergences found among the results
of the studies, it is noteworthy that the C-Index has not
been tested for its predictive ability to detect MetS in
adolescence. In adults the C-Index presented superior
performance to other anthropometric indicators to predict cardiovascular risk [17].
Therefore, the objectives of the present study were to
identify the predictive power, with respective cut-off
points, of four anthropometric indicators associated with
the quantity and distribution of body fat (WC, BMI,
WHtR, and C-Index) for the presence of MetS and to
Page 2 of 9
determine the strength of the association between the
proposed cut-off points and MetS in adolescents.
Methods
The study is linked to a larger project, which aimed to
identify the prevalence of MetS and associated factors in
adolescents. For this, a descriptive cross-sectional survey
was carried out with a population base involving schoolchildren from the city of Jacarezinho, Paraná, Brazil. Data
collection extended from August to November 2014. The
intervention protocols used followed the Declaration of
Helsinki and were approved by the Research Ethics
Committee of the Universidade Norte do Paraná – UNOPAR (Opinion 1.302.963).
Sample and selection of subjects
The reference population included adolescents of both
sexes, between 12 and 20 years of age, enrolled in public
and private elementary schools (6th to 9th grade) and
high school (1st to 3rd grade). Initially, the sample size
was established to meet the primary objective of the project to identify the prevalence of MetS and associated
factors, assuming a 95% confidence interval, a sampling
error of 3 percentage points, and an increase of 10% to
allow for eventual lost cases during data collection. In
addition, considering that the sample planning involved
conglomerates, we defined the effect of the sample design (deff ) as equivalent to 1.5, estimating, therefore, a
minimum sample of 1000 adolescents in school. However, the final sample used in the treatment of information was composed of 1035 adolescents (565 girls and
470 boys). In the present study, the statistical power of
the sample, stratified by sex (565 girls and 470 boys),
was calculated a posteriori and enabled identification
with 80% power, a significance of 5%, and areas under
the ROC (Receiver Operating Characteristic) curve of at
least 0.53 and 0.56 for girls and boys, respectively.
Regarding the selection of the subjects, we aimed to
obtain probabilistic sampling by clusters, having as a reference gender, year of study, and period in which the adolescents were enrolled in each stratum of the school
structure (public and private). The criteria adopted to
exclude some adolescents drawn for the study were: (a)
refusal to participate in the study; (b) not signing the
Free and Informed Consent Form; (c) any health problem that temporarily or permanently prevented participation in the study; (d) using any type of medication
that could induce changes in the study variables; (e)
undergoing any type of specific diet; (f ) pregnancy; and
(g) non-attendance at school on the day scheduled to
begin data collection. In these cases, a new draw was
carried out to restore any sample losses.
Oliveira and Guedes BMC Pediatrics (2018) 18:33
Anthropometric indicators
In order to determine the body weight measurements,
an anthropometric scale with a 10 g definition was used,
brand SECA (Berlin, Germany), model 813, checked
every ten weighings, while to carry out the height measurements an aluminum stadiometer was used with a
1 mm scale, brand SECA (Berlin, Germany), model 213.
The WC measurements were performed using a flexible
anthropometric inelastic fiberglass tape with a 1 mm
scale, brand SECA (Berlin, Germany), model 203.
Measurements of body weight, height, and WC were
performed according to the recommendations of the
World Health Organization [18]. Each previously trained
researcher performed the same function during the data
collection period in order to minimize possible measurement errors. To measure body weight, the adolescent,
barefoot and wearing minimal clothing, was positioned
standing in the center of the scale platform, upright,
with arms beside the body and looking at a fixed point
in front of them.
For the height measurements, the adolescent, barefoot,
was placed on the base of the stadiometer, upright, with
the upper limbs hanging beside the body, feet together,
trying to maintain the posterior surfaces of the heels,
pelvic girdle, shoulder girdle, and occipital region in
contact with the measurement scale. The distance between the plantar region and the vertex was determined
with the aid of a cursor. The adolescent remained in inspiratory apnea and their head was oriented in the
Frankfurt plane parallel to the ground.
WC measurements were determined with the adolescent standing, with a relaxed abdomen and arms beside
the body. The anthropometric tape was positioned in
the horizontal plane, so as to encircle the natural waist
line, at the coincident point of the mean distance between the last costal arch and the iliac crest, in a firm
manner; however, without skin compression. The reading was obtained at the end of a normal expiration.
The BMI was calculated through the ratio between the
body weight measured in kilograms and the height
expressed in meters squared (kg/m2). The WHtR was
obtained by dividing the waist circumference measure by
the height in centimeters [19]. The C-Index was defined
by the equation [20]:
Conicity index ðC–IndexÞ ¼
waist circumference ðmÞ
sffiffiffiffiffiffiffiffiffiffiffiffiffiffiffiffiffiffiffiffiffiffiffiffiffiffiffiffiffiffiffiffiffiffiffiffiffiffiffiffi
body weight ðKg Þ
0:109
height ðmÞ
Metabolic syndrome
MetS was identified by analyzing the blood content of
plasmatic lipids (triglycerides and high density lipoproteins - HDL-cholesterol) and blood glucose, resting
Page 3 of 9
blood pressure (systolic and diastolic), and abdominal fat
accumulation (waist circumference), according to the
criteria proposed by the International Diabetes Federation (IDF) [4]. In this case, MetS is defined by the presence of a high waist circumference (< 16 years: both
sexes ≥ Percentile 90, ≥ 16 years: boys ≥ 90 cm and girls
≥ 80 cm) and at least two other compromised components: increased triglycerides (≥ 150 mg/dL), decreased
HDL-cholesterol (< 16 years: both sexes < 40 mg/dL,
≥ 16 years: boys < 40 mg/dL and girls < 50 mg/dL),
high fasting blood glucose (≥ 100 mg/dL), and altered
blood pressure (systolic ≥ 130 mmHg or diastolic ≥
85 mmHg).
Plasmatic lipid and blood glucose measurements were
performed by collecting 10 ml venous blood samples at
the elbow crease after a 10-12 h fasting period between
07:00 and 08:00 a.m. The serum was immediately separated by centrifugation, and the HDL-cholesterol dosages were determined by the precipitating reactive
method, serum triglycerides by the enzymatic glycerol
method, and glycemia by the calorimetric enzymatic
methodology.
The systolic and diastolic arterial blood pressure levels
were measured by the auscultatory method using a mercury column sphygmomanometer. With the adolescent
sitting, after a minimum of 5 min of rest, blood pressure
was measured in the left arm. The systolic blood pressure value corresponded to Korotkoff phase I and diastolic blood pressure to phase V, or the disappearance of
sounds. Two measures were taken, considering the mean
value of both measures for calculation purposes.
Statistical treatment
Statistical analysis was performed using SPSS software,
version 22. For the analysis of continuous variables, procedures of descriptive statistics were used (mean ± standard deviation). As the treated variables presented normal
distribution of data, the comparisons between sex (girls
and boys) and age (12 to 15 years and 16 to 20 years) for
the anthropometric indicators were performed using
two-way analysis of variance with interaction, accompanied by the Scheffe multiple comparison test.
The predictive capacity, sensitivity, and specificity of
the four anthropometric indicators (WC, BMI, WHtR,
and C-Index) to identify the presence of MetS, accompanied by the respective 95% confidence intervals, were
defined using the ROC curve, to establish cut-off points
in diagnostic or screening tests [21]. The Area Under
the ROC Curve (AUC) was used specifically to determine the predictive capacity of the anthropometric indicators. In this case, an AUC = 1 indicates perfect
predictive power, while AUC ≤ 0.5 indicates that predictive power is not better than chance. For purposes of interpretation, the confidence interval equivalent to AUC
Oliveira and Guedes BMC Pediatrics (2018) 18:33
Page 4 of 9
allows determination of whether the predictive ability of
the anthropometric indicator is significant, and therefore, its lower limit should not be less than 0.50. The
complexity of the sample was considered in order to estimate the parameters.
Cut-off points for each anthropometric indicator capable of predicting MetS were determined by the best balance between sensitivity and specificity. Thus, the main
objective of the analysis is to determine the value at
which sensitivity and specificity indicate a threshold that
maximizes the true-positive rate, maintaining the lowest
possible rate of false-positive cases. Possible significant
differences between the properties of sensitivity, specificity, and AUCs were identified using McNemar’s statistical test [22].
After determination of the cut-off points for each of
the predictive anthropometric indicators of MetS, they
were dichotomized based on their respective reference
values. The prevalence ratios accompanied by the respective 95% confidence intervals, stratified by sex and
age, were calculated using Poisson regression.
Results
Sample characteristics
Statistical information equivalent to the anthropometric
indicators that characterize the sample selected for the
study are provided in Table 1. The boys were statistically
heavier and taller than the girls. When comparing the
mean values for the anthropometric indicators that reflect the body fat distribution pattern (WC, WHtR, and
C-Index), the older boys and adolescents presented significantly higher scores. Regarding BMI, the scores
found showed a significant increase with advancing age;
although similar in both sexes. The presence of MetS
was identified in 4.5% of the sample, being significantly
higher in boys (5.2% versus 3.9%) and older adolescents
(4.9% versus 4.2%). According to the diagnostic criteria
based on BMI proposed by International Obesity Task
Force [23], the excess body weight (overweight and obesity) was identified in 21,3% of the sample, showing no
significant difference between girls and boys (22.2% and
20.3%, respectively), but significantly higher in older adolescents (19.4% versus 23.2%).
Anthropometric and MetS indicators
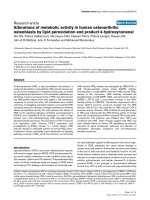
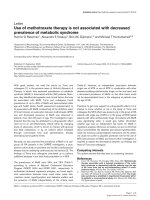
The performance of the anthropometric indicators as
predictors of MetS is presented in Table 2 and Fig. 1.
The values of sensitivity and specificity with the most
appropriate balance between them are presented for the
four anthropometric indicators as discriminators of
MetS. It was noted that, regardless of sex and age,
WHtR demonstrated better sensitivity and specificity to
discriminate MetS. However, the four anthropometric
indicators presented significant AUCs, close to 0.70. At
younger ages (12-15 years) girls presented a statistically
larger ability to discriminate MetS; however, at more advanced ages (16-20 years) both sexes presented similar
AUCs. Among the anthropometric indicators investigated, the C-Index presented significantly lower MetS
prediction capacity, whereas WHtR presented the highest discriminant value for MetS. The AUCs equivalent to
WC and BMI did not differ statistically.
After determination of the cut-off points, the strength
of the association between each of the anthropometric
indicators and the presence of MetS was verified. The
prevalence ratios and their respective confidence intervals are presented in Table 3. The four anthropometric
indicators investigated presented significant and positive
Table 1 Mean, standard deviation, and F statistic values for anthropometric measurements and indicators associated with excess
weight/body fat
Age
Height (cm)
Body weight (kg)
Waist circumference (cm)
Body mass index (kg/m2)
Waist/Height ratio
Conicity index
ns not significant
F test
12–15 Years
16–20 Years
Sex
Age
Interaction
Girls
158.19 ± 8.52
162.21 ± 5.26
40.110
31.224
19.625
Boys
163.50 ± 9.01
173.69 ± 6.89
p < 0.001
p < 0.001
p < 0.001
Girls
53.49 ± 12.37
59.44 ± 14.56
37.437
28.575
20.717
Boys
57.80 ± 11.91
69.27 ± 14.40
p < 0.001
p < 0.001
p < 0.001
Girls
67.82 ± 8.94
71.85 ± 9.19
23.608
9.910
0.672
Boys
72.09 ± 9.14
77.80 ± 9.98
p < 0.001
p < 0.001
ns
Girls
20.27 ± 4.27
22.32 ± 4.23
1.645
5.635
0.579
Boys
20.63 ± 4.07
23.38 ± 4.07
ns
p = 0.004
ns
Girls
0.42 ± 0.05
0.44 ± 0.08
4.912
5.862
2.374
Boys
0.43 ± 0.03
0.46 ± 0.06
p = 0.022
p = 0.001
ns
Girls
1.07 ± 0.04
1.10 ± 0.08
8.092
6.735
3.214
Boys
1.11 ± 0.06
1.13 ± 0.06
p < 0.001
p < 0.001
p = 0.041
Oliveira and Guedes BMC Pediatrics (2018) 18:33
Page 5 of 9
Table 2 Performance of anthropometric indicators as predictors of metabolic syndrome
Sensitivity (CI95%)
12–15 years
Specificity (CI95%)
Area under the curve (CI95%)
16–20 years
12–15 years
16–20 years
12–15 years
16–20 years
Waist circumference
Girls
61.2 (55.1–67.5)
66.7 (59.9–73.9)
62.1 (56.7–67.7)
67.2 (61.1–73.6)
0.70 (0.66–0.75)
0.73 (0.68–0.78)
Boys
57.4 (51.9–63.2)
62.5 (56.4–68.3)
57.9 (53.0–63.1)
63.2 (56.9–69.5)
0.66 (0.61–0.72)
0.71 (0.66–0.77)
χ Test
1.984 (ns)
2.663 (ns)
2.486 (ns)
2.495 (ns)
4.183 (p = 0.032)
2.137 (ns)
2
Body mass index
Girls
62.9 (57.0–68.9)
67.8 (61.5–74.3)
62.3 (57.2–67.5)
67.4 (61.4–73.6)
0.71 (0.67–0.76)
0.73 (0.67–0.79)
Boys
58.8 (53.1–64.7)
63.1 (57.2–69.2)
59.3 (53.8–64.9)
64.2 (59.1–69.4)
0.67 (0.62–0.73)
0.72 (0.67–0.78)
χ Test
2.417 (ns)
5.011 (p = 0.043)
1.438 (ns)
1.612 (ns)
4.258 (p = 0.028)
1.738 (ns)
2
Waist/Height ratio
Girls
65.9 (59.7–72.3)
69.7 (63.4–76.2)
66.2 (60.5–72.0)
70.1 (64.2–76.2)
0.73 (0.68–0.79)
0.76 (0.71–0.82)
Boys
60.7 (54.8–66.8)
64.5 (58.6–70.6)
61.1 (55.9–66.5)
65.3 (60.4–70.4)
0.69 (0.65–0.74)
0.74 (0.70–0.79)
χ Test
5.846 (p = 0.015)
6.101 (p < 0.001)
5.312 (p = 0.031)
5.152 (p = 0.044)
4.496 (p = 0.018)
2.471 (ns)
Girls
60.2 (54.4–66.2)
62.6 (56.7–68.6)
60.4 (55.7–65.3)
64.1 (59.9–68.5)
0.68 (0.64–0.72)
0.71 (0.67–0.76)
Boys
55.6 (49.8–61.5)
58.4 (52.9–64.1)
55.8 (50.3–61.2)
60.0 (59.1–64.2)
0.64 (0.60–0.69)
0.68 (0.63–0.73)
χ Test
4.973 (p = 0.047)
2.542 (ns)
4.814 (p = 0.049)
2.531 (ns)
3.879 (p = 0.042)
2.989 (ns)
2
Conicity index
2
ns not significant, CI 95% confidence interval of 95%
associations with MetS. The boys who presented WC
and BMI scores higher than the cut-off points defined in
the present study were approximately one-and-a-half to
two times more likely to present MetS, while girls, under
these same conditions, were around two to three times
more likely to present MetS. Specifically in the case of
WHtR, boys and girls with scores higher than the cut-off
points found herein presented probabilities two and
three times greater, respectively, of presenting MetS.
Discussion
The present study investigated the ability of anthropometric indicators associated with the quantity and distribution of body fat to discriminate the presence of MetS
in adolescents. The ability of the four anthropometric indicators to predict MetS in adolescents aged 12 to
20 years of both sexes was confirmed. However, when
comparing the AUCs found for each of the anthropometric indicators, significant differences were identified,
indicating different accuracy. The anthropometric indicator that showed the highest predictive capacity for
MetS was WHtR, followed, in this order, by BMI, WC,
and C-Index.
It is not uncommon to find higher scores equivalent to
anthropometric indicators associated with quantity (BMI)
and centripetal body fat distribution (WC, WHtR, and CIndex) in boys and older adolescents [6, 9, 10, 24]. With
advancing age, adolescents become more susceptible to
the endocrine effects triggered by pubertal development,
which impact differently and significantly on the greater
accumulation and pattern of body fat distribution [25, 26].
Corroborating with findings made available through a
systematic review that synthesized data from approximately 100 surveys conducted in different regions of the
world [27], the present study identified a higher prevalence of MetS in boys and older adolescents. Using the
same diagnostic criteria (IDF), the MetS prevalence
observed was higher than that found recently in the
Brazilian young population (4.5% vs 2.6%); however,
close to that found in cities in the same geographic
region (4,1%) [28]. When compared with international
data, the proportion observed in the present study is
lower than that reported in North American and
European adolescents; however, higher than that found
in adolescents from Asian countries [29]. On this note,
it is emphasized that the IDF diagnostic criterion is
intended to minimize false-positive cases and therefore,
presents more conservative cut-off points, as well as
considering WC as a mandatory component to identify
MetS. Therefore, when compared to other diagnostic
criteria adapted for use in adolescents, the IDF criterion
should indicate a lower prevalence of MetS [30].
In the present study, with identical cut-off points for
both sexes, although different for adolescents aged 1215 years (0.46) and 16-20 years (0.48), the WHtR was
indicated as the anthropometric indicator that best
discriminates the presence of MetS. Both cut-off points
indicated sensitivity and specificity values between 60%
and 70%, which moderately minimizes false-positive and
Oliveira and Guedes BMC Pediatrics (2018) 18:33
Page 6 of 9
Fig. 1 ROC plots for the predictions of metabolic syndrome by anthropometric indicators: waist-height ratio (WHtR), waist circumference (WC),
body mass index (BMI), and conicity index (C-Index)
Table 3 Cut-off points with higher accuracy and prevalence
ratios between anthropometric indicators and metabolic
syndrome in adolescents
Cut-off points
12–15 years
Prevalence ratio (CI95%)
16–20 years
12–15 years
16–20 years
Waist circumference
Girls
75.8
78.1
2.38 (1.87–3.11)
2.61 (1.88–3.58)
Boys
77.2
83.3
1.41 (1.13–1.80)
1.56 (1.20–1.99)
Body mass index
Girls
21.4
23.1
2.89 (2.07–4.21)
3.02 (2.03–4.46)
Boys
21.5
23.9
1.52 (1.25–1.89)
1.79 (1.43–2.23)
Waist/Height ratio
Girls
0.46
0.48
3.13 (2.09–4.30)
3.51 (2.43–4.79)
Boys
0.46
0.48
1.79 (1.27–2.50)
2.06 (1.42–2.95)
Conicity index
Girls
1.13
1.16
1.72 (1.18–2.53)
2.18 (1.42–3.11)
Boys
1.16
1.20
1.29 (1.07–1.61)
1.42 (1.17–1.78)
CI 95% confidence interval of 95%
false-negative cases. However, a very uncommon way of
analyzing the diagnostic capacity of specific cut-off points
is by calculating the positive (PLR) and negative (NLR)
likelihood ratios. In the case of the youngest group (1215 years), the PLR was equivalent to 1.95 in girls and 1.86
in boys, suggesting that those adolescents with WHtR
≥0.46 may present approximately twice the chance of a
positive diagnosis being true; while the NLR corresponded
to 0.52 and 0.48, respectively, which is also close to twice
the chance of a negative diagnosis confirming the absence
of MetS. Among the older adolescents (16-20 years), The
PLR was equivalent to 2.33 and 1.86, while the NLR corresponded to 0.43 and 0.54 for girls and boys, respectively.
The study by Benmohammed et al. [9] using the IDF
criteria for diagnosis of MetS in Algerian adolescents
also found a better predictive capacity through the use
of WHtR. However, it is noteworthy that, regardless of
the anthropometric indicator used (WHtR, WC, or
BMI), a high accuracy was identified (AUC ≥ 90), with all
cut-off points indicating maximum sensitivity (100%)
and specificity, around 75%.
Oliveira and Guedes BMC Pediatrics (2018) 18:33
On the other hand, coinciding with the findings of the
present study, other investigations have found predictive
capacity for MetS through anthropometric indicators associated with the quantity and distribution of body fat.
Jung et al. [7], also using the IDF criteria to diagnose
MetS in German adolescents, observed moderate to high
accuracy (0.83 ≥ AUC ≤ 0.88) for the anthropometric indicators investigated, with an advantage for BMI
followed by WC and WHtR. However, as a limitation,
the sample involved few adolescents and only boys.
Kelishadi et al. [6] using a less rigorous diagnostic criteria to diagnose MetS in adolescents (de Ferranti criteria), also found a moderate to high predictive capacity
(0.72 ≥ AUC ≤ 0.89) for the anthropometric indicators
considered; however, to the advantage of WC, followed
by BMI and WHtR.
The disagreements between the studies that have been
carried out regarding the anthropometric indicator with
better predictive performance for MetS may perhaps be
justified by the ethnic origin of the adolescents selected
in the different studies. In this regard, the ethnicity of
adolescents is capable of influencing the definition of the
cut-off points of the anthropometric indicators associated with overweight and body fat and the individual
components that make up MetS, which could impact on
their prevalence [4]. Thus, identification of the most appropriate anthropometric indicator and its respective
cut-off points capable of predicting a higher risk for
MetS may be dependent on the geographical location in
which the study is performed. In addition, it should be
taken into account that MetS can affect adolescents for
reasons other than just excess fat and body weight. MetS
may be caused by behavioral issues such as inadequate
eating habits, excessive sedentary time, and physical inactivity [31].
Referring specifically to the cut-off points best able to
predict MetS through the WHtR, a systematic review
aimed at analyzing the potential of anthropometric indicators to predict cardiovascular disease indicated WHtR
≥0.50 as the most appropriate for both sexes [32]. This
cut-off point is higher than those found in the present
study; however, the systematic review composed, mostly,
data involving adults, which may explain the higher cutoff point; especially when compared to younger adolescents. In the Italian pediatric population, high sensitivity
and specificity for WHtR ≥0.50 were demonstrated in
the detection of at least two metabolic or cardiovascular
risk factors; however, it was not the purpose of the study
to propose and test another cut-off point value [33].
Using the cut-off points defined in the present study
the four anthropometric indicators investigated were significantly associated with the presence of MetS. However, we highlight the higher probability of identifying
MetS in girls than in boys. Girls with WHtR ≥ 0.46 (12-
Page 7 of 9
15 years) and WHtR ≥ 0.48 (16-20 years) demonstrated
probabilities around three to three and a half times
higher for MetS, while boys with WHtR scores above
cut-off points were approximately twice as likely to
present MetS. Previous studies have also found greater
accuracy to identify MetS by means of anthropometric
indicators among girls [6, 9]; however, it is still unclear
whether this finding should be attributed to the specific
metabolic profile of each sex, or the behavioral implications that differentiate girls and boys at this age.
Strengths and limitations
To our knowledge this is the first study performed with
Brazilian adolescents to verify the performance of different anthropometric indicators associated with the quantity and distribution of body fat as predictors of MetS.
Identifying MetS in pediatric populations is not routine
in the clinical setting, except in specific situations, such
as the presence of obesity and diabetes. In addition, the
decrease in the frequency of medical consultations during adolescence reduce the possibility of early detection
of metabolic alterations, and the lack of diagnosis, control, and treatment of these alterations may constitute a
factor impeding the prevention of future cardiometabolic
outcomes. The findings of the present study will enable,
by means of simple and accessible procedures, the
screening of the possible presence of MetS and, when
appropriate, referral to a specialized service to confirm
the diagnosis.
On the other hand, the present study presents some
limitations that must be considered. School-based sampling may weaken the representativeness of the adolescent population. However, it should be emphasized that
adolescents from all the city’s educational networks were
distributed proportionally in the schools selected for the
study. Even taking into account the low refusal rate
for anthropometric measurements and laboratory tests
(≈ 8%), the possibility of selection bias cannot be
ruled out, since it was not possible to compare the
treated indicators between the adolescents participating
and not participating in the study. It is also important to
note that, since there is no universal criterion for defining
MetS, we chose to use the criterion proposed by the IDF
and, in this sense, estimates of the prevalence of MetS
may vary according to the criterion used.
Conclusions
The four anthropometric indicators investigated demonstrated ability to predict MetS in adolescents aged
12 to 20 years of both sexes. However, considering
that the best AUC was found for the WHtR, we suggest the use of this anthropometric indicator, with the
cut-off points presented herein, for the prediction of
MetS in adolescents with similar characteristics to the
Oliveira and Guedes BMC Pediatrics (2018) 18:33
study sample. In this sense, it is assumed that
approximately three out of four adolescents with
MetS can be correctly diagnosed, constituting, therefore, a reasonable alternative to be used in initial
screening to identify adolescents at higher cardiometabolic risk.
Page 8 of 9
4.
5.
Abbreviations
AUC: Area Under the Curve; BMI: Body mass index; C-Index: Conicity index;
IDF: International Diabetes Federation; MetS: Metabolic syndrome;
NLR: Negative likelihood ratio; PLR: Positive likelihood ratio; ROC: Receiver
Operating Characteristic; WC: Waist circumference; WHtR: Waist-height ratio
6.
Acknowledgements
The authors thank the technicians who assisted in the data collection. The
author RGO thanks the doctorate scholarship provided by the Fundação
Araucária (FA) for Support of Scientific and Technological Development of
Paraná, and the Secretaria de Estado da Ciência, Tecnologia e Ensino
Superior do Paraná (SETI), in partnership with the Coordenação de
Aperfeiçoamento de Pessoal de Nível Superior (CAPES), Brazil.
8.
Funding
No funding.
Availability of data and materials
All data generated or analysed during this study are included in this
published article. Any additional data may be requested directly from the
study authors.
Authors’ contributions
RGO and DPG conceptualised the study and were involved in data collection
and analysis. Both authors were involved in the writing of the manuscript
and approved the final version.
Ethics approval and consent to participate
The intervention protocols used followed the Declaration of Helsinki and
were approved by the Research Ethics Committee of the Universidade Norte
do Paraná – UNOPAR (Opinion 1.302.963). Written informed consent to
participate in the study was obtained from the participants (or their parent
or guardian in the case of adolescents under 18 years).
7.
9.
10.
11.
12.
13.
14.
15.
16.
17.
Consent for publication
Not applicable.
Competing interests
The authors declare that they have no competing interests.
18.
19.
Publisher’s Note
Springer Nature remains neutral with regard to jurisdictional claims in
published maps and institutional affiliations.
20.
Author details
1
Universidade Estadual do Norte do Paraná (UENP), Centro de Ciências da
Saúde. Alameda Padre Magno, 841, Nova Alcântara, Jacarezinho, PR CEP:
86.400-000, Brazil. 2Universidade Norte do Paraná (UNOPAR), Centro de
Pesquisa em Ciências da Saúde. Rua Marselha, 591, Bairro Piza, CEP:
86.041-140 Londrina, PR, Brasil.
21.
22.
23.
Received: 23 February 2017 Accepted: 29 January 2018
24.
References
1. Lam DW, LeRoith D. Metabolic syndrome. South Dartmouth: MDText.com,
Inc.; 2015.
2. Kaur J. A comprehensive review on metabolic syndrome. Cardiol Res Pract.
2014;2014:943162.
3. Alberti KG, Eckel RH, Grundy SM, Zimmet PZ, Cleeman JI, Donato KA, et al.
Harmonizing the metabolic syndrome: a joint interim statement of the
International Diabetes Federation Task Force on Epidemiology and
25.
26.
Prevention; National Heart, Lung, and Blood Institute; American Heart
Association; World Heart Federation; International Atherosclerosis Society;
and International Association for the Study of Obesity. Circulation. 2009;120:
1640–5.
Zimmet P, Alberti KG, Kaufman F, Tajima N, Silink M, Arslanian S, et al. The
metabolic syndrome in children and adolescents - an IDF consensus report.
Pediatr Diabetes. 2007;8:299–306.
Poyrazoglu S, Bas F, Darendeliler F. Metabolic syndrome in young people.
Curr Opin Endocrinol Diabetes Obes. 2014;21:56–63.
Kelishadi R, Ardalan G, Gheiratmand R, Adeli K, Delavari A, Majdzadeh R, et
al. Paediatric metabolic syndrome and associated anthropometric indices:
the CASPIAN Study. Acta Paediatr. 2006;95:1625–34.
Jung C, Fischer N, Fritzenwanger M, Figulla HR. Anthropometric indices as
predictors of the metabolic syndrome and its components in adolescents.
Pediatr Int. 2010;52:402–9.
Nambiar S, Truby H, Davies PS, Baxter K. Use of the waist-height ratio to
predict metabolic syndrome in obese children and adolescents. J Paediatr
Child Health. 2013;49:E281–7.
Benmohammed K, Valensi P, Benlatreche M, Nguyen MT, Benmohammed F,
Pariès J, et al. Anthropometric markers for detection of the metabolic
syndrome in adolescents. Diabetes Metab. 2015;41:138–44.
Flouris AD, Bouziotas C, Christodoulos AD, Koutedakis Y. Longitudinal
preventive-screening cutoffs for metabolic syndrome in adolescents. Int J
Obes. 2008;32:1506–12.
González M, del Mar BM, Pons A, Llompart I, Tur JA. Inflammatory markers and
metabolic syndrome among adolescents. Eur J Clin Nutr. 2012;66:1141–5.
Gøbel RJ, Jensen SM, Frøkiaer H, Mølgaard C, Michaelsen KF. Obesity,
inflammation and metabolic syndrome in Danish adolescents. Acta Paediatr.
2012;101:192–200.
Melka MG, Abrahamowicz M, Leonard GT, Perron M, Richer L, Veillette S, et
al. Clustering of the metabolic syndrome components in adolescence: role
of visceral fat. PLoS One. 2013;8:e82368.
Freedman DS, Ogden CL, Blanck HM, Borrud LG, Dietz WH. The abilities of
body mass index and skinfold thicknesses to identify children with low or
elevated levels of dual-energy X-ray absorptiometry-determined body
fatness. J Pediatr. 2013;163:160–6.
Beck CC, Lopes Ada S, Pitanga FJ. Anthropometric indicators as predictors
of high blood pressure in adolescents. Arq Bras Cardiol. 2011;96:126–33.
Carneiro IB, Sampaio HA, Carioca AA, Pinto FJ, Damasceno NR. Old and new
anthropometric indices as insulin resistance predictors in adolescents. Arq
Bras Endocrinol Metabol. 2014;58:838–43.
Motamed N, Perumal D, Zamani F, Ashrafi H, Haghjoo M, Saeedian FS, et al.
Conicity index and waist-to-hip ratio are superior obesity indices in
predicting 10-year cardiovascular risk among men and women. Clin Cardiol.
2015;38:527–34.
World Health Organization. Physical status: the use and interpretation of
anthropometry. Report of a WHO expert committee, Technical report series.
Geneva: WHO; 1995.
Ashwell M, Hsieh SD. Six reasons why the waist-to-height ratio is a rapid
and effective global indicator for health risks of obesity and how its use
could simplify the international public health message on obesity. Int J
Food Sci Nutr. 2005;56:303–7.
Valdez R. A simple model-based index of abdominal adiposity. J Clin
Epidemiol. 1991;44:955–6.
Akobeng AK. Understanding diagnostic tests 3: receiver operating
characteristic curves. Acta Paediatr. 2007;96:644–7.
Trajman A, Luiz RR. McNemar chi2 test revisited: comparing sensitivity and
specificity of diagnostic examinations. Scand J Clin Lab Invest. 2008;68:77–80.
Cole TJ, Bellizzi MC, Flegal KM, Dietz WH. Establishing a standard definition
for child overweight and obesity worldwide: international survey. BMJ. 2000;
320:1240–3.
Laurson KR, Eisenmann JC, Welk GJ. Development of youth percent body
fat standards using receiver operating characteristic curves. Am J Prev Med.
2011;41:S93–9.
Chan NP, Choi KC, Nelson EA, Chan JC, Kong AP. Associations of pubertal
stage and body mass index with cardiometabolic risk in Hong Kong
Chinese children: a cross-sectional study. BMC Pediatr. 2015;15:136.
Gyllenhammer LE, Alderete TL, Toledo-Corral CM, Weigensberg M, Goran MI.
Saturation of subcutaneous adipose tissue expansion and accumulation of
ectopic fat associated with metabolic dysfunction during late and postpubertal growth. Int J Obes. 2016;40:601–6.
Oliveira and Guedes BMC Pediatrics (2018) 18:33
Page 9 of 9
27. Friend A, Craig L, Turner S. The prevalence of metabolic syndrome in
children: a systematic review of the literature. Metab Syndr Relat Disord.
2013;11:71–80.
28. Kuschnir MC, Bloch KV, Szklo M, Klein CH, Barufaldi LA, Abreu Gde A, et al.
ERICA: prevalence of metabolic syndrome in Brazilian adolescents. Rev
Saude Publica. 2016;50(Suppl 1):11s.
29. Tailor AM, Peeters PH, Norat T, Vineis P, Romaguera D. An update on the
prevalence of the metabolic syndrome in children and adolescents. Int J
Pediatr Obes. 2010;5:202–13.
30. Agudelo GM, Bedoya G, Estrada A, Patiño FA, Muñoz AM, Velásquez CM.
Variations in the prevalence of metabolic syndrome in adolescents
according to different criteria used for diagnosis: which definition should be
chosen for this age group? Metab Syndr Relat Disord. 2014;12:202–9.
31. Olafsdottir AS, Torfadottir JE, Arngrimsson SA. Health behavior and
metabolic risk factors associated with normal weight obesity in adolescents.
PLoS One. 2016;11:e0161451.
32. Browning LM, Hsieh SD, Ashwell M. A systematic review of waist-to-height
ratio as a screening tool for the prediction of cardiovascular disease and
diabetes: 0.5 could be a suitable global boundary value. Nutr Res Rev. 2010;
23:247–69.
33. Maffeis C, Banzato C, Talamini G, Obesity Study Group of the Italian Society
of Pediatric Endocrinology and Diabetology. Waist-to-height ratio, a useful
index to identify high metabolic risk in overweight children. J Pediatr. 2008;
152:207–13.
Submit your next manuscript to BioMed Central
and we will help you at every step:
• We accept pre-submission inquiries
• Our selector tool helps you to find the most relevant journal
• We provide round the clock customer support
• Convenient online submission
• Thorough peer review
• Inclusion in PubMed and all major indexing services
• Maximum visibility for your research
Submit your manuscript at
www.biomedcentral.com/submit