Development and validation of a diagnostic model for early differentiation of sepsis and non-infectious SIRS in critically ill children - a data-driven approach using machinelearning
Bạn đang xem bản rút gọn của tài liệu. Xem và tải ngay bản đầy đủ của tài liệu tại đây (606.45 KB, 11 trang )
Lamping et al. BMC Pediatrics (2018) 18:112
/>
RESEARCH ARTICLE
Open Access
Development and validation of a diagnostic
model for early differentiation of sepsis and
non-infectious SIRS in critically ill children a data-driven approach using machinelearning algorithms
Florian Lamping1,2,3, Thomas Jack2, Nicole Rübsamen1, Michael Sasse2, Philipp Beerbaum2, Rafael T. Mikolajczyk1,3,
Martin Boehne2† and André Karch1,3*†
Abstract
Background: Since early antimicrobial therapy is mandatory in septic patients, immediate diagnosis and distinction
from non-infectious SIRS is essential but hampered by the similarity of symptoms between both entities. We aimed
to develop a diagnostic model for differentiation of sepsis and non-infectious SIRS in critically ill children based on
routinely available parameters (baseline characteristics, clinical/laboratory parameters, technical/medical support).
Methods: This is a secondary analysis of a randomized controlled trial conducted at a German tertiary-care
pediatric intensive care unit (PICU). Two hundred thirty-eight cases of non-infectious SIRS and 58 cases of sepsis (as
defined by IPSCC criteria) were included. We applied a Random Forest approach to identify the best set of
predictors out of 44 variables measured at the day of onset of the disease. The developed diagnostic model was
validated in a temporal split-sample approach.
Results: A model including four clinical (length of PICU stay until onset of non-infectious SIRS/sepsis, central line,
core temperature, number of non-infectious SIRS/sepsis episodes prior to diagnosis) and four laboratory parameters
(interleukin-6, platelet count, procalcitonin, CRP) was identified in the training dataset. Validation in the test dataset
revealed an AUC of 0.78 (95% CI: 0.70–0.87). Our model was superior to previously proposed biomarkers such as
CRP, interleukin-6, procalcitonin or a combination of CRP and procalcitonin (maximum AUC = 0.63; 95% CI: 0.52–0.
74). When aiming at a complete identification of sepsis cases (100%; 95% CI: 87–100%), 28% (95% CI: 20–38%) of
non-infectious SIRS cases were assorted correctly.
Conclusions: Our approach allows early recognition of sepsis with an accuracy superior to previously described
biomarkers, and could potentially reduce antibiotic use by 30% in non-infectious SIRS cases. External validation
studies are necessary to confirm the generalizability of our approach across populations and treatment practices.
Trial registration: ClinicalTrials.gov number: NCT00209768; registration date: September 21, 2005.
Keywords: Diagnosis, Sepsis, SIRS, Pediatric, Random Forest, Intensive care unit
* Correspondence:
†
Equal contributors
1
Department of Epidemiology, Research Group Epidemiological and
Statistical Methods (ESME), Helmholtz Centre for Infection Research,
Inhoffenstr. 7, 38124 Braunschweig, Germany
3
German Center for Infection Research (DZIF), Hannover-Braunschweig site,
30625 Hannover, Germany
Full list of author information is available at the end of the article
© The Author(s). 2018 Open Access This article is distributed under the terms of the Creative Commons Attribution 4.0
International License ( which permits unrestricted use, distribution, and
reproduction in any medium, provided you give appropriate credit to the original author(s) and the source, provide a link to
the Creative Commons license, and indicate if changes were made. The Creative Commons Public Domain Dedication waiver
( applies to the data made available in this article, unless otherwise stated.
Lamping et al. BMC Pediatrics (2018) 18:112
Background
Sepsis and the systemic inflammatory response syndrome
(SIRS) are two conditions with similar pathophysiological
patterns and symptoms, but different causes of disease
[1–3]. While the systemic immune response in sepsis
is caused by pathogens, non-infectious SIRS is due
to non-infectious triggers. In children, sepsis is defined as the presence of SIRS during evidence of an
infection [1, 3]. Evidence for an infection is typically
provided by pathogen identification in the blood (mainly
by blood culture analyses), or by presence of clinical
symptoms associated with a high probability of systemic
infection [1–4]. However, blood culture sampling often
yields false-negative results, and clinical signs of infection
are often unspecific. It is therefore a huge challenge to
diagnose sepsis correctly in early disease states, which
would be necessary to initiate prompt antimicrobial treatment and to reduce case fatality rates [5]. Therefore, many
patients with fulfilled SIRS criteria but weak evidence of
infection are unnecessarily treated with antimicrobial
agents. This may be associated with adverse drug effects,
favor the emergence of multi-resistant bacteria and increase healthcare costs [6].
In the past decades, several biomarkers have been proposed as diagnostic tests for the differentiation of sepsis
and non-infectious SIRS [7, 8], like e.g. procalcitonin
(PCT) and interleukin-6 (IL-6) [9–11]. However, none of
them was considered suitable to diagnose sepsis with
sufficient accuracy in clinical practice [12]. In some
cases, initial study results were overoptimistic due to
flawed study designs and lack of external validation [10,
11]; in others, the proposed markers were too expensive
or too difficult to obtain for being implemented in the
therapeutic standards of intensive care medicine [13]. In
an adult population, a recent study showed that the discriminatory ability of several weak sepsis biomarkers
could be improved when combining them into one diagnostic model [14]. However, even this combination
could not sufficiently improve the accuracy for sepsis/non-infectious SIRS discrimination [14, 15]. Due
to age-related changes in symptoms and laboratory
markers, diagnosis of sepsis and distinction from
non-infectious SIRS are even more complex in
children.
Our aim was to develop and validate a diagnostic
model for the discrimination of pediatric sepsis and
non-infectious SIRS during the clinical course based
on routinely available parameters, which can easily be
implemented into clinical practice. Therefore, we decided to perform a fully data-driven approach using
all information gathered on a pediatric intensive care
unit (PICU) during a randomized clinical trial (RCT)
with a homogeneous and validated definition for sepsis and non-infectious SIRS.
Page 2 of 11
Methods
Source of data
Data used for this analysis arise from a prospective singlecenter RCT investigating the effect of in-line filtration in
an interdisciplinary PICU of a German tertiary care hospital (ClinicalTrials.gov number: NCT00209768) [16]. Patient recruitment took place between February 2005 and
September 2008.
Outcome
Outcome of interest was the presence of non-infectious
SIRS or sepsis according to the criteria defined by the international pediatric sepsis consensus conference (IPSCC) in
2005 [1, 3]. Sepsis was diagnosed according to IPSCC criteria as “SIRS in the presence of or as a result of suspected
or proven infection”. To further improve the correctness
and validity of the infectious origin we additionally applied
the consensus conference criteria for infection in the intensive care unit [17]. All sepsis diagnoses were later reviewed
according to the updated Centers for Disease Control and
Prevention (CDC) criteria from 2008 [18] as indicated. A
catheter-related sepsis with common skin commensals as
coagulase negative staphylococci was defined according to
the consensus conference criteria for infection in the intensive care unit [3]. Further information about all sepsis episodes including the sites of primary infection as well as
microbiological test results can be found in the additional
files (Additional file 1: Table S1).
Diagnoses of SIRS/sepsis were made prospectively in
real-time by an experienced attending physician with the
consultation of infectious disease specialists. The diagnoses were later reviewed independently by two blinded
experienced pediatric intensive care physicians. The confirmatory review was a post-hoc analysis with the availability of all clinical data such as vital signs, infectiological,
laboratory and radiological data. This final analysis was
performed after discharge of the patient from PICU and
after checks for data integrity and validity. In case of disagreement, a consensus was achieved after open discussion
with a third senior pediatric intensive care physician and
the episode was allocated without ambiguity to either noninfectious SIRS or sepsis. The reviewers initiated the
original study, but were not involved in the data analysis
concept of the present analysis.
Study participants
All patients under the age of 18 years admitted to the PICU
were eligible for enrollment in the original RCT. Exclusion
criteria covered expected death within 48 h of admission,
participation in other trials, or absence of intravenous therapy. Individual follow-up began at enrollment and ended
with discharge from the PICU, death, or discontinuation of
allocated interventional therapy. Discharge within 6 h after
admission was a reason for exclusion from the study [16].
Lamping et al. BMC Pediatrics (2018) 18:112
Page 3 of 11
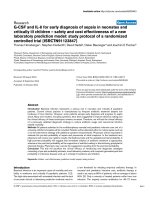
Eight hundred seven patients formed the final dataset of
the original RCT. Only patients who developed noninfectious SIRS or sepsis during their ICU stay were considered for the analysis. The total number of diagnosed
non-infectious SIRS and sepsis episodes was 274 and 58,
respectively. These episodes occurred in 230 patients
(Fig. 1); 213 had at least one non-infectious SIRS episode,
47 at least one sepsis episode; 20 suffered from both noninfectious SIRS and sepsis. In order to avoid bias towards
disease types occurring early during PICU visit (e.g. postsurgery SIRS), we included not only the first, but all noninfectious SIRS and sepsis episodes of a patient into our
analysis. However, we considered only episodes for inclusion, which were diagnosed at least 10 days after termination of the previous episode to avoid any effect of the
prior episode on parameter measures. Thus, the primary
dataset of our study included 238 non-infectious SIRS and
58 sepsis episodes (Fig. 1).
Predictors
Forty-six variables were considered as potential predictors in the development stage of the model (Additional
file 1: Table S2). All predictor values were extracted
from the trial database and were based on parameters
obtained from the hospital information system or from
patient records. For time-dependent predictors only
values at the day of diagnosis were considered (before
start of treatment). If more than one value per day was
measured for a predictor, the most abnormal value was
recorded. All parameter values were checked for plausibility first by the responsible clinicians and statisticians
of the original RCT, and again by the statisticians of this
secondary analysis. Continuous predictor variables were
kept continuous. If age- and sex-specific reference values
were available, we standardized the respective parameters for age and sex (Additional file 1: Table S2) by dividing the measured value by the mean reference value of
the respective age group.
Missing data
Missing data were handled in a three-step approach
based on a missing at random assumption. First, if a
value for a given predictor was missing but there were
values on the day before and on the day after the event,
the arithmetic mean of these two values was used for
imputing the missing value. In a second step, all predictors containing more than 30% missing values, and all
episodes which were associated with missing values in
more than 30% of the predictors considered were excluded since missForest (the imputation method used
subsequently) provides unbiased imputation results for
up to 30% missing values [19, 20]. After application of
exclusion criteria related to missing values, two variables
(central venous oxygen saturation and glutamate
Patients enrolled in RCT NCT00209768
n=807
No evidence for SIRS or sepsis
n=577
Patients with SIRS/sepsis
n=230
Sepsis episodes
n=58
SIRS episodes
n=274
Within 10 days of other
SIRS/Sepsis episode
n=36
Within 10 days of other
SIRS/Sepsis episode
n=0
Unique sepsis episodes
n=58
More than 30% of
predictor data missing
n=2
Final number of sepsis episodes
n=56
Unique SIRS episodes
n=238
More than 30% of
predictor data missing
n=5
Final number of SIRS episodes
n=233
Fig. 1 Flow diagram showing the selection criteria for included non-infectious SIRS and sepsis episodes. Sepsis and non-infectious SIRS were discriminated
according to the International Pediatric Sepsis Consensus Conference (IPSCC) criteria [1, 3], and were confirmed by two blinded experienced pediatric
intensive care physicians. Each episode of disease was assigned to either non-infectious SIRS or sepsis without ambiguity
Lamping et al. BMC Pediatrics (2018) 18:112
dehydrogenase) as well as five non-infectious SIRS and
two sepsis episodes were excluded, resulting in a final
dataset of 233 non-infectious SIRS and 56 sepsis episodes (Fig. 1) and 44 variables.
All other missing values were imputed using the R
package missForest (version 1.4, [19, 20]). MissForest is
a nonparametric missing value imputation methodology
able to handle mixed-type data [19]. It was shown to
outperform other widely used imputation techniques,
such as multivariate imputation by chained equations
(MICE) and k nearest neighbour imputation (KNNimpute), especially when complex interactions and nonlinear relations are suspected as it was the case with our
dataset [19, 20]. Imputation was done leaving out the
outcome variable as well as the variables counting the
previous events (see Additional file 1: Table S2). Imputation with missForest was performed independently for
training and test datasets. The variable “base excess” was
excluded after imputation since it represented a linear
combination of variables already present in the dataset.
Statistical analyses
Methodological concept
Machine learning is a branch of artificial intelligence
used for data analysis which automates analytic model
building. Random forests are a method typically used for
classification problems which uses machine learning
algorithms. Due to the high-dimensional data and the
unclear predictor structure, we chose a random forest
(RF) approach [21–23] based on conditional inference
trees [24] for analysis. While classic statistical modelling
techniques building on regression methodology cannot
be used in cases where the number of potential predictors exceeds the number of observations, Random Forests have been shown to perform well in these situations
[23]. Our analysis approach was data driven since we did
not make any a-priori judgements about what kind of
variables to use as potential predictors or about what
kind of distributions the respective variables might follow. Predictor selection was performed using a backward
selection process based on out-of-bag areas under the
curve (OOB-AUC [25]). This approach is known to give
the same weight to both occurring classes irrespective of
the class size [25, 26]. We used the recently developed
AUC-based permutation Variable Importance Measure
(VIM) [26] which has been shown to be the best selection method in the case of imbalanced datasets as
present in our analysis [26]. The model with the largest
OOB-AUC was selected as the model of choice. No penalization for the number of selected variables was applied since AUCs were already calculated based on
internal validation minimizing the risk of overfitting. A
more detailed description of the methodological concept
can be found in Additional file 1: Methods S1.
Page 4 of 11
Statistical software
All analyses were performed using the R package party,
version 1.0–22 [26]. By setting the parameters mincriterion, minbucket and minsplit in the cforest function to
zero, conditional inference trees were grown to maximal
possible depth [26]; bootstrap sampling was used as the
resampling scheme; the number of trees per forest was
set to 1000. The mtry parameter was set to the square
root of the number of predictor variables. All parameters
were hold fixed throughout the entire analysis. R codes
used for this analysis are presented in Additional file 1:
Code S1.
Model validation
The dataset was split into two parts (training and validation dataset) in a non-random manner. Patients enrolled 2005–2006 were used for the training dataset,
while those enrolled in 2007–2008 served as the validation dataset. Non-random time splits represent one of
the best validation methods when no truly external validation dataset is available and provide considerably
more valid results than random splits of datasets; they
are therefore considered an intermediate between internal and external validation [27]. Areas under the
curve (AUCs) with DeLong confidence intervals were
used as a measure of diagnostic accuracy. Sensitivity and
specificity of sepsis diagnosis (with respective Wilson
confidence intervals) were calculated for two cut-off
values defined by a) the Youden index [28] and b) the
lowest cut-off probability associated with 100% correct
classification rate for sepsis.
Comparison to previously proposed individual markers
We evaluated the diagnostic accuracy of previously proposed markers for differentiation of non-infectious SIRS
and sepsis (C-reactive protein [CRP], PCT, IL-6) and
their combination in our validation dataset and compared it to the accuracy of the diagnostic model developed in the RF approach.
Sensitivity analyses
For sensitivity analyses, we first varied the mtry parameter
of the RF procedure for our primary analysis to estimate
the stability of our methodological concept. Second, we
assessed the stability of the validation concept used for
our primary analysis by comparing it to a three-fold internal cross-validation approach. Cross-validation (CV) is
a widely used resampling method in machine learning to
assess model performance [29]. Thereby the data is split
into different parts or folds. Often 3-fold, 5-fold, 7-fold or
even 10-fold CV is used. In the case of 3-fold CV the
model is built on two folds of the data and model performance is assessed on the other fold of the data. This
procedure is than repeated three times so that every fold
Lamping et al. BMC Pediatrics (2018) 18:112
is once used as test data to assess model performance.
Therewith 3 performances measures are obtained which
are usually averaged to get the average CV-AUC. We
followed this principle and applied our entire data analysis
approach (including missing data imputation with MissForest and variable selection) each time to two folds of
the data and used the third fold as an independent test
data to assess model performance. Third, we ran a sensitivity analysis limiting the study population to one episode
per patient (randomly drawn). Fourth, we developed a
prediction model using the entire dataset for both training
and testing to show how the predictive performance
would be overestimated if internal validation was lacking.
This can be understood as a bad practice example to show
how previous studies might have overestimated the true
predictive performance of their models.
Results
Study participants
Sepsis episodes were more likely to occur in patients
with higher PIM-II score (p = 0.034), longer duration of
PICU stay until onset of disease (p < 0.001), previous
history of SIRS and/or sepsis (p < 0.001), and were associated with higher levels of PTT (p = 0.013), d-dimers (p
= 0.001), fibrinogen (p = 0.018), IL-6 (p = 0.001), PCT (p
= 0.020), CRP (p = 0.009), body temperature (p < 0.001)
and lower levels of platelets (p = 0.023). In the blood gas
analysis, sepsis episodes showed higher bicarbonate (p =
0.048), whereas SpO2 (p = 0.015) values were lower in
sepsis than in non-infectious SIRS episodes (Table 1).
Model development
After the dataset was time-split, 130 non-infectious SIRS
and 24 sepsis episodes were assigned to the training
dataset, while validation was performed on 103 noninfectious SIRS and 32 sepsis cases. Variable selection by
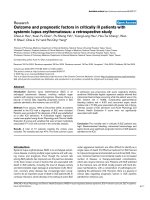
a backward selection process in the training dataset showed
increasing OOB-AUCs until eight variables were left in the
model and decreased afterwards (Fig. 2, Additional file 1:
Table S3).
A model including four clinical parameters (length of
PICU stay until onset of non-infectious SIRS/sepsis,
presence of a central line, core temperature, cumulative
number of sepsis and non-infectious SIRS episodes prior
to diagnosis) as well as four laboratory parameters (IL-6,
platelet count, PCT, CRP) was identified as the best
model showing an out-of-bag area under the curve
(OOB-AUC) of 0.82 (Fig. 2, Table 2). Analysis of variable
importance measures suggested that length of current
PICU stay until onset of non-infectious SIRS/sepsis and
IL-6 were the most important predictors in our RF approach (Table 2).
Page 5 of 11
Model performance
The developed prediction model was then applied to the
validation dataset reaching a moderate diagnostic accuracy with an AUC of 0.78 (95% CI: 0.70–0.87). When
requesting that all sepsis cases were classified as such
(correct classification rate of 100% (95% CI: 87–100%)),
28% (95% CI: 20–38%) of non-infectious SIRS episodes
were classified correctly. If aiming at the best overall
performance as defined by the Youden index, 61% (95%
CI: 51–70%) of non-infectious SIRS cases and 84% (95%
CI: 66–94%) of sepsis cases could be identified as such.
Comparison of RF approach to other proposed diagnostic
tests
Previously proposed markers for the differentiation of
non-infectious SIRS and sepsis such as CRP (AUC =
0.57; 95% CI: 0.47–0.68), IL-6 (AUC = 0.63; 95% CI:
0.52–0.74) and PCT (AUC = 0.55; 95% CI: 0.34–0.56)
performed worse than the model developed in the RF
approach when applied to the validation dataset. Combining CRP and PCT (as proposed by Han et al. in a
non-validated study [14]) provided similar accuracy
values as the application of single biomarkers (AUC =
0.56; 95% CI: 0.45–0.66 without allowing for interaction;
AUC = 0.54; 95% CI: 0.43–0.65 with allowing for interaction, Fig. 3).
Sensitivity analyses
Three-fold cross-validation showed an average AUC of
0.75, confirming the results of the time-split validation
approach. Variation of the RF mtry parameter did not
affect accuracy measures (AUCs ranging from 0.72 to
0.84, see Additional file 1: Figure S1). Restriction of the
study population to one episode per patient, again, did
not have a relevant effect on study results. By using the
entire dataset for model development and assessment of
performance at the same time, an apparent AUC of 0.98
could be calculated, which overestimates the true predictive performance considerably (see Additional file 1:
Figure S2).
Discussion
In this study, we developed a diagnostic model for the differentiation of sepsis and non-infectious SIRS in critically
ill children based on routinely available data. Our developed model was superior to several other previously proposed tests or biomarkers, and could potentially reduce
antibiotic treatment by 30% in non-infectious SIRS cases.
A combination of 8 out of more than 40 clinical and laboratory parameters was identified as relevant predictors.
Some of the identified variables like PCT, CRP and IL-6
have been proposed before as markers for the differentiation between non-infectious SIRS and sepsis [9, 11];
others have not yet been described. These comprise
Lamping et al. BMC Pediatrics (2018) 18:112
Page 6 of 11
Table 1 Patient characteristics stratified by non-infectious SIRS/sepsis (n = 289)
Predictor variable
Sepsis (n = 56) frequency/
median (1st quartile-3rd
quartile)
Non-infectious SIRS (n = 233)
frequency/median (1st quartile-3rd
quartile)
p-value (chi squared/
Wilcoxon ranksum
test)
Age (months)
28 (4–105)
46 (9–120)
0.129
Female sex (n)
21
109
0.233
Weight (kg)
11.85 (4.50–27.12)
15.95 (7.67–32.68)
0.126
Height (cm)
97 (63–124)
99 (68–138)
0.048
PRISM score at PICU admission
14 (8–19)
11 (7–17)
0.155
PIM II score at PICU admission
5 (2–10)
2 (1–7)
0.034
SBP (mmHg)
80.5 (70–94.75)
82 (70–94)
0.763
HR (bpm)
162 (138–180.8)
151 (133–175)
0.947
CVP (mmHg)
11 (8–15.5)
13 (10–16)
0.178
Lactate (mmol/L)
1.8 (1.4–2.77)
2 (1.2–3.8)
0.513
Baseline characteristics
Indicators of disease severity
Clinical parameters
Respiratory frequency (per minute)
25 (15–40)
22 (15–35)
0.973
SpO2 (%)
95 (89.25–97)
96 (94–98)
0.015
Urinary excretion (L per day)
3.34 (1.62–4.49)
2.83 (1.88–4.43)
0.582
Core temperature (°C)
39.15 (38.6–39.32)
38.7 (38.2–39)
< 0.001
7.41 (7.33–7.46)
7.39 (7.32–7.45)
0.388
Blood gases/ laboratory parameters
pH
pCO2 (mmHg)
42 (38–50.25)
41 (36–47)
0.433
HCO−3 (mmol/L)
25 (23–27.25)
24 (22–27)
0.048
Leucocyte count (× 109/L)
11.9 (5.05–18.5)
13.55 (6.6–18.2)
0.593
Hb (g/dL)
10.9 (9.5–12.8)
10.8 (9.5–12.6)
0.331
Platelet count (× 10 /L)
112 (44–288.5)
169.5 (110.8–239.8)
0.023
INR
1.42 (1.21–1.67)
1.33 (1.2–1.62)
0.28
9
PTT (sec)
39.5 (34–50)
35 (31–44.75)
0.013
Fibrinogen (μmol/L)
3.24 (2.31–4.08)
2.6 (1.75–3.8)
0.018
d-dimer (ng/mL)
5008 (2328–11,240)
2733 (1224–5726)
0.001
CRP (mg/L)
48 (30–85.5)
33.5 (12.25–72)
0.009
IL-6 (ng/L)
118 (40–412)
52 (22–122.5)
0.001
PCT (μg/L)
2.55 (0.48–8.45)
1 (0.3–4.17)
0.020
AST (U/L)
75 (34.5–146.5)
73.5 (40–182.5)
0.388
ALT (U/L)
43.5 (16.25–93.5)
32 (18–71.5)
0.295
Phosphate (mmol/L)
1.54 (1.24–1.86)
1.64 (1.27–2.02)
0.238
Creatinine (μmol/L)
33.5 (26.25–61.5)
44.5 (31–65)
0.079
Urea (mmol/L)
7.55 (3.92–11.25)
6.2 (4–10.5)
0.285
Mechanical ventilation (n)
55 (98%)
221 (95%)
0.474
Central venous catheter (n)
43 (77%)
201 (86%)
0.099
Number of peripheral IV cannulas
2 (1–2)
2 (1–2)
0.972
102 (44%)
1
Technical ICU support
In-line filter application (allocation to interventional 24 (43%)
group in NCT00209768; ClinicalTrials.gov number)
Lamping et al. BMC Pediatrics (2018) 18:112
Page 7 of 11
Table 1 Patient characteristics stratified by non-infectious SIRS/sepsis (n = 289) (Continued)
Predictor variable
Sepsis (n = 56) frequency/
median (1st quartile-3rd
quartile)
Non-infectious SIRS (n = 233)
frequency/median (1st quartile-3rd
quartile)
p-value (chi squared/
Wilcoxon ranksum
test)
Medical/ surgical treatment
Antibiotics (n)
49 (88%)
195 (84%)
0.545
Steroids (n)
17 (30%)
45 (19%)
0.101
Catecholamines (n)
24 (43%)
132 (57%)
0.074
FiO2
0.3 (0.25–0.5)
0.35 (0.24–0.5)
0.806
Surgery before PICU admission (n)
40 (71%)
171 (73%)
0.741
15 (6–41)
2 (1–9)
< 0.001
0
31
199
1
14
24
2
7
6
3
2
4
4
2
0
0
40
203
1
11
23
2
4
6
3
1
1
Sepsis/ SIRS related factors
Length of PICU stay until onset of SIRS/ sepsis
(days)
Cumulative sepsis or SIRS episodes (n)
< 0.001
Total SIRS episodes (n)
0.003
Total sepsis episodes (n)
< 0.001
0
43
223
1
9
10
2
2
0
3
1
0
4
1
0
ALT alanine transaminase, AST aspartate transaminase, CRP C-reactive protein, CVP central venous pressure, FiO2 fraction of inspired oxygen, Hb hemoglobin, HCO−3
bicarbonate, HR heart rate, ICU intensive care unit, IL-6 interleukin 6, INR international normalized ratio, pCO2 partial pressure of carbon dioxide,
PCT procalcitonin, PTT partial thromboplastin time, SBP systolic blood pressure, SIRS systemic inflammatory response syndrome, SpO2 oxygen saturation from
pulse oximetry
laboratory parameters like platelet count and indicators of
disease severity like presence of a central venous line or
core temperature. Length of current PICU stay until onset
of non-infectious SIRS/sepsis was identified as the most
relevant predictor. This can be explained by the fact that
most non-infectious SIRS episodes occur early after surgery
or trauma and thus early after admission to PICU. In contrast, the risk of sepsis increases with length of stay on
PICU.
Previously proposed markers for the differentiation of
non-infectious SIRS and sepsis in adults like CRP, IL-6,
and PCT performed only slightly better than chance and
considerably worse than the model developed in the RF
approach, when applied to our data. Even a combination
of CRP and PCT (using the same model building approaches as proposed before in a study focusing at a
differentiation in the 48 h after disease onset [14]) did
not improve their diagnostic accuracy. This emphasizes
clearly that not only panels or combinations of biomarkers, but also the additional implementation of clinical parameters as predictors is important when aiming
at an improvement of the diagnostic accuracy for the
differentiation of sepsis and non-infectious SIRS. Since
our study was the first one to take into account all
routinely available clinical and laboratory data, it provides an innovative diagnostic approach for sepsis
identification which can easily be applied into clinical
practice.
One major advantage of our approach is that all
relevant information can be entered directly in the
model and no further clinical judgement (e.g. on if the
SIRS episode happens early or late after admission)
Lamping et al. BMC Pediatrics (2018) 18:112
Page 8 of 11
Fig. 2 Graphical illustration of the backward variable selection process based on the out-of-bag area under the curve (OOB-AUC). Left panel: Area under
the curve (AUC) based permutation variable importance measure (VIM) ordered by importance of included variable; the VIM is a proxy for the importance
of the variable for correct outcome prediction, but has not the same meaning as classic influence measures based on distributional statistics (like effect sizes
(e.g. Odds Ratios) or p values). Right panel: Areas under the curve by number of included predictor variables (as determined by out-of-bag area under the
curve (OOB-AUC) procedure). Corresponding variables can be found in Additional file 1: Table S3
needs to be performed. Once an episode of SIRS is identified (e.g. by using a computer-based clinical decision
support system implemented in an intensive care unit or
by a clinician) and the question arises whether the episode is due to an infection or not, the physician would
enter the current values for the eight parameters of our
model to an web-based interface (in which the Random
Forest construct can be stored), and would promptly
receive a decision about if the episode is of infectious
origin or not and if antibiotic treatment is necessary.
Moreover, probabilities would be given on how likely it
is that the episode can be classified as non-infectious
SIRS or sepsis. To diminish the risk of mistreatment in
septic cases, an episode would only be classified as noninfectious if the model predicts this with 100%
probability. Since all of this could happen in routine
practice in real-time, even days before microbiological
results are expected, treatment initiation could be
already triggered by the model results.
Strengths
Our study has several major strengths. First, the dataset
used for our study was very well characterized having
been run through various plausibility and quality checks,
not the least for the outcome definitions of noninfectious SIRS and sepsis; moreover, it was sufficiently
large for the applied analysis strategy allowing time-split
validation and accounting for age differences in predictor measures by using age-specific reference values.
Moreover, the methodological concept applied to this
Table 2 Variables selected for the diagnostic model in the training dataset and their importance
Variable
Variable importance measurea
Length of PICU stay until onset of non-infectious SIRS/sepsis
0.031
Interleukin-6
0.017
Platelet count
0.010
Procalcitonin
0.008
Cumulative sepsis or non-infectious SIRS episodes (n)
0.007
Core temperature
0.005
C-reactive protein
0.005
Central venous catheter
0.004
a
Variable importance measures are a proxy for the importance of the variable for correct outcome prediction, but have not the same meaning as classic influence
measures based on distributional statistics (like effect sizes (e.g. Odds Ratios) or p values)
Lamping et al. BMC Pediatrics (2018) 18:112
Page 9 of 11
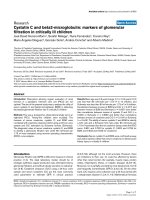
Fig. 3 ROC analysis comparing the diagnostic performance of the developed model against previously proposed biomarkers. Left panel: The ROC
curve of our proposed model (solid black line; AUC: 0.78; 95% CI: 0.70–0.87) was compared against previously proposed single biomarkers in the test
data set. C-reactive protein (CRP, solid grey line; AUC = 0.57; 95% CI: 0.47–0.68), interleukin-6 (IL-6, dot-dashed black line; AUC = 0.63; 95% CI: 0.52–0.74)
and procalcitonin (PCT, dashed grey line; AUC = 0.55; 95% CI: 0.34–0.56). Specificity represents the correct identification of sepsis, sensitivity the correct
identification of SIRS cases. Right Panel: The ROC curve of our proposed model (solid black line; AUC: 0.78; 95% CI: 0.70–0.87) was compared against
previously proposed combinations of biomarkers. CRP and PCT based on a logistic regression model allowing (dot-dashed black line; AUC = 0.54; 95%
CI: 0.43–0.65) and not allowing for interaction (solid grey line; AUC = 0.56; 95% CI: 0.45–0.66). Specificity represents the correct identification of sepsis,
sensitivity the correct identification of SIRS cases
analysis took advantage of modern machine learning
algorithms, developed particularly for situations with
many weak predictors as present in our dataset. In contrast to previous studies in the field we rigorously applied the TRIPOD guideline which has become a
requirement for high-quality studies in the field of
prediction modelling [27]. By combining our purely
data-driven approach with rigorously performed validation techniques, we were able to provide a realistic
view on the maximum diagnostic accuracy for differentiation of pediatric non-infectious SIRS and sepsis
associated with routinely available information. Several previous studies barely mentioned validation
processes, so that overfitting and thus overestimation
of model performance is very likely [11, 14]. If we did
not incorporate validation techniques in our analysis,
we got an AUC of 0.98 resulting in an almost perfect
discrimination between SIRS and sepsis. In contrast
to the model presented in our study, such a model
would perform much worse on a new unrelated dataset and would thus not be generalizable. Some of the
variables included in our predictive model have not
been described previously as strong univariable predictors of the discrimination of non-infectious SIRS
and sepsis. The strength of our methodological approach
is that it combines their predictive abilities in a non-
linear way allowing for hierarchical interactions of the
predictors, so that the weaknesses of single predictors in
specific situations can be counteracted by other variables
in the model.
Limitations
Our study has several limitations. The data used to develop the prediction model has not been collected for
this specific aim. Although secondary data analyses are
sometimes associated with severe limitations, the use of
the data from a large-sized randomized controlled trial
enabled us to combine the advantage of readily available
and validated real-life data generated during routine
management of a pediatric ICU with the strength of
double-validated and blinded outcome definitions of
sepsis and non-infectious SIRS. Moreover, no sample
size calculation with respect to the discrimination of
non-infectious SIRS and sepsis could be performed. The
effective sample size of the data has to be regarded as
relatively small in the light of the complexity surrounding the subject treated with. However, our dataset represents to our knowledge the largest study on pediatric
non-infectious SIRS and sepsis. Moreover, our sensitivity
analyses showed that the developed model and its accuracy remained stable over different validation approaches
Lamping et al. BMC Pediatrics (2018) 18:112
reassuring that the sample size was still large enough for
deriving stable estimates.
Though carefully validated, it is not clear if the model
can easily be applied to PICUs with standards different
from the tertiary-care hospital in which this study was
performed. Non-infectious SIRS and sepsis should be diagnosed using the same consensus criteria [1, 3]; predictors being part of the final diagnostic model should be
measured in a similar way. Moreover, the generalizability
of the model could be impacted by the fact, that we
included patients with and without in-line filter treatment [16], even though the original RCT showed that
application of in-line filters decreased the risk for noninfectious SIRS. However, the inclusion of all patients
led to a more realistic estimate of the diagnostic accuracy of our model when applied to PICUs with differing
treatment standards and varying SIRS and sepsis rates,
hence possibly facilitating generalizability. Sensitivity
analyses restricted to the control group of the RCT
showed results compatible to the main analyses.
Nevertheless, external validation of the proposed
model in a dataset not related to the present one is necessary to confirm the generalizability of our results.
The data used for this analysis have been collected
between 2005 and 2008 so that current treatment
practices might not necessarily be reflected. However,
since we used pre-treatment parameter values (at
least concerning SIRS/sepsis) the risk of a systematic
bias by calendar time can be considered as small. In
order to avoid a selection bias towards cases occurring early during PICU stay, we used more than one
episode per patient for the main analysis. With this
approach we might have underestimated the total
variability of our dataset and thus might have overestimated the diagnostic accuracy of the model. However, in a sensitivity analysis with only one randomly
selected episode per patient we got virtually unchanged results showing that no bias was introduced
by our approach.
One general limitation of the RF approach is that it
does not allow direct inference on the role of specific
predictors like e.g. classic multivariable model building
approaches like logistic regression models; it is thus
often described as a “black box” since it cannot be used
e.g. to develop scores which can be applied with pen and
paper but must be run in its original form as a software
application to get predictions for new patients. However,
variable importance measures can give some information
about which variables are most important for discrimination and need to be assessed in order to be able to classify a patient according to the RF based model. While
most of the variables included in the final model are
routinely available in most ICUs on a daily base, IL-6
and PCT might not which is a potential limitation of
Page 10 of 11
our model. In the past years, a new sepsis definition for
adult patients was developed [4] which is no longer
based on SIRS criteria and might have an impact on future pediatric sepsis definitions [30].
Conclusions
We have developed and validated for the first time a diagnostic model for the differentiation of non-infectious SIRS
and sepsis in critically ill children. It used an innovative
methodological approach and identified a combination of
eight clinical and laboratory parameters as relevant predictors. The diagnostic accuracy of our model in a validation
sample was superior to previously proposed tests for the
differentiation of non-infectious SIRS and sepsis when applied to the same dataset. The model allows early recognition of all sepsis cases (correct classification rate of 100%)
and could potentially reduce antibiotic use by 30% in noninfectious SIRS cases. All patients in our study were
treated with antibiotics at some point during their episode,
which underlines the clinical relevance of the proposed
reduction in antibiotic treatment for patients with noninfectious SIRS. External validation of our model in an unrelated dataset is necessary to confirm the generalizability
of the proposed approach across populations and treatment standards.
Additional file
Additional file 1: Table S1: Overview of all sepsis cases with site of
infection and relevant corresponding infectiological data. Table S2:
Systematic Overview of the Predictors used in the Analysis. Table S3:
Overview of all models in the backward selection procedure. Methods
S1: Detailed description and explanation of data analysis approach. Code
S1: R code for the main analysis. Figure S1: AUCs of the time-split approach with different mtry parameter. Figure S2: ROC analysis without
validation procedure (“Apparent Performance”). (DOCX 81 kb)
Abbreviations
AUC: Area under the curve; CRP: C-reactive protein; IL-6: Interleukin-6;
OOB: Out-of-bag; PCT: Procalcitonin; PICU: Pediatric intensive care unit;
RCT: Randomized controlled trial; RF: Random Forrest; SIRS: Systemic
inflammatory response syndrome
Acknowledgements
Not applicable.
Funding
This secondary data analysis was funded by the Hannover-Braunschweig site
of the German Center for Infection Research (DZIF). Funding for the original
RCT was provided by a research grant from Hannover Medical School and
partially by an unrestricted grant from Pall Corporation, Dreieich, Germany
and B. Braun Corporation, Melsungen, Germany.
Availability of data and materials
The R Code used for this analysis is available as an additional file. The dataset
analyzed during the current study is available from the corresponding author
on reasonable request.
Authors’ contributions
TJ, MS, PB, RTM, MB and AK designed the study. FL, NR, RTM, MB and AK
performed the analysis. FL, MB and AK drafted a first version of the
Lamping et al. BMC Pediatrics (2018) 18:112
manuscript. All authors contributed to revising the manuscript and agreed
with its final version.
Ethics approval and consent to participate
Ethics approval was obtained from the ethics committee of Hannover
Medical School (3702/2005). All legal guardians provided written informed
consent on admission to PICU.
Consent for publication
Not applicable.
Competing interests
FL, NR, PB, RTM and AK report no conflicts of interest. MS, TJ and MB report
having been paid travel and lecture fees from Pall Corporation and B. Braun
Corporation.
Publisher’s Note
Springer Nature remains neutral with regard to jurisdictional claims in
published maps and institutional affiliations.
Author details
1
Department of Epidemiology, Research Group Epidemiological and
Statistical Methods (ESME), Helmholtz Centre for Infection Research,
Inhoffenstr. 7, 38124 Braunschweig, Germany. 2Department for Pediatric
Cardiology and Intensive Care Medicine, Hannover Medical School, 30625
Hannover, Germany. 3German Center for Infection Research (DZIF),
Hannover-Braunschweig site, 30625 Hannover, Germany.
Received: 17 April 2017 Accepted: 26 February 2018
References
1. Goldstein B, Giroir B, Randolph A. International consensus conference on
pediatric S: international pediatric sepsis consensus conference: definitions for
sepsis and organ dysfunction in pediatrics. Pediatr Crit Care Med. 2005;6:2–8.
2. Bone RC, Balk RA, Cerra FB, Dellinger RP, Fein AM, Knaus WA et al.
American-College of Chest Physicians Society of Critical Care Medicine
Consensus Conference - Definitions for Sepsis and Organ Failure and
Guidelines for the Use of Innovative Therapies in Sepsis. Crit Care Med.
1992;20:864–74.
3. Gebara BM. Values for systolic blood pressure. Pediatr Crit Care Med.
2005;6:500. author reply 500-501
4. Singer M, Deutschman CS, Seymour CW, Shankar-Hari M, Annane D, Bauer
M, Bellomo R, Bernard GR, Chiche JD, Coopersmith CM, et al. The third
international consensus definitions for sepsis and septic shock (Sepsis-3).
JAMA. 2016;315:801–10.
5. Kumar A, Roberts D, Wood KE, Light B, Parrillo JE, Sharma S, Suppes R,
Feinstein D, Zanotti S, Taiberg L, et al. Duration of hypotension before
initiation of effective antimicrobial therapy is the critical determinant of
survival in human septic shock. Crit Care Med. 2006;34:1589–96.
6. Ratzinger F, Schuardt M, Eichbichler K, Tsirkinidou I, Bauer M, Haslacher H,
Mitteregger D, Binder M, Burgmann H. Utility of sepsis biomarkers and the
infection probability score to discriminate sepsis and systemic inflammatory
response syndrome in standard care patients. PLoS One. 2013;8:e82946.
7. Hall TC, Bilku DK, Al-Leswas D, Horst C, Dennison AR. Biomarkers for the
differentiation of sepsis and SIRS: the need for the standardisation of
diagnostic studies. Ir J Med Sci. 2011;180:793–8.
8. Pierrakos C, Vincent JL. Sepsis biomarkers: a review. Crit Care. 2010;14:R15.
9. Brunkhorst FM, Wegscheider K, Forycki ZF, Brunkhorst R. Procalcitonin for
early diagnosis and differentiation of SIRS, sepsis, severe sepsis, and septic
shock. Intensive Care Med. 2000;26(Suppl 2):S148–52.
10. Selberg O, Hecker H, Martin M, Klos A, Bautsch W, Kohl J. Discrimination of
sepsis and systemic inflammatory response syndrome by determination of
circulating plasma concentrations of procalcitonin, protein complement 3a,
and interleukin-6. Crit Care Med. 2000;28:2793–8.
11. Neunhoeffer F, Plinke S, Renk H, Hofbeck M, Fuchs J, Kumpf M, Zundel
S, Seitz G. Serum concentrations of Interleukin-6, procalcitonin, and Creactive protein: discrimination of septical complications and systemic
inflammatory response syndrome after pediatric surgery. Eur J Pediatr
Surg. 2016;26:180–5.
Page 11 of 11
12. Vincent JL. The clinical challenge of sepsis identification and monitoring.
PLoS Med. 2016;13:e1002022.
13. Neugebauer U, Trenkmann S, Bocklitz T, Schmerler D, Kiehntopf M, Popp J.
Fast differentiation of SIRS and sepsis from blood plasma of ICU patients
using Raman spectroscopy. J Biophotonics. 2014;7:232–40.
14. Han JH, Nachamkin I, Coffin SE, Gerber JS, Fuchs B, Garrigan C, Han X,
Bilker WB, Wise J, Tolomeo P, et al. Use of a combination biomarker
algorithm to identify medical intensive care unit patients with
suspected sepsis at very low likelihood of bacterial infection.
Antimicrob Agents Chemother. 2015;59:6494–500.
15. Kofoed K, Andersen O, Kronborg G, Tvede M, Petersen J, Eugen-Olsen J,
Larsen K. Use of plasma C-reactive protein, procalcitonin, neutrophils,
macrophage migration inhibitory factor, soluble urokinase-type
plasminogen activator receptor, and soluble triggering receptor expressed
on myeloid cells-1 in combination to diagnose infections: a prospective
study. Crit Care. 2007;11:R38.
16. Jack T, Boehne M, Brent BE, Hoy L, Koditz H, Wessel A, Sasse M. In-line
filtration reduces severe complications and length of stay on pediatric
intensive care unit: a prospective, randomized, controlled trial. Intensive
Care Med. 2012;38:1008–16.
17. Calandra T, Cohen J, International Sepsis Forum Definition of Infection in
the ICUCC. The international sepsis forum consensus conference on
definitions of infection in the intensive care unit. Critical care medicine.
2005;33:1538–48.
18. Horan TC, Andrus M, Dudeck MA. CDC/NHSN surveillance definition
of health care-associated infection and criteria for specific types of
infections in the acute care setting. Am J Infect Control. 2008;36:
309–32.
19. Stekhoven DJ, Buhlmann P. MissForest–non-parametric missing value
imputation for mixed-type data. Bioinformatics. 2012;28:112–8.
20. Waljee AK, Mukherjee A, Singal AG, Zhang Y, Warren J, Balis U, Marrero J,
Zhu J, Higgins PD. Comparison of imputation methods for missing
laboratory data in medicine. BMJ Open. 2013;3:e002847.
21. Boulesteix AL, Janitza S, Kruppa J, König IR. Overview of random forest
methodology and practical guidance with emphasis on computational
biology and bioinformatics. Wiley Interdiscip Rev Data Min Knowl Discov.
2012;2:493–507.
22. Breiman L. Random Forests. Mach Learn. 2001;45:5–32.
23. Diaz-Uriarte R, Alvarez de Andres S. Gene selection and classification of
microarray data using random forest. BMC Bioinformatics. 2006;7:3.
24. Hothorn T, Hornik K, Zeileis A. Unbiased recursive partitioning: a conditional
inference framework. J Comput Graph Stat. 2006;15:651–74.
25. Calle ML, Urrea V, Boulesteix AL, Malats N. AUC-RF: a new strategy for
genomic profiling with random forest. Hum Hered. 2011;72:121–32.
26. Janitza S, Strobl C, Boulesteix AL. An AUC-based permutation variable
importance measure for random forests. BMC Bioinformatics. 2013;14:119.
27. Moons KG, Altman DG, Reitsma JB, Ioannidis JP, Macaskill P, Steyerberg EW,
Vickers AJ, Ransohoff DF, Collins GS. Transparent reporting of a multivariable
prediction model for individual prognosis or diagnosis (TRIPOD):
explanation and elaboration. Ann Intern Med. 2015;162:W1–73.
28. Youden WJ. Index for rating diagnostic tests. Cancer. 1950;3:32–5.
29. James G, Witten D, Hastie T, Tibshirani R: An introduction to statistical
learning: with applications in R. New York: Springer Publishing Company,
Incorporated; 2014.
30. da Souza DC, Costa GA. New clinical criteria for sepsis in children-finally,
what is the most important thing: sensitivity or specificity? Pediatr Crit Care
Med. 2017;18:1006–7.