Determinants of stunting and severe stunting among Burundian children aged 6-23 months: Evidence from a national cross-sectional household survey, 2014
Bạn đang xem bản rút gọn của tài liệu. Xem và tải ngay bản đầy đủ của tài liệu tại đây (1.37 MB, 14 trang )
Nkurunziza et al. BMC Pediatrics (2017) 17:176
DOI 10.1186/s12887-017-0929-2
RESEARCH ARTICLE
Open Access
Determinants of stunting and severe
stunting among Burundian children aged
6-23 months: evidence from a national
cross-sectional household survey, 2014
Sandra Nkurunziza1,2* , Bruno Meessen3, Jean-Pierre Van geertruyden1 and Catherine Korachais3
Abstract
Background: Burundi is one of the poorest countries and is among the four countries with the highest prevalence
of stunting (58%) among children aged less than 5 years. This situation undermines the economic growth of the
country as undernutrition is strongly associated with less schooling and reduced economic productivity. Identifying
the determinants of stunting and severe stunting may help policy-makers to direct the limited Burundian resources
to the most vulnerable segments of the population, and thus make it more cost effective. This study aimed to
identify predictors of stunting and severe stunting among children aged less than two years in Burundi.
Methods: The sample is made up of 6199 children aged 6 to 23 months with complete anthropometric
measurements from the baseline survey of an impact evaluation study of the Performance-Based financing (PBF)
scheme applied to nutrition services in Burundi from 2015 to 2017. Binary and multivariable logistic regression
analyses were used to examine stunting and severe stunting against a set of child, parental and household
variables such as child’s age or breastfeeding pattern, mother’s age or knowledge of malnutrition, household size
or socio-economic status.
Results: The prevalence of stunting and severe stunting were 53% [95%CI: 51.8-54.3] and 20.9% [95%CI: 19.9-22.0]
respectively. Compared to children from 6-11 months, children of 12-17 months and 18-23 months had a higher
risk of stunting (AdjOR:2.1; 95% CI: 1.8-2.4 and 3.2; 95% CI: 2.8-3.7). Other predictors for stunting were small babies
(AdjOR=1.5; 95% CI: 1.3-1.7 for medium-size babies at birth and AdjOR=2.9; 95% CI: 2.4-3.6 for small-size babies at
birth) and male children (AdjOR=1.5, 95% CI: 1.4-1.8). In addition, having no education for mothers (AdjOR=1.6;
95% CI: 1.2-2.1), incorrect mothers’ child nutrition status assessment (AdjOR=3.3; 95% CI: 2.8-4), delivering at home
(AdjOR=1.4; 95% CI: 1.2-1.6) were found to be predictors for stunting. More than to 2 under five children in the
household (AdjOR=1.45; 95% CI: 1.1-1.9 for stunting and AdjOR= 1.5; 95% CI: 1.2-1.9 for severe stunting) and wealth
were found to be predictors for both stunting and severe stunting. The factors associated with stunting were found
to be applicable for severe stunting as well.
(Continued on next page)
* Correspondence:
1
Global Health Institute, University of Antwerp, Gouverneur
Kinsbergencentrum, Doornstraat 331–, -2610 Wilrijk, BE, Belgium
2
Health Community Department, University of Burundi, Boulevard du 28
NovembreBP 1020 Bujumbura, Burundi
Full list of author information is available at the end of the article
© The Author(s). 2017 Open Access This article is distributed under the terms of the Creative Commons Attribution 4.0
International License ( which permits unrestricted use, distribution, and
reproduction in any medium, provided you give appropriate credit to the original author(s) and the source, provide a link to
the Creative Commons license, and indicate if changes were made. The Creative Commons Public Domain Dedication waiver
( applies to the data made available in this article, unless otherwise stated.
Nkurunziza et al. BMC Pediatrics (2017) 17:176
Page 2 of 14
(Continued from previous page)
Conclusion: Mother’s education level, mother’s knowledge about child nutrition status assessment and health
facility delivery were predictors of child stunting. Our study confirms that stunting and severe stunting is in
Burundi, as elsewhere, a multi-sectorial problem. Some determinants relate to the general development of Burundi:
education of girls, poverty, and food security; will be addressed by a large array of actions. Some others relate to
the health sector and its performance – we think in particular of the number of children under five in the household
(birth spacing), the relationship with the health center and the knowledge of the mother on malnutrition. Our findings
confirm that the Ministry of Health and its partners should strive for better performing and holistic nutrition services:
they can contribute to better nutrition outcomes.
Keywords: Stunting, undernutrition, children, Burundi
Background
One of the sustainable development goals (SDGs) is to
end all forms of malnutrition by 2030 [1]. There are two
categories of malnutrition: on the one hand undernutrition which encompasses stunting, wasting and deficiencies
of micronutrients (i.e. vitamins and minerals) and on the
other hand overweight, obesity due to over-consumption
of specific nutrients. Worldwide, in 2014, 23.8% of the
children under-five years of age were stunted following
the WHO definition, 7.5% were wasted but 6.1% had overweight or were obese [2, 3].
Undernutrition makes children more vulnerable to
severe diseases. In 2015, undernutrition was considered
to be an underlying contributing factor in about 45% of
the 5.9 million children who died under the age of five.
Actually, the number of global deaths and DALYs lost
among children under-five years of age attributed to maternal and child undernutrition constitutes the largest
percentage of all risks in this age group]. Moreover, child
undernutrition is a strong predictor for less schooling
and reduced economic productivity when adult [4, 5],
which in turn are both risk factors for raising undernourished children, making it all a vicious circle. Thus,
the fight against malnutrition is a long term investment
for health but also for economic growth and social wellbeing for both present and future generations.
Developing countries host the bulk of the global stunting and child mortality rate. The situation is particularly
critical in Sub-Sahara Africa where one third of the
stunted under-five years of age children are retrieved and
where stunted children are 14 times more likely to die before the age of five[6]. Actually, although the global trend
in stunting has been decreasing from 39.6% in 1990 to
23.8% in 2014, the absolute number of stunted children in
Africa has increased by 23% within the same period [3, 7].
This dramatic situation calls for actions; African leaders
have to set up strategic plans to reduce both the epidemiologic and socioeconomic burden of malnutrition, and
turn the vicious circle into a virtuous one.
There is a large body of evidence on the factors of malnutrition in Low Income Countries (LICs) and sub-Saharan
Africa. A multi-national cohort study revealed an association between poverty and stunting [8]. Suboptimal
breastfeeding, and inappropriate complementary feeding practices, recurrent infections and micronutrient
deficiencies are also important determinants of stunting
[9, 10]. When poverty becomes an permanent condition, it leads to a cumulative inadequate food intake
and poor health conditions from which arises stunting
[11]: the increased frequency and severity of infections
in poorly nourished children results in growth impairment[11]. More comprehensively, linear growth failure
occurs within a complex interplay of other more distant
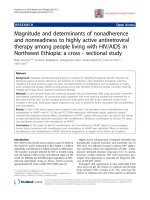
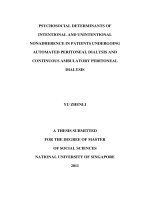
community and societal factors, such as access to healthcare and education, political stability, urbanization, population density and social support networks: this has been
described in the World Health Organization (WHO) Conceptual Framework on Childhood Stunting [12] (Figure 1).
This research zooms in on malnutrition in Burundi,
one of the poorest countries in the world with an estimated per capita gross national income of $280 in 2013
[13]. Densely populated, it has a population of approximately 10.6 million inhabitants on a total area of 27,830
square kilometers and 90% of the population is living in
rural areas from agriculture and 61.5% of the population
in this area cannot meet their basic needs in terms of
calorie intake [13]. Burundi has the highest prevalence
of stunting (58%) worldwide, together with Timor Leste
[14]. Burundian children aged less than five years suffer
from an important mortality rate of 82‰ per year [15].
The available literature on the Burundian nutrition
context consists mainly in reports from different partners in health looking at the trend of acute and chronic
malnutrition in the most affected provinces of the country [16]. Beside those descriptive reports, there is an impact evaluation report of a nutrition program run in two
provinces of eastern Burundi between 2010 and 2014.
The two-year impact of the nutrition program consisting
of three core components (distribution of food rations,
participation in behavior change communication sessions delivered via care groups and attendance at preventive health services) had been positive on household
Nkurunziza et al. BMC Pediatrics (2017) 17:176
Fig. 1 WHO conceptual framework on Childhood Stunting: Context, Causes, and Consequences
Page 3 of 14
Nkurunziza et al. BMC Pediatrics (2017) 17:176
access to food, child feeding practices and child morbidity. However, as the evaluation came too early in the
study process, the impact on child undernutrition could
not yet be evaluated [17–19]. A relevant report, in
regards to our research, comes from UNICEF who used
the 2010 Demographic and Health Survey data (DHS) to
assess the predictors factors of child undernutrition in
Burundi [20] and found that gender, age, mother’s age,
wealth index, dependency ratio and region of residence
were associated to stunting. Another study explored the
impact of the civil war on child’s health status found,
after controlling for province of residence, birth cohort,
individual and household characteristics, and provincespecific time trends, that children exposed to the war
have on average 0.52 standard deviations lower heightfor-age z-scores than non-exposed children [21].
We update and complete these findings to have a
comprehensive knowledge about the determinants of
stunting in the local Burundian context. This is vital to
develop prevention strategies and strengthen nutrition
intervention programs. We’ve included more independent variables such as mother’s knowledge, household’s
food security, breastfeeding, birth weight proxy, place of
delivery, arable land ownership. The findings should help
policy-makers to direct the limited Burundian resources
to the most vulnerable segments of the population, and
thus make it more cost effective. It may also help in designing new intervention strategies aimed at reducing
the number of malnourished children. Therefore, the
aim of the study was to identify predictors of stunting
and severe stunting among children aged less than two
years in Burundi.
Methods
Study design and sample size
We used household baseline data from an impact evaluation study which aims to measure and understand the
effects of the Performance-Based Financing (PBF)
scheme applied to nutrition services in Burundi at facility level and community level. The protocol of this
impact evaluation is described elsewhere [22]. Briefly,
the study has a cluster-randomized controlled trial design, with health center as the primary unit of sampling
and sous-colline (the smallest administrative entity with
a variable number of villages) as the secondary unit sampling. The sample size was computed on the smallest
difference in the main outcome that can be considered
of public health significance which is equivalent to a reduction of ≅25% in acute malnutrition prevalence (2.5%
points in absolute terms) in intervention centers as compared to control centers. Assuming that the intervention
will decrease the prevalence of moderate acute malnutrition in children aged 6 to 23 months from 10% to 7.5%
[23] while accepting a 2-sided α-error of 5% and a β-error
Page 4 of 14
of 20% indicated to survey at least 65 children aged 6-23
months in the catchment area of each health center.
Among the 193 health centers providing nutritional
services, 90 health centers were randomly selected (computer-based randomization) and randomized to either the
intervention or control group. The number of children
per health center was increased to 72 to allow for missing
or incomplete data, amounting to a total of 6,480 children
aged 6-23 months. The Nutrition PBF impact evaluation
study is registered on ClinicalTrials.gov with the following
identifier: NCT02721160 [22].
Data Collection
Households were eligible for the survey when (i) they
had at least one child aged 6-23 months and (ii) the
eligible child was present together with their mother or
primary caregiver and the household head. The first
visited household was chosen as follows: from the center
of the sous-colline, a pen was thrown in the air to indicate the direction to be taken by the surveyors; following
this direction, the first household reached with an eligible child was the first to be surveyed (only if caregiver
and head were present and gave their consent). The surveyors would then continue on the same direction to
find the second household to be surveyed, and so on. In
case of more than one eligible child in the household,
one of them was randomly selected. Data collection
tools consisted in three modules: a questionnaire administered to the household head, a questionnaire to the
mother and one anthropometrics module. The household head questionnaire allowed to get information on
general household characteristics such as household
head education, gender and occupation, household size,
distance to health center, as well as to assess the household socio-economic status and their food security status.
The questionnaire administered to the mother collected
information on her age, education, occupation and parity.
It also allowed to get information on her feeding practices
with the selected child and on her knowledge on nutrition;
we also collected information on the health of the child
(vaccination status, health problems in the last two weeks,
visits to the health center). The module on anthropometrics collected the weight, height, mid-upper arm circumference and presence of edema of the child (as well as the
mid-upper arm circumference (MUAC) of the mother).
In the field, surveyors worked in pairs with one supervisor per six pairs of surveyors. Each pair carried a SECA®
876 flat scale, a UNICEF measuring board and a SECA®
212 measuring tape. Surveyors were given comprehensive
training in the taking of anthropometric measurements
and a standardization exercise was carried out during the
course of the training. The questionnaire was filled in on a
smartphone, using the Open Data Kit Collect application[24], which allowed for: adding constraints into the
Nkurunziza et al. BMC Pediatrics (2017) 17:176
data field, automatically skipping irrelevant questions/
filtering to relevant questions, and obliging the surveyor
to respond to every question before finalizing the questionnaire. Close supervision also allowed for a good quality control. Finally, lot quality assurance sampling (LQAS)
was performed in order to ensure high quality anthropometrics measurements1.
Data analysis
Stunting
We used the 2006 World Health Organization (WHO)
Child Growth Standards. Height-for-age z-scores were
used to assess the chronic nutritional status of children
[25]. The height-for-age z-score expresses a child’s height
in terms of the number of standard deviations (SDs) above
or below the median height of healthy children in the
same age group or in a reference group. Children with a
measurement of <−2 SD from the median were considered as short for their age (stunted), while children with
measurement of <−3 SD from the median group were
considered to be severely stunted.
Explanatory variables
The explanatory variables were chosen on the basis of the
WHO conceptual framework on childhood stunting [12]
which is built on the UNICEF framework on causes of
malnutrition (Figure 1). Both frameworks highlight the
context, causes and consequences of stunting. However,
the basic and underlying causes are more itemized in the
WHO conceptual framework enabling a more context
specific guidance in developing of nutrition-sensitive
strategies.
We classified the factors into three levels: parental-,
child-, household-level factors. Parental-level factors include maternal education, mother’s age, marital status
as well as a variable assessing her knowledge of malnutrition. For the latter, we compared the mother’s satisfaction about the child’s nutrition status to the actual
child’s nutrition status and categorized mothers with either a correct or an incorrect assessment of their child’s
nutrition status.
Child-level factors were age, sex, place of delivery,
child’s breastfeeding pattern, sickness episode within the
two last weeks, feeding practices and a proxy of their
birth weight. The age of children was estimated first by
using the birth dates reported on their immunization
card (94% of children) and only secondary by asking the
mother.
In our survey sample, the birth weight was only present
on the immunization card in 30% of the cases. It has been
proven from 3 Demographic and Health Surveys (DHS)
conducted in three low- and middle-income countries
(LMICs) that the mother’s perception of size is a good
proxy of birth weight [26] and in our study the 30%
Page 5 of 14
children of whom we knew the birth weight was also correlated (r=-0.44) with the mother’s perception. Therefore,
we used the perceived size of the child at birth by the
mother as a proxy of the child’s birth weight. Using the
twenty-four hours recall on the child’s diet and based on
the WHO guidelines on indicators assessing infant and
young child feeding practices, we compute the minimum
acceptable diet which encompasses the minimum dietary
diversity and the minimum meal frequency [27].
Household level factors were household head education,
food insecurity, socio-economic status, source of drinking
water, time to the health center, household size and number of children aged less than 5 years in the household,
arable land ownership. The assessment of household food
insecurity was based on the 2007 Household Food
Insecurity Access Scale (HFIAS) generic questions, created by the Food and Nutrition Technical Assistance
(FANTA) project [28]. These have been validated in a
number of different contexts and over different timeperiods. The section includes nine occurrence questions,
with an increasing level of severity of food insecurity
(access) and nine questions concerning ‘frequency-ofoccurrence’ to determine how often food insecurity occurred [28]. A household wealth index was calculated as a
score of household assets such as ownership of means of
transport, ownership of durable goods and household
facilities. Weights for each variable were obtained thanks
to a principal components analysis method [29]. This
index was divided into five quintiles, and each household
was assigned to one of these categories: poorest, poorer,
middle, rich and richest.
Statistical analyses
To determine the level of stunting and severe stunting
in children aged 6-23 months, the dependent variable
was expressed as a dichotomous, that is, “not stunted”
(≥-2 SD) or “not severely stunted” (≥-3 SD) versus
“stunted” (<-2 SD) or “severely stunted” (<-3 SD). Logistic
regression analyses were performed using Stata® (version
12.1 College Station, Texas 77845 USA). Bivariate analysis
was done for all explanatory variables to identify those associated with children stunting and severe stunting. Variables with p-value below 0.10 in the bivariate analysis
were included in the multivariable analysis model. Adjustments for the cluster sampling design effects were incorporated using the “vce” command. A manual procedure of
stepwise backward elimination process was then used to
identify factors that were significantly associated with the
study outcomes using 5 % significance level. The adjusted
odds ratios (AdjOR) with 95% confidence Intervals (CIs)
were calculated and those with p<0.05 were considered to
be significant. Collinearity and interaction between independent variables were assessed.
Nkurunziza et al. BMC Pediatrics (2017) 17:176
Page 6 of 14
Results
Characteristics of the sample
The respondent rate was 95.7% (n=6199). The prevalence of stunting and severe stunting were 53.0% (95%
CI:51.8-54.3) and 21% (95% CI:19.9-22.0) respectively
(Table 1). Male and female children were nearly equally
represented as well as age categories. Among the children who experienced a sickness episode during the two
last week 59.1% (95% CI:57.9-60.3), the majority had
fever 54.6% (95% CI:53.0-56.7). 83.9% (95% CI:83.0-84.8)
of the children were born at a health facility. Almost all
children have been breastfed (99.9%; 95% CI:99.8-99.9)
and 83.4% (95% CI:81.7-85.1) of the children aged between 18 and 23 months were still on breastfeeding at
the moment of the survey. Only 24.8% (95% CI:23.926.0) of the children had the recommended diet
Table 1 Characteristics of children aged 6–23 months: national cross-sectional survey, Burundi 2014
Child characteristics
Number
Nutrition status
6199
Stunted
Not stunted
Severely stunted
Not severely stunted
%[95% CI]
Stunting
3291
2908
NA
NA
53.0% [51.8-54.3]
Severe stunting
NA
NA
1301
4898
20.9% [19.9-22.0]
1747
1281
778
2250
48.8% [47.6-50.0]
1544
1627
523
2648
51.1% [49.9-52.4]
6-11
843
1338
267
1914
35.1% [34.0-36.3]
12-17
1167
909
447
1609
33.4% [32.3-34.6]
1281
661
567
1375
31.3% [30.1-32.4]
1324
1207
485
2046
40.8% [39.6-42.0]
1967
1701
816
2852
59.1% [57.9-60.3]
Diarrhea
727
556
315
968
34.9% [33.4-36.5]
Fever
1086
919
472
1533
54.6% [53.0-56.7]
Respiratory infection
617
600
264
953
33.1% [31.6-34.7]
Sex
6199
Male
Female
Age (months)
6199
18-23
Sickness episode within 2 weeks
6199
No
Yes
3668
Breastfeeding practices
Has been breastfed
6197
3285
2906
1297
4895
99,9% [99.8-99.9]
Children weaned
6164
288
151
134
305
7.1% [6.4-7.7]
Exclusive 6 months breastfeeding
6074
2654
2308
1026
3936
81.6% [80.7-82.6]
Continuous to be breastfed
6-11 months
2176
839
1331
264
1906
99.7% [99.5-99.9]
12-17 months
2067
1097
855
438
1514
94.44% [93.4-95.4]
18-23 months
1921
1046
557
453
1150
83.4% [81.7-85.1]
All
6144
834
701
316
1219
24.8% [23.9-26.0]
6-11months
2173
161
223
52
332
17.6% [16.0-19.2]
12-17 months
2060
310
258
120
448
27.5% [25.6-29.0]
18-23 months
1911
363
220
144
439
30.5% [28.4-32.5]
Place of delivery
6189
600
395
247
748
16.0% [15.1-16.9]
2683
2511
1050
4144
83.9% [83.0-84.8]
Large
579
767
191
1155
21.8% [20.7-22.8%]
Average
2157
1869
833
3193
65.2% [64.0-66.4]
Small
539
263
267
535
12.9% [12.1-13.8]
Minimum acceptable diet
Home
Health facility
Birth weight proxy (Mother’s perception
on size of the baby at birth)
6174
Nkurunziza et al. BMC Pediatrics (2017) 17:176
Page 7 of 14
according to their age with respect to frequency and diversity (Table 1).
Half of the mothers were aged between 25 and 34
years. Around three quarters of them were without any
education and two third had the impression that their
babies were of average size at birth. The majority of the
households visited were in couple (legally married or
not) (91.9%; 95% CI:91.3-92.6).
At the moment of the interview, 58.5% (CI 95%:57.259.7) of the mothers perceived their children with a correct nutrition status (Table 2). Even though 90.3% (95%
CI:89.6-91.1) of the households visited had arable land,
91.9% (95% CI:91.1-92.5) of them were experiencing
food insecurity. The average household’s size was five
persons (IQR=4-7). Half of the households (49.8%; 95%
CI:48.5-51.0) lived at more than one hour walking to the
health center (Table 3 ).
Factors associated with stunting and severe stunting
Child level variables
Male was found to be associated with stunting (cOR=1.4;
95% CI: [1.3-1.5]; p<0.001) and severe stunting (cOR=1.7;
95% CI: [1.5-1.9]; p<0.001). The odds of being stunted for
children aged 12 to 17 months and 18-23 months were respectively two times more (95% CI: [1.8-2.3] for stunted
and 95% CI:[1.7-2.4] for severely stunted) and three times
more (95% CI:2.7-3.4 for stunted and 95% CI:2.5-3.4 for
severely stunted) than the odds of children aged 6-11
months (both p<0.001). Children aged 18-23 months for
whom the minimum acceptable diet was correct in
the 24 previous hours were less likely to be stunted
(cOR=0.78; 95% CI: 0.64-0.96; p=0.02) and severely
stunted (cOR=0.72; 95% CI: 0.58-0.91; p=0.005) than
those from same age category with not appropriate complementary food. Children born at home were more likely
to be stunted (cOR=1.4; 95% CI: 1.2-1.6; p<0.001) and
severely stunted (cOR=1.3; 95% CI: 1.1-1.5; p=0.001) than
those born at health facility.
Parental level variables
Children whose mothers had no education were more
likely to be stunted (cOR=2.3; 95% CI: 1.7-3; p<0.001)
and severely stunted (cOR= 2.0; 95% CI: 1.3-2.9;
p<0.001) than those whose mothers reached secondary
school and above. Children who were perceived by their
mothers to be of medium or smaller size at birth were
more likely to be stunted (cOR=1.5; 95% CI:1.3-1.7;
p<0.001) (cOR=2.7; 95% CI:2.2-3.2; p<0.001) and severely stunted (cOR=1.5; 95% CI:1.3-1.8; p<0.001)
(cOR=3.0; 95% CI:2.4-3.7; p<0.001) than those who were
perceived to be larger. Children whose mother was not
able to assess correctly the nutrition status were more
likely to be stunted (cOR=3.4; 95% CI: 3.1-3.8; p<0.001)
and severely stunted (cOR=1.2; 95% CI: 1.1-1.14;
p<0.001) than those whose mother do know. Beside
these common parental level factors associated with
stunting and severe stunting in Burundian setting, the
marital status of the mother (living in couple) was found
to be associated with severe stunting (in couple:
cOR:1.5; 95% CI: 1.2-1.8; p=0.001).
Household level variables
Children from a non-educated household head were more
likely to be stunted (cOR=1.9; 95% CI: 1.4-2.4; p<0.001)
and severely stunted (cOR=2.1; 95% CI: 1.4-3.0; p<0.001)
than children from household head with secondary school
Table 2 Characteristics of the parents: national cross-sectional survey, Burundi 2014
Parental Characteristics
Number
Stunted
children
Not stunted
Children
Severely stunted
children
Not severely
stunted children
%[95 CI]
Mother’s education
6199
No education
2449
2076
990
3535
73% [71.8-74.1]
Primary
765
684
283
1166
23.3% [22.3-24.4]
77
148
28
197
3.6% [3.1-4.1]
Secondary and above
Mother’s age
6081
15-24 years
996
915
385
1526
31.4% [30.2-32.5]
25-34 years
1564
1427
620
2371
49.1% [47.9-50.4]
660
519
266
913
19.3% [18.3-20.3]
1799
764
593
1970
41.5% [4.29-42.7]
1478
2132
701
2909
58. 4% [57.2-59.7]
34-49 years
Mother’s child nutrition assessment
vs current child’s nutrition status
6173
Uncorrect
Correct
Marital status
6199
In couple (legally married or not)
3012
2690
1165
4537
91.9% [91.3-92.6]
Live alone (div/sep/widow)
279
218
136
361
8.0%[7.3-8.6]
Nkurunziza et al. BMC Pediatrics (2017) 17:176
Page 8 of 14
Table 3 Households’ characteristics: national cross-sectional survey, Burundi 2014
Household Characteristics
n
Household Size
6199
Stunted
children
Not stunted
children
Severely stunted
children
Not severely
stunted children
%[95 CI]
<5
1752
1499
689
2562
52.4% [46.3-48.8]
≥5
1539
1409
612
2336
47.5% [46.3-53.6]
3103
2770
1127
4656
94.7% [94.1-95.3]
188
138
84
242
5.2% [4.7-5.8]
#Children Under 5
6199
≤2
>2
Household head education
6015
No education
2206
1843
916
3133
67.3% [66.1-68.5]
Primary
888
818
322
1384
28.3% [27.2-29.5]
102
158
32
228
4.3% [3.8-4.8]
No
317
280
134
463
9.6% [8.9-10.3]
Yes
2972
2626
1166
4432
90.3% [89.6-91.1]
1881
1618
746
2753
56.4% [55.2-57.6]
1410
1290
555
2145
43.5% [42.3-44.7]
<30 min
654
651
244
1061
21.7% [20.7-22.8]
30-60 min
903
801
336
1368
28. 4% [27.2-29.5]
1621
1366
681
2306
49. 8% [48.5-51.0]
Secondary
Arable land ownership
Source of drinking water
6195
6199
Not protected
Protected
Time to the Health centre
5996
>60 min
Food security level
6189
Food security
233
272
77
428
8.1% [7.4-8.8]
Low food insecurity
147
149
49
247
4.7% [4.2-5.3]
Moderate food insecurity
559
617
197
979
19.0% [18.0-19.9]
Severe food insecurity
2346
1866
974
3238
68.0% [66.8-69.2]
and above. Children who were living at more than one
walking hour from the health center had 1.2 (95% CI: 1.11.1.3; p: 0.01) times more odds to be stunted and 1.2 (95%
CI: 1.1-1.5; p: 0.003) times more odds to be severely
stunted than those living at less than 30 min walking.
Children from household experiencing severe food insecurity had 1.4 (95% CI: 1.2-1.7; p<0.001) more odds of
stunting and 1.6 (95% CI: 1.3-2.1; p<0.001) more odds of
severe stunting than those living in food secured household. Children from poor households were more likely to
be stunted compared to all other wealthier categories. Beside these common household level factors associated
with stunting and severe stunting, the number of children
under five of years in the household was found to be associated with severe stunting (Table 4).
Predictors for stunting
Male children were more likely to be stunted than girls
(AdjOR=1.5; 95% CI: 1.4-1.8; p<0.001) (Table 4). Increasing age was associated with stunting (AdjOR=2.1; 95%
CI: 1.8-2.4; p<0.001 for children aged 12-17 months and
AdjOR=3.2; 95% CI: 2.8-3.7; p<0.001 for children aged
18-23 months). Children who were perceived by their
mothers to be of medium or smaller size at birth were
more likely to be stunted than those who were perceived
to be larger (AdjOR=1.5; 95% CI: 1.3-1.7; p<0.001)
(AdjOR=2.9; 95% CI: 2.4-3.6; p<0.001). Children who
were delivered at home were more likely to be stunted
(AdjOR=1.4; 95% CI: 1.2-1.6; p<0.001) and severely
stunted (AdjOR=1.2; 95% CI: 1.1-1.5; p=0.03).
Children whose mothers had no schooling were more
likely to be stunted compared with children whose
mothers attained secondary school or above (AdjOR=1.6;
95% CI: 1.2-2.1; p=0.001). Children whose mother uncorrectly assess the nutrition status were more likely to be
stunted than those whose mother do (AdjOR=3.3; 95% CI:
2.8-4; p<0.001). Children who were delivered at home
were more likely to be stunted (AdjOR=1.4; 95% CI: 1.21.6; p<0.001). Being in a household with more than two
under five years children was associated with more risk of
being stunted than being in a household with one or two
under five years children (AdjOR=1.4; 95% CI: 1.1-1.9;
Nkurunziza et al. BMC Pediatrics (2017) 17:176
Page 9 of 14
Table 4 Factors associated with stunting and severe stunting in Burundian children aged 6-23 months, 2014
Stunted
Child characteristics
Crude OR
Severely stunted
p-value
Adjusted OR
<0.001
1.5 [1.4-1.8]
p-value
Crude OR
<0.001
1.7 [1.5-1.9]
p-value
Adjusted OR
<0.001
1.9 [1.6-2.2]
p-value
Sex
Female
1.0
Male
1.4 [1.3-1.5]
1.0
1.0
1.0
<0.001
Age (months)
6-11
1.0
1.0
1.0
1.0
12-17
2.0 [1.8-2.3]
<0.001
2.1 [1.8-2.4]
<0.001
2.0 [1.7-2.4]
<0.001
2.2 [1.9-2.6]
<0.001
18-23
3.0 [2.7-3.4]
<0.001
3.2 [2.8-3.7]
<0.001
2.9 [2.5-3.4]
<0.001
3.0 [2.7-3.9]
<0.001
1.2 [1.1-1.5]
0.03
Sickness episode within 2 weeks
No
1.0
Yes
1.0 [0.9-1.1]
1.0
0.31
1.2 [1.1-1.4]
0.003
Place of delivery
Health facility
1.0
Home
1.4 [1.2-1.6]
1.0
<0.001
1.4 [1.2-1.6]
1.0
<0.001
1.3 [1.1-1.5]
0.001
Exclusive 6 months breastfeeding
No
1.0
Yes
1.1 [0.9-1.2]
1.0
0.20
0.90 [0.77-1.06]
0.20
Continuous to be breastfed
6-11 months
No
1.0
Yes
1.2 [0.2-6.9]
1.0
0.27
0.69 [0.08-5.95]
0.74
12-17 months
No
1.0
Yes
1.0[0.7-1.4]
1.0
0.11
0.90 [0.57-1.39]
0.63
18-23 months
No
1.0
Yes
0.81 [0.62-1.05]
1.0
0.12
0.80 [0.62-1.03]
0.09
Minimum acceptable diet
All
No
1.0
Yes
1.1 [0.9-1.2]
1.0
0.25
0.97 [0.84-1.12]
0.68
6-11 months
No
1.0
Yes
1.1 [0.9-1.4]
1.0
0.15
1.1 [0.8-1.6]
0.38
12-17 months
No
1.0
Yes
0.91 [0.75-1.11]
1.0
0.37
0.89 [0.70-1.12]
0.33
18-23 months
No
1.0
Yes
0.78 [0.64-0.96]
1.0
0.02
0.72 [0.58-0.91]
0.005
Birth weight proxy (mother’s perception of the baby size at birth)
Large
1.0
1.0
1.0
Medium
1.5 [1.3-1.7]
<0.001
1.5 [1.3-1.7]
<0.001
1.5 [1.3-1.8]
<0.001
1.6 [1.3-1.9]
<0.001
Small
2.7 [2.2- 3.2]
<0.001
2.9 [2.4-3.6]
<0.001
3.0 [2.4-3.7]
<0.001
3.3 [2.6-4.1]
<0.001
Nkurunziza et al. BMC Pediatrics (2017) 17:176
Page 10 of 14
Table 4 Factors associated with stunting and severe stunting in Burundian children aged 6-23 months, 2014 (Continued)
Parental characteristics
Maternal education
Secondary and above
1.0
1.0
1.0
Primary
2.1 [1.6-2.9]
<0.001
1.6 [1.2-2.1]
0.002
1.7 [1.1-2.6]
0.01
No education
2.3 [1.7-3]
<0.001
1.6[1.2-2.1]
0.001
2.0 [1.3-2.9]
<0.001
Mother’s age
15-24 years
1.0
1.0
25-34 years
1.0 [0.9-1.1]
0.91
1.0 [0.9-1.2]
0.62
34-49 years
1.1 [1.0-1.3]
0.03
1.1 [0.9-1.3]
0.11
Mother’s nutrition assessment vs current child’s nutrition status
Correct
1.0
Uncorrect
3.4 [3.1-3.8]
1.0
<0.001
3.3 [2.8-4]
<0.001
1.2 [1.1-1.14]
<0.001
Marital status
Live in couple ( married or not) Live alone
(div/sep/widow)
1.0
Live alone (div/sep/widow)
1.1 [0.95-1.4]
1.0
0.10
1.5 [1.2-1.8]
0.001
Household characteristics
Household head education
Secondary and above
1.0
1.0
Primary
1.7 [1.3-2.2]
<0.001
1.7 [1.1-2.4]
0.01
No education
1.9 [1.4-2.4]
<0.001
2.1 [1.4-3.0]
<0.001
Household Size
<5
1.0
>=5
1.0 [0.9-1.1]
1.0
0.1
1.0 [0.9-1.1]
0.6
#Children Under 5
1 or 2
>2
1.0
1.2 [0.97-1.5]
1.0
0.08
1.45 [1.1-1.9]
1.0
0.003
1.3 [1.1-1.17]
1.0
0.03
1.5 [1.2-1.9]
0.001
Time to the Health centre
<30 min
1.0
1.0
30-60 min
1.1 [0.9-1.3]
0.1
1.0 [0.8- 1.2]
0.4
>60 min
1.2 [1.1- 1.3]
0.01
1.2 [1.1- 1.5]
0.003
Arable land ownership
Yes
1.0
No
1.0 [0.84-1.2]
1.0
0.99
1.1 [0.90-1.3]
0.36
Source of drinking water
Protected
1.0
unprotected
1.1 [0.96-1.2]
1.0
0.23
1.0 [0.93-1.2]
0.46
Food security level
Food secure
1.0
Low food insecure
1.1 [0.8-1.5]
0.34
1.1 [0.7-1.6]
1.0
0.62
Moderate food insecure
1.0 [0.8-1.3]
0.60
1.1 [0.8-1.4]
0.44
Severe food insecure
1.4 [1.2- 1.7]
<0.001
1.6 [1.3- 2.1]
<0.001
SE status
Richest
1.0
Richer
1.4 [1.2-1.7]
1.0
<0.001
1.2 [1.1-1.5]
1.0
0.01
1.4 [1.1-1.7]
1.0
0.003
1.3 [1.1-1.7]
0.03
Nkurunziza et al. BMC Pediatrics (2017) 17:176
Page 11 of 14
Table 4 Factors associated with stunting and severe stunting in Burundian children aged 6-23 months, 2014 (Continued)
Middle
1.7 [1.5-2.0]
<0.001
1.5 [1.21.7]
0.001
1.8[1.4-2.2]
<0.001
1.6 [1.3-2.1]
<0.001
Poor
2 [1.6-2.3]
<0.001
1.7 [1.4-2.1]
<0.001
2 [1.6-2.5]
<0.001
1.9 [1.5-2.4]
<0.001
Poorest
2.1[1.8-2.4]
<0.001
2 [1.6-2.3]
<0.001
2.4 [1.9-2.9]
<0.001
2.4 [1.9-2.9]
<0.001
p=0.003). Children from poorest households were more
likely to be stunted compared to all other categories
(AdjOR=2; 95% CI: 1.6-2.3; p<0.001) (Table 4).
Predictors for severe stunting
Age was significantly associated with severe stunting
(AdjOR=2.2; 95% CI: 1.9-2.6; p<0.001 for children aged
12-17 months and AdjOR=3.0; 95% CI: 2.7-3.9; p<0.001
for children aged 18-23 months compared to children
aged 6 to 11 months) and male children were more
likely to be severely stunted than females (AdjOR=1.9;
95% CI: 1.6-2.2; p<0.001) (Table 4). Children who were
perceived by their mothers to be of medium or smaller
size at birth were more likely to be severely stunted than
those who were perceived to be larger (AdjOR=1.6; 95%
CI: 1.3-1.9; p<0.001) (AdjOR=3.3; 95% CI: 2.6-4.1;
p<0.001). Living in a household with more than two
under five years children was associated with more odds
of being severely stunted than living in a household with
one or two under five years children (AdjOR =1.5; 95%
CI: 1.2-1.9; p=0.001). Children from poorest households
were more likely to be severely stunted compared to all
other categories (AdjOR=2.4; 95% CI: 1.9-2.9; p<0.001)
(Table 4).
Inappropriate complementary feeding practices was
correlated with household socio-economic status (r=0.1)
and household food security level (r=-0.2). The latter
two were also found to be correlate (r=-0.3).
Collinearity was assessed and found for sanitation and
source of drinking water. There was no interaction between independent variables.
Discussion
The prevalence of stunting and severe stunting among
children aged 6 to 23 months was 53.0% and 21% respectively. These figures are similar to those from the
last DHS conducted in 2010 (58.0%) [23]. This prevalence is high compared to the estimated prevalence of
stunted pre-school children for the UN regions and
sub-regions in 2015 [7]. Beside the heavy burden in
terms of lost DALYS, international studies have shown
that undernutrition is strongly associated with less schooling on the medium term [4, 5], and reduced economic
productivity on the long term [30], something has to be
done in order to stop the vicious circle.
Our study showed that the increased age of the child
was associated with stunting and severe stunting. Similar
findings were reported in other studies conducted in
different LMICs [31, 32]. This could be explained by the
inappropriate complementary food that children receive,
due to the high prevalence of household’s severe food insecurity (68%). As children are growing up, they need
adequate complementary food, in quantity and in quality, as a complement to the breast milk [10, 33]: our
study found that only 30% of the children aged between
18-23 months received appropriate complementary food
in regards to both frequency and diversity. In the bivariate
analyses, stunting and severe stunting were associated
with inappropriate complementary feeding practices but
this turned out to be non-significant in the multivariate
analysis.
Gender was another predictor of stunting and severe
stunting in children aged 6-23 months as boys had
higher odds of becoming stunted or severely stunted
compared to girls, supporting previous findings in the
region [31, 34]. A meta-analysis of 16 demographic and
health surveys in Sub-Saharan Africa revealed the same
results with an explanation oriented towards a historical
pattern of preferential treatment of females due to high
value placed on women’s agricultural labor [35]. However, such hypothesis cannot be ascertained in our study
as there is a gender balance among children who had
appropriate complementary food in the previous 24 hours
before the survey.
Children whose mothers perceived them to be small
or medium size at birth-a proxy of birth weight- were
found to be at higher odds of being stunted and severely
stunted compared to those perceived to be larger. Other
studies conducted in Tanzania in 2015 and in Nepal in
2014 had the same findings [31, 36]. More recently, a
cohort study conducted in Benin confirms that low birth
weight was associated with growth impairment [37].
Our study also reveals that mothers assessing correctly
the child nutrition status were less likely to have stunted
children than those who did not assess this correctly.
This could let assume that mothers who reserved time
to learn how to evaluate child nutrition status are the
ones who invest in the latter.
Children whose mothers reached secondary school and
above were less likely to be stunted than those whose
mothers had no schooling which also have been shown in
previous studies elsewhere [33]. These two findings demonstrate the importance of education of girls as one strategy to overcome the burden of stunting and to promote
good feeding practices for young children. In the present
study, children who were delivered at health facility were
Nkurunziza et al. BMC Pediatrics (2017) 17:176
less likely to be stunted compared to those delivered at
home. This matches with findings from the Tanzanian
(2015) and Kenyan (2012) studies [31, 34]. This finding
hypotheses that mothers who delivered at health facility
often use health services, and are thus more informed
about good child health care practices.
Children belonging to households with more than
two under five children were more likely to be stunted
or severely stunted than the others. These results are
similar to those found in Somalia [38]. Indeed, more
under five children in the family may lead to a higher
risk of having insufficient complementary food in a
context of severe food insecurity. The children from
the poorest socio-economic class were more likely to
be stunted and severely stunted than all other categories. This finding is also supported by different studies
conducted in LMIC [32, 39].
The factors that our study revealed to be predictors
for stunting and severe stunting can be classified according the WHO conceptual framework on childhood
stunting 12] into household and family factors (maternal
factors and home environment) such as: maternal education, mother’s nutrition status assessment, number of
under five years children in the household, size at birth.
The others are found to be predictors that are reflected
in the context in which the child lives: socio-economic
status, place of delivery. As mentioned above, these findings are supported by other studies done elsewhere.
Strengths and weaknesses of the study
The big size of our sample makes our findings precise
and reliable for the whole population of the rural parts
of Burundi. Though we cannot extrapolate the findings
to other countries, they however suggest some trends in
similar settings. However since the study has been conducted in rural areas, our findings are not applicable as
such for urban settings.
We considered many more variables than previous studies, such as mother’s knowledge on child‘s nutrition status
assessment, household’s food security, birth weight proxy,
place of delivery, arable land ownership.
A weakness from the surveys was that any reading
note wasn’t submitted to the interviewee to make sure
of his ability to read and write: this didn’t allow us to
consider the literacy variable for the analysis. Another
weakness is that we didn’t push further to investigate
community and societal factors specifically political
economy factors and health factors of the WHO conceptual framework on childhood stunting.
Page 12 of 14
family planning, young girls education, etc. As for the impact of performance-based financing as a mean to reduce
malnutrition, through e.g. support nutrition community
interventions, we will wait for the follow-up household
survey (due early 2017) to perform the impact analyses.
Possible other paths for action to study would be better
targeting (e.g. through a demand-side financing scheme
focused on poorest households), and nutrition community
interventions (e.g. sensitization).
Conclusion
We observed that child’s age, boys, a small birth weight
(as perceived by the mother), more than two children
under-five years of age in the household and household’s
poor socioeconomic status were factors associated with
stunting and severe stunting. Modeling selected that,
mother’s education level, mother’s knowledge about
child nutrition status assessment and health facility delivery were predictors of child stunting.
Our study confirms that stunting and severe stunting
is in Burundi, as elsewhere, a multi-sectoral problem.
Some determinants relate to the general development of
Burundi: education of girls, poverty, and food security;
will be addressed by a large array of actions. Some
others relate to the health sector and its performance –
we think in particular of the number of children under
five in the household (birth spacing), the relationship
with the health center and the knowledge of the mother
on malnutrition. Our findings confirm that the Ministry
of Health and its partners should strive for better performing and holistic nutrition services: they can contribute to better nutrition outcomes.
Endnotes
1
Twice a week, external supervisors followed randomly
chosen surveyors and measured again the weight, height,
MUAC and oedema presence among the surveyed children; their measurements were confronted to the ones
performed by the surveyors and errors were discussed
with them. Observed discrepancies were null on average
and big discrepancies (more than 200g for weight and
5mm for height and MUAC) were rare which tend to
confirm that anthropometrics were of good quality.
Abbreviations
AdjOR: Adjusted Odds Ratio; cOR: Crude Odds Ratio; DHS: Demographic and
Health Survey; FANTA: Food and Nutrition Technical Assistance; GDP: Gross
Domestic Product; HFIAS: Household Food Insecurity Access Scale;
IRB: Institutional Review Board; LMIC: Low and Middle Income Country;
NCT: National Clinical Trial; PBF: Performance Based-Financing; SD: Standard
Deviation; SDG: Sustainable Development Goals; UNICEF: United Nations of
International Children's Emergency Fund; WHO: World Health Organization.
Implications for future research
The study suggests possible new paths for action which
could trigger different action research projects, through
nutrition community interventions, sensitization for
Acknowledgements
We would like to extend our deepest gratitude to the World Bank for
financing the Impact Evaluation of Introduction of Nutrition criteria in the
PBF program in Burundi. Our appreciation goes to Pr Patrick Kolsteren and
Nkurunziza et al. BMC Pediatrics (2017) 17:176
Dominique Roberfroid for their valuable contributions during the early
design of the intervention. The authors would like to thank the persons from
the Nutrition Program in Burundi, Kirrily de Polnay, Ulises Huerta, Elodie
Macouillard, Manassé Nimpagaritse and Léonard Ntakarutimana for their
support in the preparation and implementation of the baseline surveys. The
authors would also like to thank the ISTEEBU team who realized the baseline
survey. Our appreciation goes to the data collectors and supervisors. Lastly,
our special thanks also go to mothers who participated in the study.
Funding
The research project (PBF-Nutrition in Burundi) is funded by the World Bank
and the field work of the corresponding author (quality assurance during
data collection, qualitative data collection, analysis, interpretation and
writing) is funded by VLIR-UOS.
Availability of data and materials
The datasets used and/or analyzed during the current study available from
the corresponding author on reasonable request.
Authors’ contributions
SN involved from acquisition of data, analysis and interpretation and wrote
the paper. CK involved in the inception to design the study, analysis and
interpretation and revised the manuscript. BM involved in the inception to
design the study and revised the manuscript. JPVG involved in the data
analysis and interpretation, revised the manuscript for the final submission.
All authors read and approved the final manuscript.
Page 13 of 14
6.
7.
8.
9.
10.
11.
12.
13.
14.
15.
16.
17.
Ethics approval and consent to participate
We used data from a household baseline survey of an Impact Evaluation
study of the performance-based financing scheme applied to nutrition
services in Burundi at health center level and community level. The ethical
clearance was obtained from the Institutional Review Board (IRB) in Belgium
and the Burundian Ethics Committee. Informed consent was signed by the
respondent and all information was collected confidentially.
18.
Consent for publication
Not applicable.
21.
19.
20.
22.
Competing interests
The authors declare that they have no competing interests.
23.
Publisher’s Note
Springer Nature remains neutral with regard to jurisdictional claims in
published maps and institutional affiliations.
24.
Author details
1
Global Health Institute, University of Antwerp, Gouverneur
Kinsbergencentrum, Doornstraat 331–, -2610 Wilrijk, BE, Belgium. 2Health
Community Department, University of Burundi, Boulevard du 28
NovembreBP 1020 Bujumbura, Burundi. 3Health Economics Unit, Department
of Public Health, Institute of Tropical Medicine, Nationalestraat 155, 2000
Antwerp, Belgium.
25.
26.
27.
28.
Received: 7 December 2016 Accepted: 20 July 2017
29.
References
1. United Nations. Sustainable Development Goals. />sustainabledevelopment/hunger/. 2016. New York, United Nations. 5-5-2016.
2. Black RE, Allen LH, Bhutta ZA, Caulfield LE, de Onis M, Ezzati M, et al.
Maternal and child undernutrition: global and regional exposures and
health consequences. Lancet. 2008;371(9608):243–60.
3. UNICEF, WHO, WB. Levels and Trends in Child malnutrition. New York:
UNICEF; 2015.
4. Grantham-McGregor S, Cheung YB, Cueto S, Glewwe P, Richter L, Strupp B.
Developmental potential in the first 5 years for children in developing countries.
Lancet. 2007;369(9555):60–70.
5. Victora CG, Adair L, Fall C, Hallal PC, Martorell R, Richter L, et al. Maternal
and child undernutrition: consequences for adult health and human capital.
Lancet. 2008;371(9609):340–57.
30.
31.
32.
33.
WHO. Children: reducing mortality. />factsheets/fs178/en/. 2016. Geneva, WHO. 5-5-2016.
de Onis M, Blossner M, Borghi E. Prevalence and trends of stunting among
pre-school children, 1990-2020. Public Health Nutr. 2012;15(1):142–8.
Petrou S, Kupek E. Poverty and childhood undernutrition in developing
countries: a multi-national cohort study. Soc Sci Med. 2010;71(7):1366–73.
Black RE, Victora CG, Walker SP, Bhutta ZA, Christian P, de Onis M, et al.
Maternal and child undernutrition and overweight in low-income and
middle-income countries. Lancet. 2013;382(9890):427–51.
Dewey KG, Mayers DR. Early child growth: how do nutrition and infection
interact? Matern Child Nutr. 2011;7(Suppl 3):129–42.
UNICEF. Tracking progress on child and maternal nutrition: a survival and
development priority. New York: UNICEF; 2009.
Stewart CP, Iannotti L, Dewey KG, Michaelsen KF, Onyango AW.
Contextualising complementary feeding in a broader framework for
stunting prevention. Matern Child Nutr. 2013;9(Suppl 2):27–45.
World Bank. Country overview. 2015. 22-11-2016.
UNICEF. Improving Child Nutrition. New York: UNICEF; 2013.
Banque Mondiale. Taux de Mortalité Infantile. quemondiale.
org/indicateur/SH.DYN.MORT. 2016. Washington,DC, BM. 5-5-2016.
Ouedraogo I, Muhire F. Enquête Nutritionnelle des enfants de 6 à 59 mois
des communes de Cendajuru, Kinyinya et Gisuru. Bujumbura: Croix Rouge
Belgique; 2014.
Parker M, Leroy JL, Olney D, Harris J, Ruel M. Strengthening and
Evaluating the Preventing Malnutrition Malnutrition in Children
under two Approach (PM2A) in Burundi: Baseline report.
Washington,DC: FHI360/FANTA; 2012.
Olney D, Parker ME, Iruhiriye E, Leroy J, Ruel M. A Process Evaluation of the
Tubaramure Program for Preventing Malnutrition in children under 2
Approach (PM2A) in Burundi. Washington,DC: FHI360/FANTA; 2013.
Leroy J, Heckert J, Cunningham K, Olney D. Strengthening and Evaluating
the Preventing Malnutrition in Children under 2 Years of Age Approach.
Washington, DC: FHI 360/FANTA; 2014.
UNICEF. Analyse de la malnutrition des enfants au Burundi. Bujumbura:
UNICEF; 2013.
Bundervoet T, Verwimp P, Akresh R. Health and Civil War in Rural Burundi.
Germany: Institute for the Study of Labor; 2007.
Nimpagaritse M, Korachais C, Roberfroid D, Kolsteren P, Zine Eddine El Idrissi
MD, Meessen B. Measuring and understanding the effects of a performance
based financing scheme applied to nutrition services in Burundi-a mixed
method impact evaluation design. Int J Equity Health. 2016;15(1):93.
Institut de Statistiques et d'Études Économiques du Burundi (ISTEEBU),
Ministère de la Santé Publique et de la Luttecontre le Sida [Burundi]
(MSPLS), ICF International. Enquête Démographique et de Santé 2010.
Bujumbura: ISTEEBU, MSPLS, ICF International; 2012.
Carl Hartung YAWBALCTGB. Open Data Kit: Tools to Build Information
Services for Developing Regions. London: ICTD; 2010.
WHO. WHO Child Growth Standards. Geneva: WHO; 2006.
Channon AA. Can mothers judge the size of their newborn? Assessing the
determinants of a mother's perception of a baby's size at birth. J Biosoc Sci.
2011;43(5):555–73.
WHO, UNICEF, IFPRI, FANTA2, USAID, UCDAVIS, et al. Indicators for assessing
infant and young feeding practices. Geneva: WHO; 2011.
Coates J, Swindale A, Bilinsky P. Echelle de l'Accès déterminant l'Insécurité
alimentaire des Ménages (HFIAS) pour la Mesure de l'Accès Alimentaire des
Ménages: Guide d'Indicateurs. Washington, DC: FANTA; 2007.
Vyas S, Kumaranayake L. Constructing socio-economic status indices:
how to use principal components analysis. Health Policy Plan. 2006;
21(6):459–68.
Hoddinott J, Maluccio JA, Behrman JR, Flores R, Martorell R. Effect of a
nutrition intervention during early childhood on economic productivity in
Guatemalan adults. Lancet. 2008;371(9610):411–6.
Chirande L, Charwe D, Mbwana H, Victor R, Kimboka S, Issaka AI, et al.
Determinants of stunting and severe stunting among under-fives in
Tanzania: evidence from the 2010 cross-sectional household survey. BMC
Pediatr. 2015;15:165.
Ramli AKE, Inder KJ, Bowe SJ, Jacobs J, Dibley MJ. Prevalence and risk
factors for stunting and severe stunting among under-fives in North Maluku
province of Indonesia. BMC Pediatr. 2009;9:64.
Prendergast AJ, Humphrey JH. The stunting syndrome in developing
countries. Paediatr Int Child Health. 2014;34(4):250–65.
Nkurunziza et al. BMC Pediatrics (2017) 17:176
Page 14 of 14
34. Abuya BA, Ciera J, Kimani-Murage E. Effect of mother's education on child's
nutritional status in the slums of Nairobi. BMC Pediatr. 2012;12:80.
35. Wamani H, Astrom AN, Peterson S, Tumwine JK, Tylleskar T. Boys are more
stunted than girls in sub-Saharan Africa: a meta-analysis of 16 demographic
and health surveys. BMC Pediatr. 2007;7:17.
36. Tiwari R, Ausman LM, Agho KE. Determinants of stunting and severe
stunting among under-fives: evidence from the 2011 Nepal Demographic
and Health Survey. BMC Pediatr. 2014;14:239.
37. Padonou G, Le PA, Cottrell G, Guerra J, Choudat I, Rachas A, et al. Factors
associated with growth patterns from birth to 18 months in a Beninese
cohort of children. Acta Trop. 2014 Jul;135:1–9.
38. Kinyoki DK, Kandala NB, Manda SO, Krainski ET, Fuglstad GA, Moloney GM,
et al. Assessing comorbidity and correlates of wasting and stunting among
children in Somalia using cross-sectional household surveys: 2007 to 2010.
Bmj Open. 2016;6(3):e009854.
39. Black RE, Victora CG, Walker SP, Bhutta ZA, Christian P. de OM, et al.
Maternal and child undernutrition and overweight in low-income and
middle-income countries. Lancet. 2013;382(9890):427–51.
Submit your next manuscript to BioMed Central
and we will help you at every step:
• We accept pre-submission inquiries
• Our selector tool helps you to find the most relevant journal
• We provide round the clock customer support
• Convenient online submission
• Thorough peer review
• Inclusion in PubMed and all major indexing services
• Maximum visibility for your research
Submit your manuscript at
www.biomedcentral.com/submit