Seasonality and determinants of child growth velocity and growth deficit in rural southwest Ethiopia
Bạn đang xem bản rút gọn của tài liệu. Xem và tải ngay bản đầy đủ của tài liệu tại đây (650.7 KB, 9 trang )
Fentahun et al. BMC Pediatrics (2018) 18:20
DOI 10.1186/s12887-018-0986-1
RESEARCH ARTICLE
Open Access
Seasonality and determinants of child
growth velocity and growth deficit in rural
southwest Ethiopia
Netsanet Fentahun1,4,5*, Tefera Belachew2, Jennifer Coates3 and Carl Lachat4
Abstract
Background: Ethiopia faces cyclic food insecurity that alternates between pre- and post- harvest seasons. Whether
seasonal variation in access to food is associated with child growth has not been assessed empirically. Understanding
seasonality of child growth velocity and growth deficit helps to improve efforts to track population interventions
against malnutrition. The aim of this study was assess child growth velocity, growth deficit, and their determinants in
rural southwest Ethiopia.
Method: Data were obtained from four rounds of a longitudinal household survey conducted in ten districts in Oromiya
Region and Southern Nations, Nationality and Peoples Region of Ethiopia, in which 1200 households were selected using
multi-stage cluster sampling. Households with a child under 5 years were included in the present analyses
(round 1 n = 579, round 2 n = 674, round 3 n = 674 and round 4 n = 680). The hierarchical nature of the data was
taken into account during the statistical analyses by fitting a linear mixed effects model. A restricted maximum
likelihood estimation method was employed in the analyses.
Result: Compared to the post-harvest season, a higher length and weight velocity were observed in pre-harvest
season with an average difference of 6.4 cm/year and 0.6 kg/year compared to the post-harvest season. The mean height
of children in post-harvest seasons was 5.7 cm below the WHO median reference height. The mean height of children
increased an additional 3.3 cm [95% CI (2.94, 3.73)] per year in pre-harvest season compared to the post-harvest season.
Similarly, the mean weight of children increased 1.0 kg [95% CI (0.91, 1.11)] per year more in the pre-harvest season
compared to the post-harvest season. Children who had a low dietary diversity and were born during the lean season
in both seasons had a higher linear growth deficit. Being member of a highly food insecure household was negatively
associated with higher weight gain. Having experienced no illness during the previous 2 weeks was positively associated
with linear growth and weight gain.
Conclusion: Child growth velocities and child growth deficits were higher in the pre-harvest season and post- harvest
season respectively. Low dietary diversity and being part of a highly food insecure household were significantly
risk factors for decreased linear growth and weight gain respectively.
Keywords: Seasonality, Growth velocity, Growth deficit, Rural Ethiopia
* Correspondence:
1
Department of Health Education and Behavioral Sciences, College of Health
Sciences, Jimma University, Jimma, Ethiopia
4
Department of Food Safety and Food Quality, Faculty of Bioscience
Engineering, Ghent University, Ghent, Belgium
Full list of author information is available at the end of the article
© The Author(s). 2018 Open Access This article is distributed under the terms of the Creative Commons Attribution 4.0
International License ( which permits unrestricted use, distribution, and
reproduction in any medium, provided you give appropriate credit to the original author(s) and the source, provide a link to
the Creative Commons license, and indicate if changes were made. The Creative Commons Public Domain Dedication waiver
( applies to the data made available in this article, unless otherwise stated.
Fentahun et al. BMC Pediatrics (2018) 18:20
Background
Due to seasonal variability of food production, dietary
intake, food security and morbidity in the developing
world, many children suffer from impaired linear growth
[1, 2]. Populations in low- and middle-income countries
are vulnerable to seasonal food shortages due to rain-fed
subsistence farming. Seasonality of food access affects
millions of the world’s poor communities and contributes
to some of the most widespread diseases [3].
In sub-Saharan Africa, more than 95% of farmed lands
rely on low input and low output rain-fed agriculture.
This results in seasonal food insecurity and malnutrition
among a great number of poor families [4]. Low use of
agricultural technology and poor market access contributes to seasonal fluctuations of household food consumption in particular in the more isolated rural
households [5].
Climate change represents a major threat to the coming decades, particularly in Africa, which has more
climate-sensitive economies than any other continent in
the world. Climate change is expected to increase the
burden of under-nutrition in particular in rural households [6, 7]. Climate change worsens the existing problem of under-nutrition in Africa and will further
challenge the current efforts to reduce poverty and
under-nutrition [8, 9].
The causes malnutrition include household food
insecurity, inadequate care for women and children, and
unhealthy environments, poor sanitation and hygiene or
lack of health services [10]. As all underlying causes of
malnutrition are potentially seasonal, information on
seasonal changes in determinants of malnutrition and
their effect on linear growth is essential to improve planning and targeting of food security and nutritionsensitive interventions in agriculture and, ultimately,
child well-being [11, 12].
To date, the Demographic and Health Surveys and
majority of child growth studies do not consider the
seasonal changes when assessing child growth. This
hampers assessment of nutritional status of children in
many resources limited countries and seasonal priorities.
Understanding seasonality of child growth can improve
models and simulations to track of success in the fight
against malnutrition [13, 14].
The aim of this study was to determine seasonality
and determinants of child growth velocity and growth
deficit in rural southwest Ethiopia. We hypothesized that
(i) children had a higher growth velocity in the postharvest season than pre-harvest season, (ii) children had
a lower child growth deficit in the post-harvest season
than pre-harvest season, and (iii) there is a difference in
child growth deficit between post and pre-harvest
seasons due to seasonal variability of dietary intake, food
security, season of child birth and morbidity.
Page 2 of 9
Methods
Study design and population
Data for the present study were obtained from four
rounds of a longitudinal panel survey conducted in ten
districts (woredas) encompassing 20 counties (kebeles) in
Oromiya Region and Southern Nations, Nationality and
Peoples Region of Ethiopia. Samples of 1200 households
were selected using multi-stage cluster sampling of
woredas and kebeles. Individual households were sampled
at the kebele level using the expanded program on
immunization sampling method [15]. Households with a
child under 5 years were included in the current analyses
(round 1 n = 579, round 2 n = 674, round 3 n = 674 and
round 4 n = 680). Data were collected using a pre-tested
interviewer-administered questionnaire, prepared in Afan
Oromo and Amharic, and administered using an electronic tablet. Supervisors transferred data to the central
database via a wireless Internet connection using the tablets. Details on the sampling procedure, measurement,
construction of aggregate variables, data collection procedures were reported elsewhere [16].
Seasonality of child growth
According to the Ethiopian National Meteorological
Agency, Ethiopia has four agricultural seasons based on the
average trends of the weather and rainfall. Summer (lean
season) includes 3 months such as June, July and August
characterized by heavy rainfalls. Spring (pre-harvest season)
includes September, October and November. Winter
(harvest season) includes December, January and February.
Autumn (post-harvest season) runs from March till and
May [17]. In summer (lean season), 97% of all crops and
96% of total cereals are cultivated. The pre-harvest season
and post-harvest are typically used as transition phases
between the lean and harvest seasons [18, 19].
For the present study, we considered the two main
cropping seasons in southwest Ethiopia: the pre-harvest
season (September – November) and post-harvest (late
February–May) [20].We collected data twice per year
during 2 years to assess seasonality of child growth. Data
from round one and three were conducted from
February 9 till April 9, 2014 and March 4 till May 01,
2015, which was the post-harvest season. Round two and
four were conducted from Sept 22 till November 19, 2014
and August 31 till October 29, 2015, which was the preharvest season.
Anthropometric data
A SECA weight scale and length/height boards were
used to measure weight and length/height with a precision of 100 g and 1 mm, respectively. Height of children
older than 24 months was measured standing while the
length of those younger than 24 months was measured
in recumbent position as recommended by WHO [21].
Fentahun et al. BMC Pediatrics (2018) 18:20
The height and weight of caretakers and children were
measured without shoes and light clothes [22].To account for differences due to measurement method,
0.7 cm was added to the height values before merging
them with the length data [21].
Growth velocity
Growth velocities were included height and weight velocity. Growth velocity is the change in measurements or
increments in weight and length/height from one visit to
the next visit. This provides information on growth
monitor progress. It indicates the velocity or the rate of
growth per unit of time [23].
Before calculating the growth velocity, we constructed
Lambda-Mu-Sigma Method (LMS method) which summarizes three curves representing the median (M), the coefficient of variation (S), and the skewness of distribution (L)
to pool the age of the child in different rounds [24, 25].
Similarly, length and weight increased much more rapidly
in first few months of life compared with the later ages. To
address this, age was transformed before smoothing of the
centile curve [26]. Growth velocities were calculated as
follows: V = Mn + 1 – Mn/Tn + 1-Tn, Mn and Mn + 1 were
measurements at adjacent occasions, and Tn + 1-Tn were
the time measurements at adjacent occasions [27].
Child growth deficits
Child growth deficits were included child linear growth
and weight gain. Child growth deficits are representative
of physical growth and indicate differences in size over a
period of time [21, 23]. We measured child growth deficits (linear growth and weight gain) for longitudinal data
using absolute value of height and weight according to
WHO recommendation [21].
Dietary diversity
A child dietary diversity score was calculated from 7 food
groups according to the World Health Organization
indicators for assessing infant and young child feeding
practices [28]: (i) grains and tubers; (ii) milk; (iii) vitamin
A-rich fruits/vegetables; (iv) other fruits, vegetables or
juices; (v) flesh foods (meat, fish, poultry and liver/organ
meats); (vi) egg and (vii) legumes. The household dietary
diversity score (HDDS) was calculated from 12 food
groups according to the Food and Agriculture
Organization [29] and includes (i) cereals; (ii) tubers and
roots; (iii) vegetables; (iv) fruits; (v) meat; (vi) eggs; (vii)
fish and other seafood; (viii) legumes, nuts and seeds; (ix)
milk and milk products; (x) oils and fats; (xi) sweets and
(xii) spices, condiments and beverages. Details of the
dietary diversity measurement and construction of high,
middle and low categories are reported elsewhere [16].
Page 3 of 9
Household food insecurity
Household food insecurity was measured using the household food insecurity access scale (HFIAS) that was previously validated for use in low-and middle-income countries
[30]. The household food insecurity measurement and
classification of food secure households, moderately food
insecure households and severely food insecurity households were applied to the study area earlier [16].
Morbidity
Mothers were asked if their child had any illness, diarrhea or a cough in the 2 weeks preceding the data
collection. The diagnosis of the three illnesses was based
on standardized assessment as used in the Demographic
Health Survey questionnaire [31]. Child morbidity was
self-reported by mothers.
Data quality
Before data collection, the questionnaire was pre-tested
on 5% of the total sample that was not included in the
final main sample. The pre-test was conducted in Yem
Special District in SNNP Region and Bedele District in
Oromiya region, which has similar characteristics as the
main sample. A 12-day intensive training was provided
to data collectors and supervisors prior to data collection. The training focused on how to ask questions, their
meaning, and how to record the answers. The trainees
were also encouraged to ask about issues that are
unclear, pay close attention, and take careful notes on
issues that they are not familiar. During and after data
collection, supervisors monitored the data collection
team to ensure their adherence to the study protocol. In
addition, the data manager checked all the data submissions from the field on a weekly basis.
Data analysis
The data were verified for distribution, missing values
and outliers, then cleaned and analyzed using STATA
version 11 for Windows (STATA Corporation, College
Station, TX, USA). We excluded children who had only
one observation during the follow-up survey from analysis. Exploratory analyzes were conducted to examine
the sample characteristics over the different measurements and rounds. The hierarchical nature of the data
was taken into account during the statistical analysis
using linear mixed effects model fitted with restricted
maximum likelihood estimation method. The models
were adjusted for age of the child, seasons of child birth,
sex of the child, any illness in the past 2 weeks, child
dietary diversity and household food insecurity classification. Multi-collinearity and interaction term were verified in the models. The results are in terms of parameter
estimates, standard errors and 95% confidence interval
(CI) expressing the findings.
Fentahun et al. BMC Pediatrics (2018) 18:20
Result
From the total sample, 579, 674,674 and 680 children
under age of 5 years were included in the analysis of
round one, two, three and four, respectively. Of the
children who were included in the analysis, nine (1.6%)
individuals in round two, nine (1.3%) individuals in
round three and 17(2.5%) individuals in round four had
missing data for all variables.
Overall, 50.8% female and 49.2% of male participated
in this study. The overall mean age of the children was
37.2 ± 16.6 months (i.e. round one = 28.8 ± 14.0 months,
round two = 34.2 ± 15.7 months, round three = 39.8 ±
15.8 months and round four = 45.1 ± 16.1 months).
More than half (55.4%) of the children were under
age of 12–36 months.
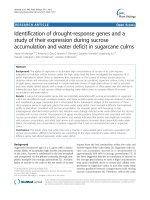
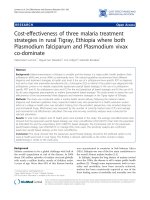
Figure 1 shows the median values for height and
weight velocity of the children by season and age. A
marked decrease in the growth velocity is observed from
the first year to the second year of the child. A higher
length and weight velocity were observed in pre-harvest
season compared with post-harvest season (length
velocity = 6.4 cm/year and weight velocity = 0.6 kg/year).
Female children showed the highest length velocity in
pre-harvest season with an average difference of
4.7 cm/year, while male children had the highest weight
velocity in pre-harvest season with an average difference of 0.6 kg/year.
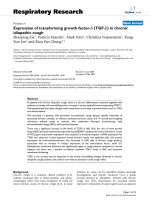
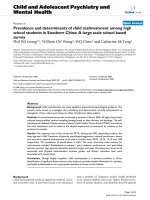
The growth of almost all children was between WHO
median and − 2 z-scores and with a similar growth trend
over time. Figure 2a & b shows the seasonal variation in
absolute mean length by age and sex of the children.
Children had a lower growth deficit compared to the
median in the post-harvest season than pre-harvest season. In the pre-harvest season, children had a mean
height of 4.3 cm below the heights that corresponded to
WHO reference, while post-harvest season children had
a height of 5.7 cm below the heights that corresponding
Page 4 of 9
to WHO reference. In the pre-harvest season, female
and male children had mean heights of 4.7 cm and
4.0 cm below the height corresponding to WHO Median
reference respectively. However, this deficit increased to
5.6 cm and 5.7 cm in the post-harvest season for female
and male respectively.
Table 1 explains the bivariate association of seasons
and exposure variables. Household food insecurity,
household dietary diversity, and type of individual food
groups consumed (i.e. vitamin A rich vegetables and
fruits intake, flesh foods in take, egg intake and legumes
intake) were significantly associated with seasonality.
Household food insecurity, vitamin-A rich vegetables
and fruits, flesh foods (meat, fish, poultry and liver/
organ meats) consumption were higher during the preharvest season, while household dietary diversity, egg,
and legume consumption were higher during the postharvest season.
Table 2 shows the association between seasons and
child growth deficit (linear growth and weight gain). The
absolute mean height of children increased on average
3.3 cm per year in pre-harvest season compared to the
post-harvest season. Similarly, the absolute mean weight
of children increased by 1.0 kg per year in pre-harvest
season compared to the post-harvest season.
Child linear growth had similar determinants in post
and pre-harvest seasons (Table 3). Children with a low
dietary diversity and born during the lean season had
lower linear growth in both seasons. Age of the child
was positively associated with child linear growth in
both seasons. Having experienced no illness during the
past 2 weeks and severely food insecure household on
the other hand was positively associated with child linear
growth in post-harvest season.
Factors associated with child weight gain were similar
in post and pre-harvest seasons (Table 4). Having a low
dietary diversity was negatively associated with child
Fig. 1 Median length (left) and weight velocity (right) of children in southwest rural Ethiopia by seasons and age, 2014–2015.
Post-harvest season.
Pre-harvest season
Fentahun et al. BMC Pediatrics (2018) 18:20
Page 5 of 9
a
b
Fig. 2 a Mean height of female children by year in post and pre harvesting seasons in southwest Ethiopia.
Post-harvest season.
Pre-harvest season. SD = World Health organization child growth standard reference − 2 standard deviation. Median WHO = World
Health organization child growth standard reference = 50%. b Mean height of male children by year in post and pre harvesting seasons compared
to the WHO reference 2006.
Post-harvest season.
Pre-harvest season. SD = World Health organization child growth
standard reference − 2 standard deviation. Median WHO = World Health organization child growth standard reference = 50%
weight gain in both seasons. However, being part of a severely food insecure household was negatively associated
with child weight gain in the pre-harvest season. Age of
the child, being male and no reported illness experience
during the past 2 weeks was positively associated with
child weight gain in both seasons.
Discussion
Children in low-and middle-income countries suffer
from sub-optimal growth due to seasonality of food
production, insufficient dietary intake, food insecurity,
morbidity, low use of agricultural technology and poor
market access [7–9]. To date however, only a few and
Table 1 Association between seasons and selected exposure
variables in southwest Ethiopia, 2014–15
Variables
Post-harvesting Pre-harvesting Pa
season
season
(N = 1253)
(N = 1354)
Household food insecurity,
Mean (SD)
5.4 (6.1)
6.8 (6.6)
0.001
Household dietary
diversity, Mean (SD)
3.9 (1.5)
3.7 (1.4)
0.001
Cereal intake, %
48.3
51.7
0.63
Vitamin A rich vegetables
and fruits intake, %
42.3
57.7
0.001
Flesh food intake, %
25.2
74.8
0.001
Egg intake, %
63.4
36.6
0.001
Dairy intake, %
50.4
49.6
0.19
mostly outdated studies have addressed seasonality of
child growth [13, 14]. This study determined seasonality
and determinants of child growth velocity and growth
deficit in rural southwest Ethiopia.
In the present study, the child growth velocity sharply
decreased between one to 2 years of age. The highest length
and weight velocity were observed in the pre-harvest
season. This finding is similar to a study conducted in
northwestern Iran where a sharp decrease in the velocity
growth charts from birth to 2 years of age was observed.
These charts have remained relatively stable up to 4 years
for both sexes [27].
Similarly to Australian findings [32], the present study
showed a higher growth velocity in the pre-harvest season compared to the post-harvest season. In the present
study however, the majority of pre-harvest data were
collected during a period where some farmers had
started to harvest crops. This is not unusual in Ethiopia
Table 2 Associations of seasons and child growth deficits over
a 2-year follow-up period in Southwest Ethiopia, 2014–15
Model 1: height
Estimate (95% CI)
Model 2: weight
SE
Estimate (95% CI)
SE
Fixed effects
Intercept
86.93 (86.10, 87.76)** 0.42 11.55 (11.34, 11.75)** 0.10
Seasons
Post harvest (ref)
Pre-harvest
3.34 (2.94, 3.73)**
0.20 1.01 (0.91, 1.11)**
0.05
Random-effects
Legume intake, %
51.4
48.6
0.001
Other fruit and vegetables
intake, %
48.9
51.1
0.46
Variance of
10.34 (3.94, 4.53)**
random intercept
0.30 2.54 (2.34, 2.69)**
0.07
0.021
2.9 (1.3)
2.8 (1.2)
0.77
Variance of
measurement
errors (residuals)
0.08 1.27 (1.23, 1.31)**
Child dietary diversity
score, Mean (SD)
a
Bivariate association was assessed using a Chi-square test
5.09 (2.57, 2.90)**
**Significant at p < 0.001, CI confidence interval
Fentahun et al. BMC Pediatrics (2018) 18:20
Page 6 of 9
Table 3 Linear growth deficit in the post-and pre-harvesting seasons over a 2-year follow-up period in Southwest Ethiopia, 2014–15
Model 1 post-harvest
Model 2 pre-harvest
Estimate (95% CI)
SE
Estimate (95% CI)
SE
66.59 (65.51, 67.68)**
0.55
67.79 (66.49, 69.09)**
0.66
0.35 (−0.62, 1.32)
0.50
0.31 (− 0.73, 1.35)
0.53
Fixed effects
Intercept
Seasons of child birth
Autumn (ref)
Spring
Summer
−0.99 (−1.93, −.04)*
0.48
−1.06 (−2.07, −.04)*
0.52
Winter
−0.35 (− 1.42, 0.71)
0.54
− 0.25 (− 1.39, 0.89)
0.58
0.60 (0.58, 0.62)**
0.01
0.58 (0.56, 0.60)**
0.01
0.41 (−0.25, 1.07)
0.34
0.67 (− 0.07, 1.40)
0.38
0.54 (0.03, 1.06)*
0.26
0.23 (−0.39, 0.86)
0.32
Medium
−0.39 (−0.94, 0.15)
0.28
−0.31 (− 0.93, 0.31)
0.32
Low
−1.21 (−1.80, −0.61)**
0.31
−1.44 (−2.12, −0.76)**
0.35
Moderately food insecure
0.40 (− 0.17, 0.96)
0.29
−0.17 (− 0.84, 0.50)
0.34
Severely food insecure
0.68 (0.06, 1.30)*
0.32
−0.38 (−1.11, 0.36)
0.38
Age of the child (months)
Sex of the child
Female (ref)
Male
Any illness in the past 2 weeks
Yes (ref)
No
Child Dietary Diversity
High (ref)
Household food insecurity
Food secure (ref)
Random-effects
Variance of random intercept
4.23 (3.94, 4.53)
0.15
4.41 (4.10, 4.75)
0.17
Variance of measurement errors (residuals)
2.73 (2.57, 2.90)
0.09
3.443 (3.26, 3.64)
0.10
*Significant at p < 0.05, **Significant at p < 0.001, ref Reference category, CI confidence interval
as the majority of vegetables, fruits and some cereals are
harvested early during the harvest season [18, 19].
In addition, the present study estimated that vitamin
A-rich vegetables and fruits, meat, fish, poultry and
liver/organ meats are consumed more in pre-harvest
season than post-harvest season. Contrary to our
findings, other studies have shown that child growth
velocity was lowest in pre-harvest season. Authors have
attributed this to distance to food source, food insecurity, health service utilization and child feeding practice
[33–36]. In the present study, the data collection period
might not have been totally reflecting the pre-harvest
season. Most of the data were collected early during
the harvest season during which the most cereals
were being harvested.
Female children had a higher length velocity but a
lower weight velocity than male children in both seasons. A study from Taiwan showed that female children
had lower length velocity than male children [37]. This
difference was attributed to gender differences in child
feeding, geographical factors. Therefore, appropriate
childhood interventions should be considered to prevent
childhood obesity and chronic disease development.
This study estimated that children were more likely to
increase their height and weight in pre-harvest compared to the post-harvest season. As described earlier,
pre-harvest data was partly collected early in the harvest season [18, 19] and children might have had
some access to cereals and other crops required for
child growth.
Belonging to a highly food insecure household was a
significant risk factor for lower child weight gain and a
protective factor for increased linear growth in preharvest and post-harvest seasons, respectively. Families
might have protected children during though shortages
of food in the household. During food insecure seasons,
families give priority to children and feed them first before the other household members. Previous evidence
Fentahun et al. BMC Pediatrics (2018) 18:20
Page 7 of 9
Table 4 Child weight gain in the post and pre harvest seasons over a 2-year follow up period in Southwest Ethiopia, 2014–15
Model 1 post-harvest
Model 2 pre-harvest
Fixed effects
Estimate (95% CI)
SE
Estimate (95% CI)
SE
Intercept
6.99 (6.65, 7.33)**
0.170
7.24 (6.88, 7.61)**
0.19
Spring
−0.02 (−0.31, 0.29)
0.15
0.01 (− 0.31, 0.32)
0.16
Summer
−0.35 (−0.64, −0.06)*
0.15
− 0.25 (− 0.56, 0.05)
0.16
Seasons of child birth
Autumn (Ref)
Winter
Age of the child (months)
−0.19 (−0.51, 0.14)
0.17
−0.11, (− 0.45, 0.23)
0.18
0.13 (0.13, 0.14)**
0.003
0.14 (0.13, 0.14)**
0.003
0.44 (0.24, 0.65)**
0.11
0.43 (0.22, 0.65)**
0.11
0.20 (0.04, 0.37)*
0.09
0.19 (0.02, 0.35)*
0.08
Sex of the child
Female (ref)
Male
Any illness in the past 2 weeks
Yes (ref)
No
Child dietary diversity
High (ref)
Medium
−0.15 (−0.33, 0.03)
0.09
−0.13 (−0.29, 0.04)
0.08
Low
−0.30 (−0.50, −0.11)**
0.10
− 0.39 (−0.58, −0.21)**
0.09
Household food insecurity
Food secure (ref)
Moderately food insecure
0.06 (−0.12, 0.25)
0.09
−0.15 (− 0.33, 0.02)
0.09
Severely food insecure
−0.08 (− 0.28, 0.12)
0.10
− 0.23 (−0.43, −0.03)*
0.10
Variance of Random Intercept
1.28 (1.18, 1.37)
0.05
1.39 (1.30, 1.48)
0.05
Variance of measurement errors (residuals)
0.91 (0.86, 0.97)
0.03
0.87 (0.83, 0.92)
0.03
Random-effects
**Significant at p < 0.001, *significant at p < 0.05, ref Reference category, CI confidence interval
strongly supports the inverse association of child
growth, food insecurity and household dietary diversity [12, 13, 32, 35, 38–40].
Children born during the lean season and with a low
dietary diversity had a lower linear growth in postharvest season compared to the pre-harvest season. Due
to seasonal variation in food insecurity and dietary
intake in developing countries, the season of childbirth
affects linear growth of children. Not only the season of
childbirth but also season of preconception and pregnancy is associated with child growth later in life. A
study conducted in rural Burkina Faso showed that birth
weight, birth length, intrauterine growth retardation, and
preterm birth showed significant seasonal variations.
Birth weights and birth lengths peaked at the end of the
dry season, more precisely in April and May [41].
A study conducted in the UK and Gambia showed that
season of birth was associated with birth weight, childhood growth and development, educational attainment
and puberty timing in women [42, 43].Therefore, adequate
nutrition of the mother and the child should consider
seasonality of child growth. The latter can have a profound impact on the child’s growth and development and
reduced disease risk, as well as on the protection of maternal health [44]. Undernutrition during pregnancy, affecting fetal growth, is a major determinant of stunting and
can lead to consequences such as obesity and nutritionrelated non-communicable diseases in adulthood [45].
Age of the child and reporting no illness experience in
past 2 weeks was positively associated with linear growth
and weight again in post-harvest season and the preharvest season. It was also observed that being male had
positive effect on weight again in post and pre-harvest seasons. Previous evidence showed that age and sex of the
child and illness experience in the past 2 weeks were determinants of weight again and linear growth [33, 38, 46].
Even though dietary diversity was significantly associated with stunting in all age groups, the association of
dietary diversity with linear growth was as observed as
age of the child increased [28].Therefore, dietary diversity and food frequency should consider the age of the
child. Similarly, developing countries should consider
Fentahun et al. BMC Pediatrics (2018) 18:20
seasonality of child growth in designing nutrition interventions to reduce the child growth faltering. Children in
such settings are still vulnerable to seasonal food shortages
due to rain-fed subsistence farming. Seasonality of food
availability increases exposure to food shortages affects
health of millions of the poor communities worldwide [3].
The strength of the study was its focus on seasonality
of growth. Estimates on seasonality of growth and it determinants among rural southwest Ethiopia can guide
planning, implementation and evaluation of integrated
promotion of complementary feeding and health seeking
behavior and household income generating activities options. Such knowledge can also strengthen partnership
between nutrition and agriculture to reduce vulnerability
to seasonal food shortages. However, the study did not
have data from all four seasons. In addition, we were
unable to collect data from the peak of the lean season. A
comparison of the lean season and post-harvest season
may have shown different and more pronounced results.
Increased seasonal nutrition surveillance, which includes
all four seasons, should be conducted to understand the
seasonality of child growth velocity and deficits.
Page 8 of 9
Availability of data and materials
The datasets supporting the finding and conclusion of this article are included
within the article. The data that support the findings of this study are available
from Tuft University, USA but restrictions apply to the availability of these data,
which were used under license for the current study, and so are not publicly
available. Data are however available from the authors upon reasonable request
and with permission of Tuft University, USA.
Authors’ contributions
NF, CL and TB designed and supervised the study, ensured the quality of the
data and assisted in the analysis and interpretation of the data. JC assisted
interpretation of the data and manuscript preparation. NF, the corresponding
author, did the analysis, drafted the manuscript, and submitted the
manuscript for publication. All authors critically reviewed and approved
the final manuscript.
Ethics approval and consent to participate
Ethical approval was obtained from the Institutional Review Board of the
College of Health Sciences of Jimma University, Ethiopia, and the Institutional
Review Boardof Tufts University, USA. Written permission was obtained from
each responsible body and informed verbal consent was obtained from each
study participant. We received a waiver of documentation of informed consent
from the Institutional Review Boards. The letter stated that respondents do not
need to sign the consent statement because many are illiterate. However, there
was a place on the form for the enumerator to sign in order to indicate that
participants have read the consent form and that the person had agreed to
participate. Data were registered and stored anonymously, and the
questionnaire was administered in a confidential way.
Consent for publication
NA
Conclusion
The study examined seasonality and determinants of child
growth velocity and growth deficit in rural southwest
Ethiopia. Child growth velocities were higher in the preharvest season than post-harvest season. Children had a
higher child growth deficit in the post-harvest season than
pre-harvest season corresponding to WHO reference.
Child growth deficits had almost similar determinants in
post and pre-harvest seasons. Being born during the lean
season, a low dietary diversity, belonging to a highly food
insecure household and reporting illness experienced during the past 2 weeks were negatively associated with child
linear growth and weight gain in rural southwest Ethiopia.
Complementary feeding and early health seeking education and household income generating activities options
should be design to solve seasonality of child growth
velocity and deficit in rural communities in low-and
middle-income countries.
Abbreviations
ENGINE: Empowering New Generations to Improve Nutrition and Economic
Opportunities; HDDS: household dietary diversity score; HFIAS: household
food insecurity access scale; UK: United Kingdom; UNICEF: United Nations
International Children’s Emergency Fund; USAID: United States Agency for
International Development; WHO: World Health Organization
Acknowledgements
We acknowledge USAID-ENGINE for supporting this study. We also acknowledge
the study participants, data collectors and supervisors for contribution of
accomplishing the study successfully.
Funding
The study was funded by USAID-ENGINE.
Competing interests
The authors declare that they have no competing interests. The contents of
this document are the sole responsibility of the researchers.
Publisher’s Note
Springer Nature remains neutral with regard to jurisdictional claims in
published maps and institutional affiliations.
Author details
1
Department of Health Education and Behavioral Sciences, College of Health
Sciences, Jimma University, Jimma, Ethiopia. 2Department of Population and
Family Health, College of Health Sciences, Jimma University, Jimma, Ethiopia.
3
Friedman School of Nutrition Science and Policy, Feinstein International
Center at Tufts University, Boston, USA. 4Department of Food Safety and
Food Quality, Faculty of Bioscience Engineering, Ghent University, Ghent,
Belgium. 5School of Public Health Engineering, Bahir Dar University, Bahir
Dar, Ethiopia.
Received: 28 October 2016 Accepted: 16 January 2018
References
1. Ferro-luzzi A, Morris SS, Amato MD, Nazionale I. Seasonal Undernutrition in
Rural Ethiopia:Magnitude, Correlates, and Functional Significance. Int Food
Policy Res Inst. 2001; Research Report 118; International Food Policy Res.
2. Ma CM, Segural JL, Bern C, Freedman DS, Lescanol AG, Luis E, et al. Seasonal
change in nutritional town in Peru status among young children in an
urban shanty. Trans Soc. 1996;90:442–5.
3. Prentice AM, Cole TJ. Seasonal changes in growth and energy status in the
third world. Proc Nutr Soc. 1994;53:509–19.
4. Aggarwal PK, Benli B, Bhatia VS, et al. Rainfed agriculture :unlocking the
potential. Reading: Columns Design Ltd; 2009.
5. Handa S, Hill C, Mlay G. Food consumption patterns, seasonality, & market
access in Mozambique. 1998.
6. IPCC. Summary for policymakers. In: Climate Change 2014: Impacts,
Adaptation, and Vulnerability. Cambridge University Press, Cambridge,
United Kingdom and New York, NY, USA. Part A Glob Sect Asp Contrib
Work Gr II to Fifth Assess Rep theII ntergovernmental Panel Clim Chang.
2014;(1–32).
Fentahun et al. BMC Pediatrics (2018) 18:20
7.
8.
9.
10.
11.
12.
13.
14.
15.
16.
17.
18.
19.
20.
21.
22.
23.
24.
25.
26.
27.
28.
29.
30.
31.
32.
33.
Nelson GC, Rosegrant MW, Palazzo A, Gray I, Ingersoll C, Robertson R, et al.
Food security, farming, and climate change to 2050: scenarios, results, policy
options. Research reports IFPRI. 2010.
Tirado MC, Crahay P, Hunnes D, Cohen M, Denton FLA. Climate change and
nutrition in Africa with a focus on sub-Saharan Africa. SUNRAY Africa. 2007;1:1–24.
Lloyd SJ, Kovats RS, Chalabi Z. Climate change, crop yields, and
Undernutrition: development of a model to quantify the impact of climate
scenarios on child Undernutrition. Env Heal Perspect. 2011;119:1817–23.
Blössner M, De Onis M, Prüss-üstün A, Campbell-lendrum D, Corvalán C,
Woodward A. Malnutrition quantifying the health impact at national and
local levels; 2005. p. 12.
Arsenault JE, Nikiema L, Allemand P, Ayassou KA, Lanou H, et al. Seasonal
differences in food and nutrient intakes among young children and their
mothers in rural Burkina Faso. J Nutr Sci. 2014;3(e55):1–9.
Maleta K, Virtanen SM, Espo M, Kulmala T, Ashorn P. Seasonality of growth
and the relationship between weight and height gain in children under
three years of age in rural Malawi. ActaPædiatr. 2003;92:491–7.
Ahamad MG, Khondker RK. Seasonal food insecurity in Bangladesh:
evidences from northern areas. Mitig Adapt Glob Chang. 2013;18:1077–88.
Hillbruner C, Egan R. Seasonality household food security, and nutritional
status in Dinajpur, Bangladesh. Food Nutr Bull. 2015;29(3):221–31.
Magnani R. Sampling guide:ood and nutrition technical assistance project
(FANTA). 1999.
Fentahun N, Belachew T, Lachat C. Determinants and morbidities of
multiple anthropometric de fi cits in southwest rural Ethiopia. Nutrition.
2016;32(11–12):1243–9.
Climate/Ethiopia. Glocal Community Development Studies; Country Profile.
[Internet]. Available from: accessed 19 Jul 2017.
Bergene; Tegegn. Climate change/variability, food security status and
people’s adaptation strategies in damot woyde woreda, Wolaita zone.
SNNPR ETHIOPIA: Master Thesis; 2014.
Taffesse AS, Dorosh P AS. Crop Production in Ethiopia: Regional Patterns
and Trends. Int Food Policy Res Inst Ethiop Dev Res Inst. Research
n(Essp Ii):2012.
Egata G, Berhane Y, Woerku A. Seasonal variation in the prevalence of acute
undernutrition among children under five years of age in east rural Ethiopia:
a longitudinal study. BMC Public Health. 2013;13(1):1.
WHO Multicentre Growth Reference Study Group. Growth velocity based on
weight, length and head circumference: WHO Child Growth Standards.
Dep Nutr Heal Dev. 2009.
WHO. Nutritional landscape information system: country profile indicators.
Interpret Guid. 2010;10:1–39.
Chumlea WC, Sun SS. Use of physical growth measurements to assess
infant growth: birth to 6 months of age. 2002.
Flegal KM. Curve smoothing and transformations in the development of
growth curves. Am J Clin Nutr. 1999;70:163s–5s.
Cole TJ, Stanojevic S, Stocks J, Coates AL, Hankinson JL, Wade AM. Age- and
size-related reference ranges: a case study of spirometry through childhood
and adulthood. Stat Med. 2009;28:880–98.
Abhaya I. Demystifying LMS and BCPE methods of Centile estimation for
growth and other health parameters. Indian Pediatr; 2014. p. 51.
Ghaemmaghami P, Mohammad S, Ayatollahi T, Alinejad V, Haem E.
Longitudinal standards for growth velocity of infants from birth to 4 years
born in West Azerbaijan Province of northwest Iran. Epidemiol Health.
2015;37(e2015029 is):1–6.
WHO. Indicators for assessing infant and young child feeding practices.
Part 3 Ctry profiles; 2010. p. 1–47.
FAO. Guidelines for measuring household and individual dietary diversity.
Nutr Consum Prot Div. 2008;(December):1–21. ISBN 978-92-5-106749-9.
Coates J, Swindale A, Bilinsky P. Household food insecurity access scale
(HFIAS) for measurement of food access: indicator guide. Washington: DC
Food Nutr Tech; 2007. Version 3
EDHS. Ethiopia demographic and health survey. 2012;(March).
Miller J, Ritchie B, Bs MB, Tran C, Beggs S, Bs MB, et al. Seasonal variation in
the nutritional status of children aged 6 to 60 months in a resettlement
village in west Timor. Asia pacific J Clin Nutr. 2013;22(April):449–56.
Shell-duncan B. Impact of seasonal variation in food availability and disease
stress on the health status of nomadic Turkana children: a longitudinal
analysis of morbidity, immunity, and nutritional status. Am J Hum Biol.
1995;7:339–55.
Page 9 of 9
34. Schwinger C, Lunde TM, Andersen P, Kismul H, Van Den Broeck J. Seasonal
and spatial factors related to longitudinal patterns of child growth in
Bwamanda. DR Congo Earth Perspect. 2014;1:26.
35. Nord M, Kantor LS. Seasonal variation in food insecurity is associated with
heating and cooling costs among low-income elderly Americans 1. J Nutr.
2006;136:2939–44.
36. Black E. Seasonal prevalence of young changes in nutritional status and of
malnutrition in a longitudinal children in rural Bangladesh13 the study.
Am J Clin Nutr. 1982;36:303–13.
37. Lee TS, Chao T, Tang RB, Hsieh CC, Chen SJ, Ho L-T. A longitudinal study of
growth patterns in school children in Taipei area I: growth curve and height
velocity curve. J Chin Med Assoc. 2004;67:67–72.
38. Rah JH, Akhter N, Semba RD, Pee SD, Bloem MW, Campbell AA, et al. Low
dietary diversity is a predictor of child stunting in rural Bangladesh.
Eur J Clin Nutr. 2010;64(12):1393–8.
39. Shinsugi C, Matsumura M, Karama M, Tanaka J, Changoma M. Factors
associated with stunting among children according to the level of food
insecurity in the household: a cross-sectional study in a rural community of
southeastern Kenya. BMC Public Health. 2015;15(441):1–10.
40. Dos Santos LP, Gigante DP. Relationship between food insecurity and
nutritional status of Brazilian children under the age of five Relação entre
insegurança alimentar e estado nutricional de crianças. Brazilian J Epidemiol.
2013;16(151694):984–94.
41. Toe LC, Bouckaert KP, Beuf K De, Roberfroid D, Meda N, Thas O, et al.
Seasonality Modifies the Effect of a Lipid-Based Nutrient Supplement for
Pregnant Rural Women on Birth Length 1–3. J Nutr. 2015;145(3):634-9.
42. Day FR, Forouhi NG, Ong KK, Perry JRB. Season of birth is associated with
birth weight, pubertal timing, adult body size and educational attainment: a
UK Biobank study. Heliyon. 2015;(e00031):1–16.
43. Gajigo O and Schwab B. The Rhythm of the Rains : Seasonal Effects on
Child Health in The Gambia +. Int Assoc Agric Econ Trienn Conf. 2012;1–47.
44. USAID. Multi-Sectoral Nutrition Strategy 2014–15. Tech Guid Br. 2014;1–7.
45. The Lancet. Maternal and child nutrition:Executive Summary of the Lancet
maternal and child nutrition Series. Lancet. 2013.
46. Xu X, Wang WP, Guo ZP, Cheung YB, Karlberg J. Original Communication
Seasonality of growth in Shanghai infants (n ˆ 4128) born in 11 consecutive
years. Eur J Clin Nutr. 2001;55:714–25.
Submit your next manuscript to BioMed Central
and we will help you at every step:
• We accept pre-submission inquiries
• Our selector tool helps you to find the most relevant journal
• We provide round the clock customer support
• Convenient online submission
• Thorough peer review
• Inclusion in PubMed and all major indexing services
• Maximum visibility for your research
Submit your manuscript at
www.biomedcentral.com/submit