Nghiên cứu độc tính và tác dụng hạ glucose máu của viên andiabet trên thực nghiệm tt tiếng anh
Bạn đang xem bản rút gọn của tài liệu. Xem và tải ngay bản đầy đủ của tài liệu tại đây (355.22 KB, 25 trang )
1
INTRODUCTION
Type 2 diabetes mellitus (T2D) is a metabolic disorder with
complex mechanisms and pathophysiological abnormalities. It is
extremely hard to reverse T2D disease state with monotherapy. Thus
combination therapy is becoming a promising alternative choice in
clinical practice by designing drug combinations or compound drugs
to interact with multiple targets and achive synergitic treatment effect.
For example, traditional Vietnamese medicines are attracting more
attentions for their efficacy and less frequent side effects for treating
T2D. Lagerstroemia speciosa (L.) Pers; Gynostemma pentaphyllum
(Thunb.) Makino; Anemarrhenae Aspheloides (Bunge) has been
reported to alleviate hyperglycemia and hyperlipemia in many
preclinical and clinical studies and have been combined into the soft
form of Vinabetes. However, Vinabetes has only been extracted in
laboratory and there are no adequate pharmacological studies.
Andiabet is a compound of 3 Vietnamese herbal medicines
composition above. The aim of this study was to investigate the
toxicity and the hypoglycemic effect of Andiabet in experimental
animals with the following objectives:
1. Determine of acute toxicity and longterm toxicity by Andiabet.
2. Evaluate the hypoglycemic effect and several hypoglycemic
mechanisms of Andiabet tablets in experiment.
Chapter 1. OVERVIEW
1.1. OVERVIEW ABOUT THE DIABETES MELLITUS
1.1.1. Definition, classification, diagnostic criteria for diabetes and
pathogenetic mechanism of diabetes type 2
1.1.1.1. Definition “Diabetes is a metabolic disorder characterized by
hyperglycemia, the result of a deficiency of insulin secretion; impaired
functioning of insulin; or both. Chronic hyperglycemia is often
2
associated with damage, disorders and impaired function of many
organs, especially the eyes, kidneys, nerves, heart and blood vessels.”
1.1.1.2. Classification: Diabetes is divided into 4 types: diabetes type
1, type 2, diabetes pregnancy and special types. In which, type 1 and
type 2 diabetes is most common.
1.1.1.3. Diagnostic criteria for diabetes
Four diagnostic tests for diabetes are currently recommended,
including measurement of fasting plasma glucose; 2-hour (2-h) postload plasma glucose after a 75 g oral glucose tolerance test (OGTT);
HbA1c; and a random blood glucose in the presence of signs and
symptoms of diabetes. People with fasting plasma glucose values of ≥
7.0 mmol/L (126 mg/dl), 2-h post-load plasma glucose ≥ 11.1 mmol/L
(200 mg/dl), HbA1c ≥ 6.5% (48 mmol/mol); or a random blood
glucose ≥ 11.1 mmol/L (200 mg/dl) in the presence of signs and
symptoms are considered to have diabetes
1.1.1.4. Pathogenetic mechanism of diabetes type 2
Insulin resistance in peripheral tissues and insulin secretion
disorders are two important and related closely factors in the
pathogenesis of type 2 diabetes, which usually occurs before the
clinical manifestations of diabetes (from the pre-diabetes phase).
However, in patients with type 2 diabetes who are not overweight, the
manifestation of insulin secretion is the opposite, whereas in type 2
diabetes patients with obesity, insulin resistance is the main condition.
Genetic and environmental factors play a role in promoting disease
development and development.
1.2. GROUPS OF MEDICINE TREATMENT FOR DIABETES
Currently, in addition to lifestyle adjustment (diet and exercise), drugs
should be used to treat of type 2 diabetes. The drugs for treatment of
type 2 diabetes focus on the following main groups:
1.2.1. Drugs stimulate insulin secretion include: KATP channel
3
inhibitors are: sulfonylurea and meglitinide. The incretin modulators
are: GLP-1 analogues: Exenatid, Liraglutid, Lixisenatid and DPP-4
inhibitors: sitagliptin, vildagliptin, saxagliptin, linagliptin, alogliptin.
1.2.2. Drugs reduce insulin resistance include: metformin and
thiazolidinedion: pioglitazon
1.2.3. Drugs reduce/slow absorption of glucid: drugs a-glucosidase
inhibitors include: acarbose (Precose, Glucobay) and miglitol (Glyset).
1.2.4. Drugs increase renal glucose excretion: SGLT2 inhibitors are:
Dapagliflozin, Canagliflozin and Empagliflozin
1.3. SEVERAL DIABETIC RESEARCH METHODS IN
EXPERIMENTANT
1.3.1. The invivo research model.
1.3.1.1. Models of type 1 diabetes: Spontaneous type 1 diabetes (T1D)
models and secondary T1D models induced by chemicals, removing
pancreas or virus.
1.3.1.2. Models of type 2 diabetes: Obese and non-obese spontaneous
T2D rodents models. Secondary T2D models: induced by chemicals
or a high-fat diet combined with low-dose STZ and by genetic
modification.
1.3.1.3. Several methods to evaluate hypoglycemic effect in invivo:
Assessing the ability of the drug on glucose tolerance test,
polysaccharide absorption. Assessing the drug’s effect of increasing
insulin sensitivity to the target tissue via the technique
"Hyperinsulinemic - euglycemic clamp test"
1.3.2. The invitro research model.
The invitro research model can be divided into two categories:
assessing the of drug’s effect on organs, isolated cells and on enzymes
involved glucose homeostasis.
1.4. OVERVIEW COMPONENTS OF ANDIABET AND
RESEARCHS RELATED TO ANDIABET
4
Lagerstroemia speciosa (L.) Pers; Gynostemma pentaphyllum
(Thunb.)Makino; Anemarrhenae aspheloides (Bunge) was estimated
for hypoglycemic virtue in many preclinical and clinical studies and
have been combined into the soft form of Vinabetes. Vinabetes with a
1,5:1,5:1 weight ratio of the three herbal composition, similar to
Andiabet was performed acute toxicity test and LD50 dose was 42.98
g/kg mice. Vinabetes has also been studied for long term toxicity test in
rabbits for 4 weeks at 2 doses of 1.8 g/kg/day and 3.6 g/kg/day. Vinabetes
at the doses for 4.5g/kg and 9g/kg for 4 consecutive weeks in normal
mice displayed significantly reducing blood glucose levels (by 34 %
and 44 %, respectively) compared to the control (p<0.05). In the
diabetics rat, Vinabetes at a dose of 3 g/kg/day for 2 weeks, blood
glucose levels decreased by 44%. However, Vinabetes has only been
extracted in laboratory conditions and there are no adequate
pharmacological studies. Andiabet a compound of 3 herbal remedy
above, for the first time was standardized raw materials and was
extracted, manufactured according to industrial processes. This study
investigates the hypoglycemic effect and several hypoglycemic
mechanisms of Andiabet in experiment with the desire to create an
effective diabetes treatment drug.
Chapter 2: MATERIALS AND METHODS
2.1. MATERIAL
2.1.1. Material: Andiabet is a hard capsule includes 200 mg of dried
leaves (Lagerstroemia speciosa (L.) Pers) 70% alcoholic extract with 200
mg of dried stems, roots, leaves Gynostemma pentaphyllum (Thunb.)
Makino water extract and 133 mg dried root Anemarrhenae Aspheloides
(Bunge) extracted 50% alcohol. Weight of one capsule is 590 mg. The
inoculants are manufactured according to basic standards and supplied by
Traphaco Joint Stock Company, Hanoi.
2.1.2. Animals: Normal Swiss mice (both sexes, weighing 18 - 22g
5
each) and Newzealand White rabbits (both sexes, weighing 1,8 – 2,5
kg each) obtained from Central Hygienic and Epidemiologic Institude
were housed at 24±20C and provided with food and water ad libitum.
2.1.3. Chemicals. Streptozotocin (Sigma-Aldrich, Singapore).
Diamicron (gliclazid) 30mg (Servier, France). Blood glucose meter and
glucose kit (On Call Plus, ACON Biotech, America). Triglycerid kit
and total cholesterol kit (DIALAB GmbH, Austria).
2.2. EXPERIMENT DESIGN
2.2.1. Method of the acute and long term toxicity test
2.2.1.1. Acute toxicity test (following WHO guidelines)
The mice were randomized into many groups of 10 animals in each.
In all group, mice were given an equal volume (0.2ml/10g) of Andiabet
with increasing doses up to a highest dose of 44.25g/kg mice. The mice
were observed for 4 consecutive hours, the number of mice was died in
the first 72 hours were counted and the whole body condition in 7 days
after treatment were reported. LD50 dose was determined according to
Litchfield - Wilcoxon method.
2.2.1.2. Long term toxicity test (following WHO guidelines)
Rabbits are given two doses of Andiabet: 0.21 g/kg/day
(equivalent to the expected dose in human) and 0.64 g/kg/day (3 times
the expected dose in humans) for 90 consecutive days . Assess general
condition and weight change. Evaluate hematopoietic function, liver,
kidney function, liver and kidney histopathology of rabbits
2.2.2. Evaluate the hypoglycemic effect and several hypoglycemic
mechanisms of Andiabet tablets in experiment.
2.2.2.1. Hypoglycemic effect of Andiabet in normal mice.
The mice were randomized into 4 groups of 10 animals in each.
- Group 1 (Control):
received with distilled water
- Group 2 (positive control): received with gliclazid 80 mg/kg.
- Group 3 (Andiabet 0,68g/kg): received with Andiabet 0,68 g/kg/day
6
- Group 4 (Andiabet 2g/kg): received with Andiabet 2g/kg/day
Mice were given distilled water or reagents continuously for 2 weeks
in the mornings. Blood samples were collected at times: start the
treatmnet (to); 1 week (t1) and 2 weeks after oral the reagent (t2).
2.2.2.2. Hypoglycemic effect of Andiabet in T2D mice.
- Phase 1: High- fat diet combined with low dose STZ-induced diabetic
mice model. Mice is divided into 2 groups: Group 1 (n = 10 animals)
eating a normal fat diet (NFD). Group 2 (n = 100 animals): eating a
high fat diet (HFD). After 8 weeks, diabetes was induced by a single
i.p injection of STZ (100mg/kg) for all mice in group 2, and mice in
group 1 were injected by solvent of STZ. Blood samples were taken at
3 points: start the study, before injection of STZ and 72 hours after
injection of STZ. 72 hours after injection of STZ or solvent, animals
which glucose level develop more than 10 mmol/L were selected.
- Phase 2: Assess the hypoglycemic effect of Andiabet in type 2
diabetic mice.The animals were randomly assigned to one of six
groups of 10 mice each. The first group were regarded as control
group, eating a normal fat diet. The type 2 diabetic (T2D) mice divided
into 5 groups from second to sixth groups were studied for the
hypoglycemic effect of Andiabet.
- Group 1 (control): NFD mice received with saline
- Group 2 (nontreatment): T2D mice received with distilled water
- Group 3 (positive control):T2D mice + gliclazid 80 mg/kg.
- Group 4 (Andiabet 0,68 g/kg):T2D mice + Andiabet 0,68g/kg/d.
- Group 5 (Andiabet 1 g/kg): T2D mice + Andiabet 1 g/kg/d.
- Group 6 (Andiabet 2 g/kg): T2D mice + Andiabet 2 g/kg/d.
After being orally administered with the reagent for 2 consecutive
weeks, Evaluate: weight of mice after 2, 4, 6 and 8 weeks had a high
fat diet. The average blood glucose levels measured at times: t0, t1, t2.
Lipid profiles: TC, TG, HDL-C, LDL-C. Observe the histopathology,
7
weight of liver and pancreas.
2.2.2.3. Evaluate inhibitivity on hyperglycemic postprandial blood
glucose of Andiabet in glucose/sucrose/starch tolerance test in normal
and diabetic mice.
s Evaluate inhibitivity on hyperglycemic postprandial blood glucose
of Andiabet in glucose/sucrose/starch tolerance test in normal mice.
The normal animals were classified into 5 groups (10
mice/groups):
- Group 1 (Control): received with distilled water
- Group 2 (positive control): received with Acarbose 14 mg/kg/d.
- Group 3 (positive control): received with Metformin 250mg/kg/d
- Group 4 (Andiabet 1g/kg): received with Andiabet 1 g/kg/d.
- Group 5 (Andiabet 2g/kg): received with Andiabet 2 g/kg/day
Mice were given distilled water or reagents continuously for 2 weeks
in the mornings. The 15th day, glucose (2g/kg-oral) was administered to
the mice in each group (glucose tolerance test) or sucrose at 4 g/kg was
administered to the mice in each group (sucrose tolerance test) or potato
starch at 6 g/kg was administered to the mice in each group (starch
tolerance test). Blood samples were taken at 30, 60, 120 min after the
glucose/sucrose/starch load for the assay of glucose/sucrose/starch.
Evaluation: peak blood glucose (PBG) - The maximum blood glucose
level of the whole group after loading glucose/sucrose/starch. The area
under of curve (AUC) is calculated following formula:
!"#!$"
!$"#!&"
AUC = ( % ) x (t30 – t0) + (
) x (t60 - t30) +
%
!&"#!'%"
(
) x (t120 - t60)
%
In which, C0, C30, C60, C120 are measured blood glucose levels at the
times: before use drugs (t0), 30 minutes (t30), 60 minutes (t60) and 120
minutes (t120).
s Evaluate inhibitivity on hyperglycemic postprandial blood glucose of
Andiabet in glucose/sucrose/starch tolerance test in T2D diabetic mice.
8
Performed on type 2 diabetes mice, similar to that in normal mice.
2.2.2.4. Antagonism with insulin resistance of Andiabet in type 2
diabetic mice model.
The diabetic mice were divided into 4 groups (7 mice/group), given
reagents or distilled water for 2 consecutive weeks.
- Goup 1 (control): Normal mice received with distilled water
- Group 2 (nontreatment):T2D mice received with distilled water
- Group 3 (Andiabet 1g/kg): T2D mice + Andiabet 1g/kg/day
- Group 4 (Andiabet 2g/kg): T2D mice + Andiabet 2g/kg/day
On the 15th day, the technique "Hyperinsulinemic - euglycemic
clamp test" was used to assess insulin resistance. A blood sample was
collected from the mouse tail, at the time (t0). Insulin was infused
continuously and maintained a constant speed at a rate of 4 mU/kg/min,
throughout the experiment. Glucose (20%) was infused
stimultaneously: the blood glucose concentration measured at the time
(t0) was able to determined the rate infusion. Then, the blood samples
were measured every 10 minutes, glucose infusion rate (GIR) was
adjusted continuously (blood glucose levels were always ~ 7.5 - 8.3
mmol/L). Blood glucose concentration, glucose infusion rate at the
“steady state” (from 80 - 120 minutes) were compared vs control group.
2.3. STATISTICS
All data were expressed as mean ± SE. Student's t-test and one-way
ANOVA was used for statistical analysis. Significantly different when the
p < 0.05.
Chapter 3: RESULT
3.1. ACUTE TOXICITY AND CHRONIC TOXICITY OF
ANDIABET
3.1.1. Acute toxicity test: The mice in all groups were observed
within the first 72 hours after taking the Andiabet, we noticed
that in the all of doses groups: Mice displayed operation, eating and
9
drinking normally; feces and urine normally; pink lining, silky hairs
and mice had good reflexes with the stimulations. In higheast dose
group were 44,25 g/kg mice, none of the dead mice were observed
within the first 72 hours. Such that, Andiabet has no acute toxicity at a
dose of 44.25 g/kg and LD50 dose has not been determined.
3.1.2. Chronic toxicity test
Andiabet at 2 dose levels: 0.21g/kg/day and 0.64g/kg/day orally
for 90 consecutive days without any changes in hematological and
blood biochemical indices and histopathology of liver and rabbit
kidney.
3.2.
HYPOGLYCEMIC
ACTIVITY
AND
SEVERAL
HYPOGLYCEMIC MECHANISMS OF ANDIABET IN
EXPERIMENTAL.
3.2.1. Hypoglycemic effect of Andiabet in normal mice.
Table 3.1.Blood glucose levels of normal mice after 2 weeks taking Andiabet
Groups
(n = 10)
Blood glucose levels (mmol/l) (X ± SD)
To
T1
T2
Group 1: control
3,53 ± 0,72
4,99 ± 1,14
4,97 ± 0,92
Group 2: Gliclazid 80mg/kg
3,55 ± 0,51
4,12 ± 0,58*
3,95 ± 0,72**
↓ 17,44 %
↓ 20,52 %
5,03 ± 0,25
4,26 ± 0,44*
-
↓ 14,3 %
4,92 ± 0,79
4,12 ± 0,61*
↓ 1,4 %
↓ 17,1 %
% reduced vs control
Group 3: Andiabet 0,68g/kg
3,34 ± 0,21
% reduced vs control
Group 4: Andiabet 2 g/kg
% reduced vs control
3,40 ± 0,60
p vs control: *: p < 0,05; **: p < 0,01.
Comment: At the time T0, blood glucose levels in all mice groups was
similar (p > 0.05). The positive control group was used gliclazide 80
mg/kg had a significant hypoglycemic effect 17.44% and 20.52%,
respectively after 1 week (T1) and 2 week (T2), compared to the control
10
group (p<0,01). Andiabet at the dose 0.68 g/kg mice and 2g/kg mice after
2 week (T2) displayed significantly reducing blood glucose levels (by
14.3 % and 17.1 %, respectively) compared to the control (p < 0.05).
3.2.2. Hypoglycemic effect of Andiabet in T2D mice.
3.2.2.1. Changes in mouse’s weight after a high-fat diet
Table 3.2. Changes in mouse’s weight at diferent times
Weight (g) (X ± SD)
Times
Groups NFD (n = 10)
Start
25,45 ± 0,98
After 4 weeks
group 1
> 0,05
29,60 ± 1,15***
37,17 ± 1,89***
< 0,001
↑ 16,3
↑ 42,5
33,60 ± 1,43***
42,89 ± 1,93***
↑ 32,0
↑ 64,4
35,90 ± 1,45***
48,47 ± 2,27***
↑ 41,1
↑ 85,8
% increased
After 8 weeks
Groups HFD (n = 100)
26,09 ± 1,30
% increased
After 6 weeks
p vs
% increased
< 0,001
< 0,001
***: p < 0,001: vs before study time.
Comment: The weight of mice in the HFD group increased
respectively by 42.5 %; 64.4 % and 85.8 % after 4, 6 and 8 weeks,
compared to the control group (p <0.001).
3.2.2.2. Changes blood glucose levels in diabetic mice
Table 3.3. Changes blood glucose levels after HFD 8 weeks
Glucose levels (mmol/l) (X ± SD)
Times
Groups NFD
Groups HFD
p vs
(n=10)
(n=100)
group 1
Start
5,37 ± 0,56
5,56 ± 1,02
> 0,05
After 8 weeks
5,77 ± 0,67
6,32 ± 0,93
> 0,05
% change
↑ 7,4
↑ 13,7
72h after injection of STZ
5,98 ± 0,92
17,09 ± 6,33***
% change
↑ 11,4
↑ 207,4
< 0,001
11
***: p < 0,001: p vs before study; (∆∆∆): p < 0,001: p vs after 8 weeks
Comment: 72h after injection of STZ, blood glucose levels in HFD
group increased strongly (207,4%) compared with control group
(increased 11,4%) (p < 0,001) and before injection of STZ (p < 0,001).
3.2.2.3. Hypoglycemic effect of Andiabet in T2D mice.
Table 3.4. Effect of Andiabet on blood glucose levels of T2D diabetic mice
Blood glucose levels (mmol/l) (X ± SD)
Group (n=10)
To
T1
T2
G1: control
5,54 ± 0,86
5,51 ± 0,81
5,46 ± 0,46
G2: nontreatment
17,88 ± 6,23
18,38 ± 4,46
18,38 ± 4,39
G3: Gliclazid 80mg/kg
17,36 ± 5,26
14,18 ± 5,23*
13,83 ±3,45**
↓ 22,9 %
↓ 24,8 %
13,99 ± 3,61*
16,71 ± 4,46
↓ 23,9 %
↓ 9,1%
17,53 ± 3,61
11,83 ± 3,91**
↓ 4,6 %
↓ 35,6 %
11,69 ± 3,78**
14,84 ± 5,01*
↓ 36,4 %
↓ 19,3 %
% reduced vs nontreatmnet
G4: Andiabet 0,68g/kg
17,89 ± 6,3
% reduced vs nontreatment
G5: Andiabet 1g/kg
19,23 ± 6,3
% reduced vs nontreatment
G6: Andiabet 2g/kg
% reduced vs nontreatment
18,04 ± 5,27
p vs nontreatment: *: p < 0,05; **: p < 0,01; ***: p < 0,001.
Comment:
At 1week oral administration, Andiabet at doses (0.68g/kg and 2g/kg)
markedly reduced blood glucose levels (by 23,9% and 36,4%,
respectively) compared to the nontreatment (p <0.05 and p <0.01).
Andiabet at doses (1g/kg) had a significant hypoglycemic effect up to
35.6% after 2 weeks oral administration (p <0.01).
3.2.2.4. Hypolipidemic effect of Andiabet in high food diet with STZinduced type 2 diabetic mice.
Table 3.5. Effect of Andiabet on lipid profiles of T2D mice
12
Lipid indexes mmol/l (X ± SD)
Groups (n=10)
TC
TG
HDL-C
LDL-C
G1: control
2,75 ± 0,55
0,50 ± 0,17
1,40 ± 0,11
1,12 ± 0,40
3,85 ± 0,56∆∆∆
0,89 ± 0,28 ∆∆∆
1,79 ± 0,22 ∆∆∆
1,64 ± 0,47 ∆∆∆
3,86 ± 0,52
0,81 ± 0,18
1,89 ± 0,31
1,60 ± 0,63
3,70 ± 0,61
0,81 ± 0,22
2,29 ± 0,21***
1,05 ± 0,66***
3,63 ± 0,38
0,9 ± 0,13
2,07 ± 0,16**
1,15 ± 0,32**
3,23 ± 0,50**
0,62 ± 0,16**
2,15 ± 0,21***
0,81 ± 0,43***
G2:
Nontreatment
G3: Gliclazid
80mg/kg
G4: Andiabet
0,68g/kg
G5: Andiabet
1g/kg
Group 6:
Andiabet 2g/kg
p vs control: ∆∆∆: p <0,001; p vs nontreatment: *: p < 0,05; **: p < 0,01;
***: p < 0,001. TC: Total Cholesterol, TG: triglyceride
Comment: All of Andiabet groups displayed significantly reducing
LDL-C levels and increasing HDL-C levels, compared to the
nontreament (p <0.01 and p <0.001), after orally reagent for 2
consecutive weeks. In addtion to, Andiabet at 2g/kg/day dose orally
for 2 weeks reduced significantly total cholesterol and triglycerid,
compared to the nontreatment group (p <0.01).
3.2.2.5. Effect of Andiabet on liver’s weight and pancreas’s weight
of type 2 diabetic mice
Comment: Andiabet at all of doses had no changed liver’s weigh in T2D
mice (p > 0,05). The weight of pancreas in all group was similar to that
of control, the difference was not statistically significant (p> 0.05).
3.2.2.6. Histopathological changes.
v Observe the liver in general: Group 1 was dark pink, uniform in
color. The tissue density was firm and uniform. Liver of mice were
13
injected STZ had a silver color, were less uniform, the tissue density
were somewhat loosecompared to the control group.
v Observe the microscopic liver: In nontreatment group, 100% of
samples had severe fat degeneration. Andiabet at all of doses improved
this situation: 2/3 of samples had mild fat degeneration and 1/3 of the
sample had medium fat degeneration.
v Observe the pancreas in general: Pancreas in all group were pale
pink, the tissue’s density were tough and firm and didn’t have
congestion or injury.
v Observe the microscopic pancreas: In nontreatment group, 100%
of samples were severe degenerated. Andiabet at all of doses improved
this situation: the degeneration of pancreastic islet cells reduced,
pancreastic islets decreased slightly in size,
and the density of islets was smaller than normal.
3.2.3. Effect inhbitivity on hyperglycemic postprandial blood glucose
of Andiabet in glucose/sucrose/starch tolerance test in normal and
diabetic mice.
3.2.3.1. Effect inhibitivity on hyperglycemic postprandial blood
glucose of Andiabet in glucose/sucrose/starch tolerance test in
normal mice.
v Oral glucose tolerance test
Table 3.6. Effect of Andiabet on PBG and blood glucose AUC after 2
hours orally glucose administration in normal mice
Groups
PBG
%¯
AUC
%¯
(n =10)
(mmol/L)
PBG
(mmol/L)
AUC
Normal mice
Gr1: control
9,28 ± 2,15
13,58 ± 3,05
Gr 2: acarbose 14mg/kg
7,86 ± 0,99
15,3
11,33 ± 1,58
16,57
Gr metformin 250mg/kg
7,37 ± 1,13*
20,58
11,95 ± 1,23
12
14
Gr 4 Andiabet 1g/kg
9,95 ± 1,87
-
13,88 ± 2,55
-
Gr 5 Andiabet 2g/kg
8,22 ± 1,90
11,4
11,65 ± 1,99
14,2
p vs control: * p<0,05; ** p<0,01: *** p<0,001
Comment: Metformin at 250 mg/kg dose lowered PBG by 20.58% and
decreased significantly AUC compared to control (p <0.05). But
acarbose at 14 mg/kg dose and both groups Andiabet at 1g/kg and
2g/kg dose did not changed PBG and AUC, compared to the control
(p> 0.05).
v Oral sucrose tolerance test
Table 3.7. Effect of Andiabet on PBG and blood glucose AUC after 2
hours orally sucrose administration in normal mice
Groups
PBG
%¯
AUC
%¯
(n =10)
(mmol/L)
PBG
(mmol/L)
AUC
Normal Mice
Gr 1: control
10,93 ± 1,29
16,82 ± 1,98
Gr 2: acarbose 14mg/kg
9,33 ± 1,52*
16,47
15,07 ± 1,15*
10,40
Gr 3 metformin 250mg/kg
8,39 ± 2,43*
23,24
14,37 ± 1,69*
14,57
Gr 4: Andiabet 1g/kg
10,90 ± 1,44
0,27
16,55 ± 2,09
1,60
Gr 5: Andiabet 2g/kg
10,15 ± 1,29
2,9
15,05 ± 1,49*
10,52
p vs group control: * p < 0,05; ** p < 0,01: *** p < 0,001
Comment: acarbose at 14 mg/kg dose and metformin at 250 mg/kg
dose both decreased significantly PBG and AUC, compared to control
(p <0.05). Andiabet at the doses 1g/kg and 2g/kg did not lowered PBG
and only Andiabet at the dose 2g/kg lowered AUC significantly,
compared to control (p <0.05).
v Oral starch tolerance test
Table 3.8 Effect of Andiabet on PBG and blood glucose AUC
after 2 hours orally starch administration in normal mice
Groups
PBG
%¯
AUC
%¯
15
(n =10)
(mmol/L)
PBG
(mmol/L)
AUC
Normal mice
Gr control
8,93 ± 1,52
13,99 ± 1,47
Gr acarbose 14mg/kg
7,51 ± 0,98*
15,9
13,32 ± 0,83
4,79
Gr metformin 250mg/kg
7,24 ± 0.37*
18,92
12,71 ± 1,39
9,15
Gr Andiabet 1g/kg
7,85 ± 1,12
12,09
12,82 ± 1,61
8,36
Gr Andiabet 2g/kg
7,29 ± 1,27*
18,36
12,88 ± 1,62
7,93
p vs group control: * p < 0,05; ** p < 0,01: *** p < 0,001
Comment: All 3 groups of acarbose, metformin and Andiabet 2g/kg
inhibited PBG compared to the control group (p <0.05). All 4 batches
of Acarbose, Metformin, Andiabet 1g and 2g / kg did not significantly
reduce AUC compared to the control group.
3.2.3.2. Effect inhibitivity on hyperglycemic postprandial blood
glucose of Andiabet in glucose/sucrose/starch tolerant test in
diabetic mice.
v Oral glucose tolerance test
Table 3.9. Effect of Andiabet on PBG and blood glucose AUC after 2
hours orally glucose administration in T2D mice
Groups
PBG
%¯
AUC
(n =10)
(mmol/L)
PBG
(mmol/L)
%¯
AUC
STZ-induced diabetic mice
NT diabetic group
32,33 ± 1.01
58,71 ± 7,61
Gr acar 14 mg/kg
29,41 ± 5,50
9,03
50,06 ± 10,84
14,73
Gr met 250 mg/kg
18,43 ± 5,21**
42,99
21,69 ± 6,31***
63,05
Gr Andiabet 1 g/kg
26,10 ± 4,15*
19,27
39,96 ± 9,87*
31,94
Gr Andiabet 2 g/kg
24.93 ± 4,05*
22,89
39,71 ± 7,56**
32,36
p vs nontreatment (NT) group: * p<0,05; ** p<0,01: *** p<0,001
Comment: Andiabet at 2 doses 1g/kg and 2g/kg had a significant
reduction in PBG compared to the nontreatment group, the reduction
16
of PBG was 19.27% and 22.89%, respectively (p <0.05). At the same
time, 2 groups of Andiabet also lowered AUC by 31.94% and 32.36%
(p < 0.01 respectively), which is lowerd better than that of the positive
control. The reduction of metformin group’s PBG was 43% (p <0.01)
and AUC was 63% (p <0.001). And acarbose at 14 mg/kg dose did not
reduced PBG and AUC (p > 0.05).
v Oral sucrose tolerance test
Table 3.10. Effect of Andiabet on PBG and blood glucose AUC after
2 hours orally sucrose administration in T2D mice
Groups
PBG
%¯
AUC
%¯
(n =10)
(mmol/L)
PBG
(mmol/L)
AUC
STZ-induced diabetic mice
NT diabetic group
32,89 ± 1,10
66,22 ± 7,89
Gr acar 14mg/kg
23,14 ± 6,57*
29,64
34,88 ± 10,45***
47,32
Gr met 250mg/kg
20.15 ± 9.54*
38,74
32,96 ± 15,73***
50,22
Gr Andiabet 1g/kg
25,87 ± 7,71
21,34
40,11 ± 14,74**
39,43
Gr Andiabet 2g/kg
25,33 ± 4,97*
22,98
42,12 ± 8,92**
36,39
p vs nontreatment (NT) group: * p < 0,05; ** p < 0,01: *** p < 0,001
Comment: 3 groups were acarbose 14 mg/kg, metformin 250 mg/kg
and Andiabet 2g/kg displayed significantly inhibiting PBG compared
to the nontreatment group (p < 0,05). The Andiabet group at the dose
1g/kg had no inhibited the PBG. However, all of groups displayed
significantly reducing AUC by 47,32% (Acarbose 14mg/kg group);
50,22% (Metformin 250mg/kg group) and 39,43 % (Andiabet 1g/kg);
36,39 % (Andiabet 2g/kg), respectively.
v Oral starch tolerance test
Table 3.11. Effect of Andiabet on PBG and blood glucose AUC after 2
hours orally starch administration in T2D diabetic mice
Groups
PBG
%¯
AUC
%¯
17
(n =10)
(mmol/L)
PBG
(mmol/L)
AUC
STZ-induced diabetic mice
NT diabetic group
29,24 ± 4,14
47,92 ± 6,16
Gr 2: Acar 14mg/kg
19,59 ± 8,49
33,03
29,86 ± 1,28*
37,69
Gr 3: Met 250mg/kg
18,16 ± 3,73**
37,89
22,90 ± 4,69**
52,21
Gr 4: Andiabet 1g/kg
19,26 ± 11,12
34,13
36,33 ± 2,27
24,18
Gr 5: Andiabet 2g/kg
15,18 ± 4,19***
48,08
24,94 ± 6,81**
47,95
p vs nontreatment (NT) group: * p < 0,05; ** p < 0,01: *** p < 0,001
Comment: 2 groups are metformin and andiabet at 2g/kg dose
significantly inhibited PBG, compared to the nontreatment group (p
<0.01 and p <0.001). AUC of 3 groups (acarbose, metformin and
Andiabet 2g/kg) were significantly reduced, comparing to the
nontreatment group. The percentage reduction of AUC of 3 groups
were 37.69% (p <0.05), 52.21% (p <0.01) and 47.95% (p <0.01),
respectively.
3.2.4. Antagonism with insulin resistance of Andiabet in type 2
diabetic mice.
Blood glucose levels (mmol/L)
Chứng trắng
Andiabet 1g/kg
Chứng bệnh
Andiabet 2g/kg
9
7
5
80
90
100
110
Times (min)
120
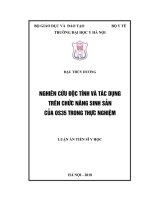
Figure 3.1. Blood glucose levels in Hyperinsulinemic - euglycemic clamp
test in T2D diabetic mice.
18
Glucose ìnusion rate (ml/h)
2
Andiabet
2g/kg
1.6
Chứng trắng
1.2
Chứng bệnh
0.8
Andiabet
1g/kg
0.4
0
80
90
100
110
120 Time (min)
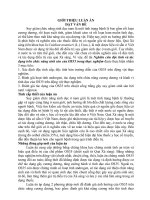
Figure 3.2. Glucose infusion rate in Hyperinsulinemic - euglycemic
clamp test in T2D diabetic mice
Comment: In the figure 3.3.The blood glucose level of all 4 groups
was maintained steady state in the range of 7.5 - 8.3 mmol/L during
the “clamping time” from 80-120 minutes. In the figure 3.2. Glucose
infusion rate gradually decreased from the control group, to Andiabet
2g/kg, Andiabet 1g/kg and was lowest in the nontreatment group.
Chapter 4. DISCUSSION
Lagerstroemia speciosa (L.) Pers; Gynostemma pentaphyllum
(Thunb.) Makino; Anemarrhenae Aspheloides (Bunge) are
traditional Vietnamese herbal medicines that is widely used to treat
type 2 diabetes. With the desire to create an effective diabetes
treatment product, derived from herbs, Traphaco company had
extracted and prepared Andiabet, a hard capsules. Andiabet is a
compound of 3 Vietnamese herbal medicines composition above. To
be able to use Andiabet to support treatment of type 2 diabetes, it is
necessary to study the safety as well as pharmacological effects and
study some mechanisms of action of Andiabet tablets.
4.1. ACUTE AND LONGTERM TOXICITY OF ANDIABET
4.1.1. Acute toxicity of Andiabet
19
At the highest dose of 44,25 g/kg, Andiabet has no acute toxicity for
mice. Andiabet showed that it to be relatively safe because the ratio
between maximum tolerance dose (44.25 g/kg) to therapeutic dose (the
lowest dose which has hypoglycemic effect (0.68 g/kg) is 66: 1.
Therefore, high recommended a trial dose of Andiabet on the human
from 0.45 g/kg - 4.4 g/kg/day (in the range of 1/100 - 1/10 maximum
tolerance dose). Andiabet hard capsule includes 200 mg of dried
leaves (Lagerstroemia speciosa (L.) Pers) 70% with 200 mg of dried
stems, roots, leaves Gynostemma pentaphyllum (Thunb.) Makino and
133 mg dried root Anemarrhenae Aspheloides (Bunge). The content
of the active ingredient which contained in a hard Andiabet capsule is
533 mg. So the maximum dose in humans is 8 capsules/day,
extrapolating 1 g/kg/day in mice (extrapolation coefficient in mice are
12 and adults’s weight is about 50 kg). Therefore, our next study used
3 doses of Andiabet: 0.68g/kg (equivalent to clinical dose); 1 g/kg (1.5
times the clinical dose) and 2 g/kg (3 times the clinical dose).
4.1.2. Longterm toxicity of Andiabet
Vinabetes is a soft form and has components the same at Andiabet,
that has been studied for longterm toxicity in rabbits for 4 weeks with
2 doses of 1.8 g/kg/day and 3.6 g/kg/day. The results showed that
Vinabetes caused the damage on hepatocellular. Therefore, in the
present study, the longterm toxicity test of Andiabet was conducted on
rabbits for 90 consecutive days with 2 doses: 0.21 and 0.64 g/kg/day.
The result showed that, Andiabet has no noticeable sign of long term
toxicity after 90 days oral consecutive administration.
4.2. HYPOGLYCEMIC ACTIVITY AND SEVERAL HYPOGLYCEMIC
MECHANISMS OF ANDIABET IN EXPERIMENTAL.
4.2.1. Hypoglycemic effect of Andiabet in normal mice.
Results from table 3.7 showed that Andiabet has hypoglycemic effect
on normal white mice. Andiabet at 0.68 g/kg/day and 2 g/kg/day doses
orally for 2 weeks reduced the blood glucose levels by 14.3% and
17.1% compared to the control group (p <0.05). Gliclazide at the dose
20
of 80mg/kg reduced better than Andiabet (20.52% vs 17.1%) in
normal mice, because all three herbs contain many active ingredients
with different hypoglycemic mechanisms, not only stimulate the
pancreas to increase insulin secretion such as gliclazide, but it can also
have many other mechanisms such as promotion the insulin
sensitivity, inhibition of glycogen metabolism in the liver and other
tissues in the body, and or inhibition of hepatic gluconeogenesis. .. and
the effects were not shown in normal mice.
4.2.2. Hypoglycemic effect of Andiabet in type 2 diabetic mice.
4.2.2.1. Type 2 diabetes model.
Recently, scientists have developed a new type 2 diabetes model by
combining a high-fat diet (fat ~ 40-60% of calories) for a long time (12 months) to cause insulin resistance. Then, pancreastitis were induced
by low-dose STZ injection. In this way, we have type 2 diabetes mice.
Mice had obesity characteristic: after 4, 6 and 8 weeks, the weight of
mice in the HFD groups were by 42.5%; 64.4% and 85.8%,
respectively. The difference compared to the NFD group was
statistically significant (p <0.001), (table 3.8). Mice also had insulin
resistance, increasing blood glucose level characteristics: After 72
hours of STZ injection 100 mg/kg, blood glucose concentration in the
HFD group was 17.09 mmol/l, an increase of 207.4% compared to the
previous study and compared to the control group (p <0.001), (Table
3.9). In addition, mice had some another characteristic: dyslipidemia,
with microscopic lesions of hepatocellular and pancreastic islet, is
suitable for assessing the pharmacological effects.
4.2.2.2. Hypoglycemic effect of Andiabet in type 2 diabetic mice.
In this study, we demonstrated that Andiabet at 0.68, 1 and 2 g/kg/day
doses orally for 14 days improved the glucose homeostasis and lipid
metabolism. The blood glucose levels significantly decreased about 36%
comparable to the nontreated diabetic mice group. The result also
demonstrated a significant control of serum lipid profiles in diabetic mice
after treatment with Andiabet. The good effect on the blood glucose
21
levels and lipid concentration of Andiabet was also shown truthfully by
improving the general picture and microscopic liver, pancreas of
Andiabet. In summary, Andiabet improved glucose homeostasis and
lipid metabolism, prevent the development of liver’s fatty degeneration
in type 2 diabetic mice after 2 weeks oral administration of Andiabet.
4.2.3. Effect inhbitivity on hyperglycemic postprandial blood glucose
of Andiabet in glucose/sucrose/starch tolerance test in normal and
diabetic mice.
4.2.3.1. The model.
If the drug that inhibits the absorption of glucose after the meal, the
blood glucose levels will be reduce, comparable with the control
group. Base on that, to evaluate the ability inhbit on hyperglycemic
postprandial blood glucose of Andiabet, we simultaneously performed
all 3 tests. Oral glucose tolerance test, oral sucrose tolerance test and
oral starch tolerance test in normal mice and type 2 diabetes mice. This
model has not been implemented in domestic laboratories so far. The
oral glucose tolerance test is used to assess the insulin receptor’s
response to the increasing exogenous glucose, indirectly assessing
insulin resistance. Oral starch tolerance test is used to assess the effect
of reagents on the activity of α-amylase and α-glucosidase enzymes.
Sucrose tolerance test is used to assess the effect of reagents on αglucosidase enzymes.
4.2.3.2. Inhbitivity on hyperglycemic postprandial blood glucose of
Andiabet in glucose tolerance test.
Andiabet improved oral glucose tolerance test in type 2 diabetic mice
with high blood glucose levels, less effect than in the normal mice without
insulin resistance and insulin secretion disorder, suggesting the
mechanism of hypoglycemic effect of Andiabet may be Andiabet does
not stimulate insulin secretion from pancretic islets, Andiabet exert its
antidiabetic effect by increasing sensitivity of target tissues to insulin and
decreasing hepatic glucose output.
22
4.2.3.3. Inhbitivity on hyperglycemic postprandial blood glucose of
Andiabet in sucrose tolerance test.
In sucrose tolerance test, Andiabet at doses of 1 and 2 g/kg were
able to control hyperglycemic postprandial blood glucose in normal
mice and in type 2 diabetic mice after 2 hours orally sucrose
administration similar to the effect of acarbose 14 mg/kg/day and
metformin 250 mg/kg/day and this effect depends on the dose of
Andiabet. The mechanism of hypoglycemic effect of Andiabet may be
due to the inhibition of α-glucosidase similar to acarbose’s mechanism
or increasing insulin sensitivity like that of metformin’s mechnism, or
there are may be any other mechanism besides these two mechanisms?
4.2.3.4. Inhbitivity on hyperglycemic postprandial blood glucose of
Andiabet in starch tolerance test.
Andiabet is able to improve oral starch tolerance test, depending
on the dose. The hypoglycemic effect of Andiabet at the dose of 2g/kg
in this test was better than that of acarbose 14mg/kg and metformin
250mg/kg may suggested Andiabet's ability to inhibit hyperglycemic
postprandial due to inhibition of α-glucosidase and/or α-amylase
enzymes. In addition, Andiabet may also have mechanisms that
increase insulin sensitivity, like metformin, increase the ability to
transport glucose into the target cells, reduce hyperglycemic
postprandial and AUC.
4.2.4. Antagonism with insulin resistance of Andiabet in type 2
diabetic mice.
In this study, the technique of "Hyperinsulinemic - euglycemic
clamp test" was used to directly assess insulin resistance in type 2
diabetes mice, which is the first model we have implemented in Vietnam.
We have also improved several the technical details: Instead of exposing
the carotid artery and neck veins on both sides to place a fixed catheter,
the catheter is inserted into vein’s tail to simultaneously infuse insulin
solution and glucose solution. Blood samples were given at the tip of
mice’s tail instead of carotid artery. The mice were fasted overnight
23
(18h), then the technique of "Hyperinsulinemic - euglycemic clamp
test" had been performed for 2 hours, the "clamping" time was
shortened. Mice were locked in a cage, but awake, not anesthetized. The
results in Figure 3.1 and 3.2 showed that when the blood glucose
concentration is maintained stable in the range of 7.5 to 8.3 mmol/L, the
glucose infusion rate during “clamping” period is used as a ruler of
insulin sensitivity, which reflects the exogenous glucose to be required
to “euglycemic” maintainment, the glucose infusion rate different
between control and insulin-resistance groups. The nontreated diabetic
group, after 8 weeks had eaten a high fat diet, mice exerted insulin
resistance. Then mice were induced by low dose of STZ, mice exerted
type 2 diabetes and had no treatment. Therefore the glucose infusion rate
in this group was lowest, because this group needed less glucose to
maintain “euglycemic”. Type 2 diabetic mice treated with Andiabet at
the doses 1g and 2g/kg for 2 weeks had a higher the glucose infusion rate
than the nontreated diabetes group, but lower than normal mice without
insulin resistance.This was indicated that Andiabet was able to improve
insulin resistance of the body.
CONCLUSION
1. Acute and longterm toxicity of Andiabet.
- Andiabet had no acute toxicity for mice even at the highest dose of
44.25 g/kg. Andiabet's LD50 for oral administration had not been
determined.
- Andiabet at the dose of 0,21 and 0.64g/kg/day showed no noticeable
sign of longterm toxicity on rabbits when given for 90 consecutive days.
2. Hypoglycemic effect and several Hypoglycemic mechanism of
Andiabet in experimental.
2.1. Hypoglycemic effects of Andiabet.
- Andiabet, both in the doses 0.68 g/kg/day and 2 g/kg/day after 2
weeks orally administration, showed the hypoglycemic effect in
normal mice. The percentage of reduction were 14.3% and 17.1%,
respectively.
24
- Andiabet at all 3 doses levels: 0.68 g/kg/day; 1 g/kg/day and 2
g/kg/day orally for 2 weeks improved the glucose homeostasis in type
2 diabetic mice. The blood glucose levels significantly decreased by
9.1%; 35.6% and 19.3%, respectively, comparable to the nontreated
diabetic mice group (p <0.01).
- Andiabet at all 3 doses levels: 0.68 g/kg/day; 1 g/kg/day and 2
g/kg/day orally for 2 weeks improved the lipid metabolism in type 2
diabetic mice. LDL-C levels reduced by 36%; 29.88% and 50.61%,
respectively. Stimultaneously, HDL-C levels markedly increased by
27.9%; 15.64% and 20.11%, respectively, in comparison with the
nontreated diabetic mice group (p <0.01 and p < 0.001). In addition,
Andiabet at 2 g/kg/day dose significantly reduced total cholesterol
level by 16.1% (p <0.01) and reduced triglycerides by 30.34%
compared to nontreatment group ( p <0.01).
- Andiabet at all 3 doses were given continuously for 2 weeks
improving the general image and microstructure of liver and pancreas
of type 2 Diabetes mice.
2.2. Hypoglycemic mechnisms of Andiabet.
At doses of 1 g/kg and 2 g/kg, Andiabet reduced insulin resistance
by indirect assession through the improved glucose, sucrose and starch
tolerance tests in normal and STZ-induced diabetic mice and direct
evaluation by hyperinsulinemic-euglycemic clamp in conscious,
unrestrained mice. These findings suggested the effective mechanisms
of Andiabet to be inhibition of α-glucosidase and/or α-amylase in
experimental animals and insulin resistance reduction.
RECOMMENDATION
Continue to research clinical trials to assess the safety and
efficacy of the drug Andiabet in type 2 diabetic patients.