An analysis of volumes, prices and pricing trends of the pediatric antiretroviral market in developing countries from 2004 to 2012
Bạn đang xem bản rút gọn của tài liệu. Xem và tải ngay bản đầy đủ của tài liệu tại đây (707.62 KB, 8 trang )
Lee et al. BMC Pediatrics (2016) 16:41
DOI 10.1186/s12887-016-0578-x
RESEARCH ARTICLE
Open Access
An analysis of volumes, prices and pricing
trends of the pediatric antiretroviral market
in developing countries from 2004 to 2012
Janice Soo Fern Lee1*†, Luis Sagaon Teyssier2,3,4†, Boniface Dongmo Nguimfack5, Intira Jeannie Collins6,
Marc Lallemant1, Joseph Perriens5 and Jean-Paul Moatti2,3,4
Abstract
Background: The pediatric antiretroviral (ARV) market is poorly described in the literature, resulting in gaps in
understanding treatment access. We analyzed the pediatric ARV market from 2004 to 2012 and assessed pricing
trends and associated factors.
Methods: Data on donor funded procurements of pediatric ARV formulations reported to the Global Price Reporting
Mechanism database from 2004 to 2012 were analyzed.
Outcomes of interest were the volume and mean price per patient-year ARV formulation based on WHO ARV dosing
recommendations for a 10 kg child. Factors associated with the price of formulations were assessed using linear
regression; potential predictors included: country income classification, geographical region, market segment
(originator versus generic ARVs), and number of manufacturers per formulation. All analyses were adjusted for
type of formulations (single, dual or triple fixed-dose combinations (FDCs))
Results: Data from 111 countries from 2004 to 2012 were included, with procurement of 33 formulations at a
total value of USD 204 million. Use of dual and triple FDC formulations increased substantially over time, but with
limited changes in price. Upon multivariate analysis, prices of originator formulations were found to be on average
72 % higher than generics (p < 0.001). A 10 % increase in procurement volume was associated with a 1 %
decrease (p < 0.001) in both originator and generic prices. The entry of one additional manufacturer producing a
formulation was associated with a decrease in prices of 2 % (p < 0.001) and 8 % (p < 0.001) for originator and
generic formulations, respectively. The mean generic ARV price did not differ by country income level. Prices of
originator ARVs were 48 % (p < 0.001) and 14 % (p < 0.001) higher in upper-middle income and lower-middle
income countries compared to low income countries respectively, with the exception of South Africa, which had
lower prices despite being an upper-middle income country.
Conclusions: The donor funded pediatric ARV market as represented by the GPRM database is small, and lacks
price competition. It is dominated by generic drugs due to the lower prices offered and the practicality of FDC
formulations. This market requires continued donor support and the current initiatives to protect it are important
to ensure market viability, especially if new formulations are to be introduced in the future.
Keywords: Pediatrics antiretroviral market, Pediatric antiretroviral prices, Global Price Reporting Mechanism,
Price trends, Pediatric antiretroviral procurement
* Correspondence:
†
Equal contributors
1
Drugs for Neglected Diseases initiative (DNDi), 15 Chemin Louis Dunant,
1202 Geneva, Switzerland
Full list of author information is available at the end of the article
© 2016 Lee et al. Open Access This article is distributed under the terms of the Creative Commons Attribution 4.0
International License ( which permits unrestricted use, distribution, and
reproduction in any medium, provided you give appropriate credit to the original author(s) and the source, provide a link to
the Creative Commons license, and indicate if changes were made. The Creative Commons Public Domain Dedication waiver
( applies to the data made available in this article, unless otherwise stated.
Lee et al. BMC Pediatrics (2016) 16:41
Background
In 2012, 3.4 million children were living with HIV/AIDS,
90 % of whom were in sub-Saharan Africa and only
647,000 were receiving antiretroviral (ARV) therapy [1].
For several years, the World Health Organization (WHO)
has recommended early diagnosis and immediate treatment
with ARVs for all children under two years of age irrespective of CD4 count, and since June 2013, for all children
under five years of age [2], meaning that at the end of 2012,
2.6 million children who were eligible for treatment did not
receive it.
Research and development for pediatric ARVs has been
slow. Of the 26 ARVs approved by the United States Food
and Drugs Administration (USFDA) and marketed, 7 have
no pediatric indication, 8 have no pediatric formulation,
and only 11 are approved for use in children below two
years of age [3]. In the early years of combined ARV
therapy, this lack of appropriate formulations meant
that programs in resource limited settings had to resort
to breaking adult fixed dose combination (FDC) tablets
to treat children [4, 5].
In response to the need for pediatric FDCs, a WHO/
United Nations Children’s Fund (UNICEF) consultation
in 2004 established a priority list of missing formulations
and discussed ways to engage pharmaceutical companies
to produce them [6]. Further consultations updated the
list of ARVs to be developed, and identified key research
areas to further facilitate FDC development [7, 8]. Other
milestones include having these formulations listed on
the WHO Prequalification Project’s Expression of Interest
and subsequently on the Essential Medicines List, thus
enabling developing countries to purchase quality assured
generic ARVs, often a requirement from international
donors.
Since 2006, UNITAID, an organization dedicated to
providing funds to address market failures in the fight
against HIV/AIDS, malaria and tuberculosis in developing
countries, successfully incentivized generic companies to
produce the “missing” ARV formulations [9]. By pooling
procurement across 40 countries and committing to
purchase ARVs, it created a market for pediatric FDCs
and became the largest provider for developing countries
(97–100 % of the pediatric market-share by 2008–2009)
[10]. In 2010, much of the pediatric antiretroviral procurement responsibility was transitioned to other donors, in
particular the Global Fund to Fight AIDS, Tuberculosis
and Malaria (GFATM) [11].
In October 2011, the Joint United Nations Programme
on HIV/AIDS (UNAIDS) and its partners launched the
Global Plan Towards the Elimination of New HIV Infections Among Children by 2015 [12]. Although this
initiative provided considerable momentum for the
prevention of new infections, WHO forecasted that
1.9 million children will be living with HIV in 2020,
Page 2 of 8
with an estimated 1.6 million in need of antiretroviral
treatment (ART) [13].
A first analysis of the pediatric ARV market was published in 2010 which focused on the availability and use
of pediatric formulations between 2002 and 2009 [10].
The analysis gave an overview of pediatric formulations
conforming to WHO recommendations and usage of
formulations following WHO prequalification program
or USFDA (tentative) approval. Little was reported on
pricing trends across regions and formulations. Our analysis seeks to fill the knowledge gap since then, given
that WHO guidelines have changed, new formulations
have been introduced, and the factors associated with
price trends of pediatric ARV formulations are largely unknown. We present our findings using the WHO’s Global
Price Reporting Mechanism (GPRM) database which has
been tracking international transactions of HIV, tuberculosis and malaria commodities purchased by national programmes in low- and middle-income countries through
international procurement organizations since 2004. This
database represents about 80 % of total donor-funded
transactions worldwide [14].
Methods
The GPRM database contains information about prices
and volumes of each individual transaction, dosage form
and strength of formulations, manufacturers, procurement
agents, destination countries, international commercial
terms (INCOTERMS), and procurement dates obtained
from 11 procurement organizations on a quarterly basis.
The analyses were based on GPRM data collected between
2004 and 2012. Prices are reported in current USD.
To remove variability arising from the use of different
INCOTERMS and to allow comparability, prices were
expressed in Ex Works (price of goods at Seller’s
premises, the Buyer bearing full costs and risks of moving
the goods from there to destination) using a published statistical algorithm [15]. For each of the 21 ARV single formulations, 7 dual FDCs, and 5 triple FDCs , we calculated the
quantity per year (QTY) and price per year (PTY) using
WHO ARV dosing recommendations for a 10 kg child
(2004–2005 dosing based on WHO 2002 guidelines,
2006–2009 dosing based on WHO 2006 guidelines, and
2010–2012 dosing based on WHO 2010 guidelines):
QTY ¼ ðnumber of units purchasedÞ
=½ðunits used in daily treatmentÞ Â ð365Þ
and
PTY ¼ ðunit price USÞ Â ðunits used in daily treatmentÞ
 ð365Þ:
Countries were grouped into 7 geographic areas: East
Asia and Pacific, Europe and Central Asia, Latin-America
Lee et al. BMC Pediatrics (2016) 16:41
Page 3 of 8
Multivariate analysis of the factors associated with the
price of pediatric antiretrovirals
We used a linear regression model to assess the factors
associated with the price of formulations, with fixed-effects
for calendar time and geographical regions. The outcome
of formulation patient-year cost was the dependent variable. It was transformed into its natural logarithm in order
to facilitate the interpretation of coefficients as percentages
of variation. The potential factors associated with prices
120000
South asia
100000
80000
Middle east and north
africa
60000
Latin America and the
Caribbean
40000
Europe and Central
Asia
20000
0
2004
2005
2006
2007
2008
2009
2010
2011
2012
Number of treatment years
Evolution of originator volumes
by region sub-Saharan Africa
East Asia and Pacific
Evolution of originator volumes
by country income level
Evolution of generic volumes by
region
lower-middle income
countries
40000
low income countries
20000
0
Number of treatment years
upper middle income
countries
60000
2004
2005
2006
2007
2008
2009
2010
2011
2012
Number of treatment years
80000
sub-Saharan Africa
400000
Southa sia
300000
200000
Middle east and north
africa
100000
Latin America and the
Caribbean
0
Europe and Central
Asia
Evolution of generic volumes by
country income level
120000
100000
500000
2004
2005
2006
2007
2008
2009
2010
2011
2012
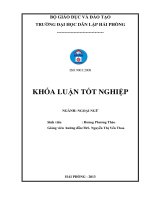
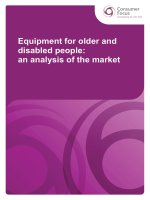
We analyzed the evolution of volumes procured, by region and by country income levels for originator and
generic products, for single ARVs, dual FDCs and triple
FDCs; and the change in mean prices of single ARVs,
dual and triple FDCs over time.
Results
The numbers of countries contributing data increased
from 46 in 2004 to 111 in 2012. Over the observed time
period, there were 33 formulations, 15 162 transactions,
2 447 252 QTY and a total purchasing value of USD 204
million.
From 2004 to 2012, sub-Saharan Africa represented
85 % of the total volume of pediatric ARVs purchased
from both originator and generic manufacturers (Fig. 1).
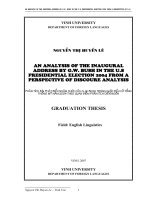
The market was originally dominated by originator companies with 72 % of the volume purchased in 2004
(Fig. 2). Since 2005, generic companies have taken over,
accounting for 95 % of volume and 92 % of value in 2012.
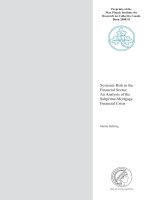
Use of dual and triple FDCs has increased markedly since
2009, with single ARV volumes decreasing from 2010
onwards. Triple FDCs recorded their highest purchase
volume in 2012, followed by dual FDC and single ARVs
(Fig. 3). It is worth noting that, with the exception of
lopinavir/ritonavir (LPV/r), pediatric dual FDCs and triple
FDCs were exclusively produced by generic companies,
while single ARVs and LPV/r were produced by both.
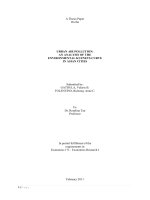
Generally, the prices of single ARVs have decreased
since 2004. However, the prices of dual and triple FDCs
have remained almost constant after their first year
post-introduction (Fig. 4). By 2012 the transaction
500000
450000
400000
350000
300000
250000
200000
150000
100000
50000
0
upper middle income
countries
lower-middle income
countries
low income countries
2004
2005
2006
2007
2008
2009
2010
2011
2012
Descriptive analysis of volumes and prices of pediatric
formulation procurement
included in the model were: originator versus generic producers, country income class, geographical region, type of
formulation (single ARV, dual FDC, triple FDC), number
of suppliers and purchase volume.
Number of treatment years
and the Caribbean, Middle East and North Africa, South
Asia, sub-Saharan Africa excluding South Africa, and
South Africa. South Africa was separated from subSaharan Africa in the analysis due to the large volume
of drugs purchased by the country which could have
confounded the outcomes for the sub-Saharan Africa
region as a whole. Countries were also grouped by
Gross National Income (GNI) per capita using World
Bank classifications of low-income, lower-middle-income,
and upper-middle income economies. GNI classifications
were revised yearly. Formulations were classified into
single ARV, double FDCs and triple FDCs.
Fig. 1 Evolution of treatment volumes by region and country income levels for originator and generic products
Lee et al. BMC Pediatrics (2016) 16:41
Page 4 of 8
Fig. 2 Market share of generic and originator ARVs by volume and price
volume of zidovudine/lamivudine/nevirapine had increased 12-fold since its entry into the market in 2008.
Upon multivariate analysis, prices of originator formulations were on average 72 % higher than generics
(p < 0.001) (Table 1). The prices of generic ARVs were
54 % lower in 2012 compared to 2004 (p < 0.001), however the majority of this price reduction had occurred
by 2006, with limited change thereafter. Overall, originator
prices were 52 % lower in 2012 than in 2004 (p < 0.001).
There is a modest association between volume and
ARVs prices, with a 10 % increase in volume associated
with a 1 % decrease (p < 0.001) for both originator and
generic prices. The number of manufacturers for a given
formulation was limited, with 1–2 manufacturers for
dual/triple FDCs, and 3–4 for single ARV formulations.
The number of manufacturers was also modestly associated with price changes, with additional manufacturers associated with a decrease of 2 % (p < 0.001) and
8 % (p < 0.001) in originator and generic ARV prices,
respectively.
Investigating prices by geographical region, we found
that sub-Saharan Africa (excluding South Africa) was
paying the lowest price for originator ARVs. However,
the price of originator formulations in South Africa was
Number of yearly treatments
Evolution of treatment volumes of singles, dual
FDCs and triple FDCs
300000
250000
200000
Single
150000
Dual-FDC
100000
Triple-FDC
50000
2004
2005
2006
2007
2008
2009
2010
2011
2012
Year
Fig. 3 Evolution of treatment volumes of singles, dual FDCs and
triple FDCs
on average 71 % (p < 0.001) lower than in sub-Saharan
Africa, essentially because of high volumes and potential
price negotiations which could have taken place for formulations such as abacavir solution, lopinavir/ritonavir
pediatric tablets and nevirapine suspension. Generic drugs
formed 70 % of the total purchase volume in South Africa
and their price was 24 % (p < 0.001) higher than the rest of
sub-Saharan Africa. East Asia and Pacific and South Asia
were paying 10 % (p < 0.001) and 13 % (p < 0.001) less than
sub-Saharan Africa respectively.
Compared to low income countries, originator ARVs
prices were 14 % (p < 0.001) and 48 % (p < 0.001) higher
in lower-middle and upper-middle income countries respectively. Generic ARV prices within country classifications did not differ significantly.
Discussion
Our multivariate analysis shows that originator prices
are on average 72 % higher than generic prices, despite
the marked decrease of 52 % in overall originator prices
in 2012 compared to 2004 (p < 0.001.) It is therefore not
surprising that this donor-dominated market was rapidly
overtaken by generic products. In 2012, 95 % of pediatric
ARVs were purchased from generic companies. Price was
not the only factor influencing this change; the availability
of child-friendly FDCs also played an important role. The
prices of pediatric FDCs have remained stagnant despite
the fact that volumes of triple and dual FDCs outstripped
that of single ARV formulations in 2011. This may be explained by the fact that many organisations have advocated for pediatric FDCs. Even before the development of
paediatric FDCs, Médecins sans Frontières reported good
outcomes for children using adult FDC in resource limited
settings and advocated for child friendly FDCs [5]. WHO
and UNICEF further promoted pediatric FDCs through
the development of treatment guidelines, priority lists
of missing formulations and engaging manufacturers to
stimulate product development. A final push was given
Lee et al. BMC Pediatrics (2016) 16:41
Page 5 of 8
Mean prices of dual and triple FDCs
Mean price per yearly treatment
900.0
800.0
700.0
600.0
500.0
Lamivudine (3TC) + Nevirapine
(NVP) + Stavudine (d4T) 30mg
+50mg + 6mg
Lamivudine (3TC) + Nevirapine
(NVP) + Stavudine (d4T) 60mg
+ 100mg + 12mg
Lamivudine (3TC) + Nevirapine
(NVP) + Zidovudine (ZDV) 30
mg + 50mg + 60mg
Lamivudine (3TC) + Stavudine
(d4T) 30mg + 6mg
Lamivudine (3TC) + Stavudine
(d4T) 60mg + 12mg
400.0
300.0
Lamivudine (3TC) + Zidovudine
(ZDV) 30mg + 60mg
200.0
Lopinavir (LPV) + Ritonavir
(RTV) 100mg + 25mg
100.0
.0
2004 2005 2006 2007 2008 2009 2010 2011 2012
Year
Lopinavir (LPV) + Ritonavir
(RTV) 80mg + 20mg/ml
Fig. 4 Evolution of mean prices of dual FDCs and triple FDCs
by UNITAID, an organization financed by a solidarity
levy on airline tickets. It successfully created a market
for pediatric FDCs in 2006 with the announcement of a
price deal of 16 cents a day per child for stavudine/
lamivudine/nevirapine [16]. This price positioning was
obtained through the advocacy efforts of large institutions
and UNITAID’s commitment to purchase commodities.
With the exception of LPV/r, dual and triple pediatric
FDCs are exclusively produced by generic manufacturers.
They are produced in India where patents for medicines
were not granted before 2005 [17]. Developing countries
have access to these formulations because according to
the Trade-Related Aspects of Intellectual Property Rights
(TRIPS) Agreement, least developed countries do not have
to enforce intellectual property rights until 2016 [18]. In
the United States of America (USA), these pediatric FDCs
were approved by the USFDA under a special program associated with the President’s Emergency Plan (PEPFAR);
products with IP protection in the USA may be reviewed
and receive “tentative approval” allowing them to be purchased under PEPFAR programs for use in developing
countries, but with no marketing rights in the USA. While
pediatric FDCs are now the cornerstone of treatment for
children in developing countries, they are not available in
developed countries where intellectual property (IP) barriers do not allow their commercialization.
Various terms have been used for the pricing strategy
that originator pharmaceutical companies adopt in setting
prices for countries with different income levels, such as
“tiered pricing”, “differential pricing”, “market separation”
and “price discrimination” [19–21]. This approach is
reflected in the pricing trends of our analysis and may
explain why low income countries are paying the lowest
originator price, followed by lower-middle income and
upper-middle income countries. Although the eligibility
criteria for tiered pricing and the different categories of
pricing vary across originator companies, 6 out of 7 originator companies include sub-Saharan African countries in their lowest tiered pricing category for ARVs
[22, 23]. This explained why, with the exception of low
income countries, sub-Saharan African countries also
paid the lowest price of all geographical regions for originator ARVs. While the originator’s tiered pricing strategy
generally matches prices with the country’s purchasing
power, South Africa is an exception. We excluded South
Africa from the sub-Saharan African countries in the analysis because it represents a substantial volume of purchase, South African tender favors the selection of local
manufacturers and has a committee that specifically regulates pharmaceutical prices [24]. This upper-middle income country pays 71 % less for its originator drugs than
the rest of sub-Saharan Africa.
For generic pediatric ARVs, sub-Saharan Africa (South
Africa excluded) has not paid the lowest prices. East
Asia and Pacific and South Asia were paying 11–13 %
less for generic ARVs. The prices of generic ARVs across
the 3 economic income groups were not significantly
different. Generic pediatric ARV pricing does not appear
not to be linked to country income levels or geographical region, suggesting a different pricing strategy to that
of the originator companies.
To our knowledge, this is the first time that a thorough
analysis of pricing trends of pediatric ARVs from 2004 to
2012 has been presented. While this database captures
mostly donor related pediatric ARV transactions, it reflects almost 80 % of donor transactions worldwide. It is a
good representation of the pediatric ARV market since
90 % of the children living with HIV are from sub-Saharan
African countries where provision of ARVs is largely
donor-funded. This analysis has several limitations that
should be noted. It could not take into account ARVs
for older children who can use adult formulations. In
Lee et al. BMC Pediatrics (2016) 16:41
Page 6 of 8
Table 1 Multivariate analysis of the factors associated with pricesd of pediatric antiretrovirals
ALL (n = 15,162)
Estimate
95 % CI
Originator (n = 5362)
Generic (n = 9800)
Estimate
Estimate
95 % CI
95 % CI
Years (Analysis performed in comparison to 2004)
2005
−0.06
[−0.14, 0.02]
0.00
[−0.10, 0.09]
−0.13
[−0.27, 0.00]
2006
−0.21c
[−0.29, −0.13]
−0.14b
[−0.24, −0.04]
−0.30c
[−0.44, −0.17]
2007
−0.33c
[−0.40, −0.26]
−0.1c
[−0.28, −0.10]
−0.46c
[−0.58, −0.34]
2008
−0.45
[−0.52, −0.38]
−0.27
[−0.36, −0.19]
−0.56c
[−0.68, −0.44]
2009
c
−0.49
[−0.56, −0.41]
c
−0.33
[−0.43, −0.23]
c
−0.60
[−0.73, −0.47]
2010
−0.50c
[−0.57, −0.43]
−0.29c
[−0.38, −0.19]
−0.62c
[−0.75, −0.50]
2011
c
−0.45
[−0.53, −0.38]
c
−0.45
[−0.56, −0.35]
c
−0.50
[−0.62, −0.38]
2012
−0.48c
[−0.56, −0.41]
−0.52c
[−0.63, −0.41]
−0.54c
[−0.66, −0.41]
−0.11c
[−0.16, −0.06]
c
c
Geographical regions (Analysis performed in comparison to sub-Saharan Africa excluding South Africa)
East Asia and Pacific
−0.03
Europe and Central Asia
c
0.28
Latin America and the Caribbean
0.07b
[−0.07, 0.02]
0.26c
[0.17, 0.35]
[0.22, 0.33]
c
a
0.66
[0.56, 0.76]
0.08
[0.02, 0.14]
[0.02, 0.11]
0.31c
[0.23, 0.38]
0.00
[−0.05, 0.05]
c
Middle East and North Africa
0.08
[0.00, 0.17]
0.29
[0.14, 0.44]
−0.05
[−0.14, 0.05]
South Asia
−0.13c
[−0.20, −0.06]
0.13
[−0.18, 0.44]
−0.13c
[−0.21, −0.06]
South Africa
−0.23c
[−0.29, −0.18]
−0.71c
[−0.81, −0.61]
0.24c
[0.17, 0.31]
Income group (Analysis done in comparison to low income countries)
Lower-middle income countries
0.04b
[0.02, 0.07]
0.14c
[0.09, 0.20]
0.02
[−0.01, 0.05]
Upper-middle income countries
c
[0.12, 0.22]
0.48c
[0.39, 0.58]
0.02
[−0.04, 0.07]
0.10c
[0.05, 0.16]
−0.35c
[−0.42, −0.29]
c
−0.48
[−0.56, −0.40]
0.17
Formulation type (Analysis done in comparison with single ARVs)
Double
0.01
Triple
[−0.04, 0.05]
b
−0.08
[−0.15, −0.02]
1 additional manufacturer
−0.04c
[−0.04, −0.03]
−0.02c
[−0.03, −0.01]
−0.08c
[−0.09, −0.07]
Log(quantity purchased)
−0.10
[−0.10, −0.09]
−0.11
[−0.12, −0.10]
−0.10c
[−0.10, −0.09]
Effects of competition and volume
c
c
Market segment (analysis done in comparison to generic)
0.72c
Originator
2
[0.70, 0.75]
Adjusted R
0.35
0.20
0.16
Sum of squared residuals
7413
2497
4404
a
significance level 0.05
b
significance level 0.01
c
significance level 0.001
d
Current USD
addition, it could not separate ARVs used for treatment
and those used for prevention of mother-to-child transmission (PMTCT). However, this is likely to have a negligible effect since the use of paediatric ARVs for
PMTCT is limited to two single ARVs, namely AZT or
NVP liquid formulations [25–27]. It should be noted
that this database represents procurement data and not
actual consumption data, and that the quantity and prices
calculated per formulation do not represent quantity and
prices of actual treatment regimens. The use of Ex-Works
prices in this analysis does not take into account other
costs such as transportation, insurance, import duties and
taxes. We have also noted differences in characteristics at
a national level, such as domestic manufacturing capacity
for some countries, but it would be difficult to incorporate
these into a global level analysis as conducted here.
Another analysis of the GPRM database by Perriens
et al. concluded that a great majority of pediatric ARV
formulations are being sold at prices that are profitable
when the prices were analysed with respect to active
pharmaceutical ingredient (API) cost, provided that the
cost of development can be recovered from sufficient
sales volume [28]. Children represent only 6 % of the
total number of people receiving ART in the 2012 WHO
survey [29] making the pediatric ARV market a small
and fragile market. The number of HIV infected children
Lee et al. BMC Pediatrics (2016) 16:41
is dwindling due to the success of prevention programs,
as evidenced by the number of children newly infected
with HIV dropping from 520,000 in 2000 to 240,000 in
2013 [30]. With a general lack of competition as shown
by the stagnation of prices in pediatric FDCs despite
relatively high volume of procurement, the pediatric
market contrasts with the adult market where prices
have decreased drastically over time; the median price
per treatment per year paid for adult first line treatment
regimens in low and middle income countries decreased 5
fold between 2003 and 2012 [23, 28]. The pediatric market
will become even smaller and more fragile if the scale-up
of treatment for children does not happen rapidly. WHO
recently recommended the development of 11 new
pediatric formulations, at the risk of a lack of interest
in their development by generic manufacturers who
need to recoup research and development costs from
the limited profit margins available in this small market
[2]. Therefore there is an urgent need to prioritize and
rationalize new formulation development with planned
phasing out of redundant formulations.
Many initiatives are taking place at the global level to
protect this market. In May 2011, a special pediatric working group from the Inter Agency Task Team on Prevention
and Treatment of HIV Infection in Pregnant Women,
Mothers and their Children produced a list of optimized
pediatric ARV formulations to guide donors, ministries of
health and procurement agencies to prioritize purchase of
pediatric formulations [31]. In parallel, UNITAID, Global
Fund, PEPFAR, UNICEF and other stakeholders have set
up a Pediatric ARV Procurement Working Group to align
procurement, promote product optimization, secure financing, engage with manufacturers and provide in-country
support.
Conclusions
The donor funded pediatric ARV market as represented
by the GPRM database is small, and lacks price competition. It is dominated by generic drugs due to the lower
prices offered and the practicality of FDC formulations.
This market requires continued donor support and the
current initiatives to protect it are important to ensure
market viability, especially if new formulations are to be
introduced in the future.
Availability of supporting data
Global Price Reporting Mechanism database is accessible
at />Abbreviations
ART: antiretroviral treatment; ARV: antiretroviral; FDC: fixed dose combination;
GFATM: Global Fund to Fight AIDS, Tuberculosis and Malaria; GPRM: Global
Price Reporting Mechanism; INCOTERMS: international commercial terms;
IP: intellectual property; LPV/r: lopinavir/ritonavir; PEPFAR: President’s
Emergency Plan; PTY: price per year; QTY: quantity per year; UNICEF: United
Page 7 of 8
Nations Children’s Fund; USFDA: United States Food and Drugs Administration;
WHO: World Health Organization.
Competing interests
The authors declare that they have no competing interests.
Authors’ contributions
LST and BDN had full access to all of the data in the analysis and take
responsibility for the integrity of the data and the accuracy of the data
analysis. JSFL and LST contributed to the design of the analysis; LST and BDN
contributed to the data collection and analysis of the study; JSFL, LST, BDN,
IJC and ML contributed to the interpretation of the data, preparation and
writing of the manuscript; all authors reviewed the final manuscript. All authors
read and approved the final manuscript.
Acknowledgements
We thank Susan Wells, Ph.D who edited the manuscript on behalf of DNDi.
The study was funded by DNDi, WHO and UMR912 SESSTIM (INSERM/IRD/
Aix-Marseille Université); WHO, UNITAID, Bill & Melinda Gates Foundation
provided funding for the GPRM database.
Author details
1
Drugs for Neglected Diseases initiative (DNDi), 15 Chemin Louis Dunant,
1202 Geneva, Switzerland. 2INSERM, UMR912 “Economics and Social Sciences
Applied to Health & Analysis of Medical Information” (SESSTIM), 13006
Marseille, France. 3Aix Marseille University, UMR_S912, IRD, 13006 Marseille,
France. 4ORS PACA, Southeastern Health Regional Observatory, 13006
Marseille, France. 5HIV Department, World Health Organization, Geneva,
Switzerland. 6Medical Research Council Clinical Trials Unit, Institute of Clinical
Trials and Methodology, University College London, London, UK.
Received: 11 November 2014 Accepted: 9 March 2016
References
1. Report G. UNAIDS report on the global AIDS epidemic 2013. Geneva:
UNAIDS; 2013.
2. World Health Organisation (WHO). Consolidated guidelines on the use of
antiretroviral drugs for treating and preventing HIV infection.
Recommendations for a public health approach. Geneva: WHO; 2013.
3. Drugs@FDA. FDA approved drug products [Online]. [cited 2014 January 14];
Available from: />4. Chokephaibulkit K, Plipat N, Cressey TR, Frederix K, Phongsamart W,
Capparelli E, et al. Pharmacokinetics of nevirapine in HIV-infected children
receiving an adult fixed-dose combination of stavudine, lamivudine and
nevirapine. AIDS. 2005;19:1495–9.
5. O’Brien DP, Sauvageot D, Zachariah R, Humblet P. In resource-limited
settings good early outcomes can be achieved in children using adult
fixed-dose combination antiretroviral therapy. AIDS. 2006;20:1955–60.
6. United Nations Children’s Fund, World Health Organisation. UNICEF/WHO
technical consultation: improving access to appropriate pediatric ARV
formulations. Geneva: UNICEF/WHO; 2004.
7. World Health Organization. Antiretroviral therapy of HIV infection in infants
and children in resource-limited settings: towards universal access –
recommendations for a public health approach – 2006. Geneva: WHO; 2006.
8. World Health Organization. Preferred antiretroviral medicines for treating
and preventing HIV infection in younger children – Report of the WHO
paediatric antiretroviral working group – 2007. [Online]. Geneva: WHO; 2008.
Available from: />index.html.
9. UNITAID. Paediatric HIV/AIDS project. Create the market for child-friendly
HIV medicines. [Online]. [cited 2014 January 13]; Available from URL: http://
www.unitaid.eu/en/paediatrics.
10. Waning B, Diedrichsen E, Jambert E, Bärnighausen T, Li Y, Pouw M, et al.
The global paediatric antiretroviral market: analyses of product availability
and utilization reveal challenges for development of paediatric formulations
and HIV/AIDS treatment in children. BMC Paediatrics. [serial online] 2010
[cited 2014 January 14], 10:74 [14 screens]. Available from: URL: http://www.
biomedcentral.com/1471-2431/10/74/.
11. Industry Liason Forum, International AIDS Society. Challenges in the
procurement and development of paediatric antiretroviral formulations.
Lee et al. BMC Pediatrics (2016) 16:41
12.
13.
14.
15.
16.
17.
18.
19.
20.
21.
22.
23.
24.
25.
26.
27.
28.
29.
30.
31.
Session report at the 6th International Conference on HIV Pathogenesis,
Treatment and Prevention. Rome; 2011.
UNAIDS. Global Plan towards the elimination of new HIV infections among
children by 2015 and keeping their mothers alive. 2011–2015. Geneva: Joint
United Nations Programme on HIV/AIDS (UNAIDS); 2011.
World Health Organisation. March 2014 Supplement to the 2013 consolidated
guidelines on the use of antiretroviral drugs for treating and preventing HIV
infection. Geneva: WHO; 2014.
World Health Organisation. Global price reporting mechanism for HIV,
tuberculosis and malaria [Online]. [cited 2014 January 18]; Available from:
/>Maronna RA, Yohai VJ. Robust regression with both continuous and
categorical predictors. J Stat Plann Inference. 2000;89:197–214.
Pharma Times Online. Breakthrough deal signed for paediatric HIV drugs
[Online]. 2006 December 1[cited 2014 January 18]; Available from: http://
www.pharmatimes.com/Article/06-12-01/Breakthrough_deal_signed_for_
paediatric_HIV_drugs.aspx.
Untangling the Web of antiretroviral price reductions 13th Edition. [Online].
2010 [cited 2014 January 14]; Available from URL: http://d2pd3b5abq75bb.
cloudfront.net/2012/07/16/14/39/31/171/UTW_13_ENG_Jul2010.pdf.
World Trade Organization. Least-developed country members - obligations
under Article 70.9 of the TRIPS Agreement with Respect to Pharmaceutical
Products. [Online].[cited 2014 February 4]; Available from: .
org/english/tratop_e/trips_e/art70_9_e.htm.
Moon S, Jambert E, Childs M, von Schoen- Angerer T. A win-win solution?:
A critical analysis of tiered pricing to improve access to medicines in
developing countries. Glob Health. 2011;7:39.
Yadav P. Differential pricing for pharmaceuticals: review of current knowledge,
new findings and ideas for action. A study conducted for the UK Department
for International Development (DFID). Zaragoza: MIT-Zaragoza International
Logistics Program; 2010. Available from: URL: />uploads/system/uploads/attachment_data/file/67672/diff-pcing-pharma.pdf.
Danzon PM, Towse A. Differential pricing for pharmaceuticals: reconciling
access, R&D and patents. Int J Health Care Finance Econ. 2003;3(3):183–205.
Perez C, Mace C, Berman D, Double J. Accessing ARVs: untangling the web
of price reductions for developing countries. 2001 [Online]. 2013 [cited 2015
August 6]; Available from URL: />07/16/14/39/31/171/UTW_13_ENG_Jul2010.pdf.
Untangling the Web of antiretroviral price reductions 16th Edition. [Online].
2013 [cited 2014 January 14]; Available from URL: http://d2pd3b5abq75bb.
cloudfront.net/2012/07/16/14/39/31/171/UTW_13_ENG_Jul2010.pdf.
Hawkins L. WHO/HAI Project on medicines prices and availability: review
series on Pharmaceutical pricing policies and interventions. Work paper 4:
competition policy. World Health Organisation and Health Action
International; 2011. />Competition%20final%20May%202011.pdf
World Health Organization. Antiretroviral drugs for treating pregnant
women and preventing HIV infection in infants. Guidelines on care,
treatment and support for women living with HIV/AIDS and their children
in resource-constrained settings. Geneva: WHO; 2004.
World Health Organization. Antiretroviral drugs for treating pregnant
women and preventing HIV infection in infants: towards universal access.
Recommendations for a public health approach (2006 revision). Geneva:
WHO; 2006.
World Health Organization. Antiretroviral drugs for treating pregnant women
and preventing HIV infection in infants. Recommendations for a public health
approach (2010 version). Geneva: WHO; 2010.
Perriens JH, Habiyambere V, Dongmo-Nguimfack B, Hirnschall G. Prices paid
for adult and paediatric antriretroviral treatment by low- and middle-income
countries in 2012: high, low or just right? Antivir Ther. 2014;19 suppl 3:39–47.
doi:10.3851/IMP2899.
Habiyambere V. Who Survey on ARV and diagnostic use 2012. Preliminary
results. (cited 2015 August 10) Available from />1-PP7.pdf.
Joint United Nations Programme on HIV/AIDS (UNAIDS). Global report:
UNAIDS report on the global AIDS epidemic 2013. Geneva: UNAIDS; 2013.
World Health Organization. Interagency Task Team on Prevention and
Treatment of HIV infection in Pregnant Women, Mothers and their Children
(IATT). Report of the Meeting of the Paediatric Working Group. Developing
an Optimized list of Paediatric ARV Formulations. Geneva: UNICEF/WHO; 2011.
Page 8 of 8
Submit your next manuscript to BioMed Central
and we will help you at every step:
• We accept pre-submission inquiries
• Our selector tool helps you to find the most relevant journal
• We provide round the clock customer support
• Convenient online submission
• Thorough peer review
• Inclusion in PubMed and all major indexing services
• Maximum visibility for your research
Submit your manuscript at
www.biomedcentral.com/submit