Familial risk and protective factors in alcohol intoxicated adolescents: Psychometric evaluation of the family domain of the Communities That Care Youth Survey (CTC) and a new short version
Bạn đang xem bản rút gọn của tài liệu. Xem và tải ngay bản đầy đủ của tài liệu tại đây (827.66 KB, 14 trang )
Kuttler et al. BMC Pediatrics (2015) 15:191
DOI 10.1186/s12887-015-0471-z
RESEARCH ARTICLE
Open Access
Familial risk and protective factors in
alcohol intoxicated adolescents:
psychometric evaluation of the family
domain of the Communities That Care Youth
Survey (CTC) and a new short version of the
Childhood Trauma Questionnaire (CTQ)
Heidi Kuttler*, Hanna Schwendemann and Eva Maria Bitzer
Abstract
Background: Alcohol intoxicated adolescents (AIA) in emergency department are an important target group for
prevention and valid information on their familial risk and protective factors (RPF) is crucial for implementing
customized family-based counseling in hospitals. We therefore, examined the psychometric characteristics of scales
which assess familial RPF.
Methods: We used seven family scales from the Communities That Care Youth Survey Instrument (CTC-F7); four
assess risk factors: family conflicts, poor family management, parental attitudes favorable towards drug use/
antisocial behavior; three assess protective factors: family attachment, opportunities and rewards for prosocial
involvement. To assess physical and emotional abuse and emotional neglect, we created a new scale composed of
six items from the Childhood Trauma Questionnaire (CTQ-6). We tested these eight scales on 342 AIA aged 13-17.
Based on the classical test theory we calculated descriptive item and scale statistics and internal consistency. We
assessed construct validity by confirmatory factor analysis with Maximum Likelihood (ML) estimation in a sample
with imputed missing values (EM-Algorithm). To check robustness, we repeated the analyses with complete cases,
with multiple imputed data, and with methods suitable for categorical data. We used SPSS 21, AMOS 21 and R
(randomForrest and lavaan package).
Results: Three of seven CTC-F scales showed poor psychometric properties in the descriptive analysis. A
ML-confirmatory model with five latent factors fitted the remaining CTC-F scales best (CTC-F5). The latent structure
of the CTQ-6 is characterized by three first-order factors (physical abuse, emotional abuse, emotional neglect) and
one second-order factor. The global goodness-of-fit indices for the CTC-F5 and the CTQ-6 demonstrated acceptable
fit (for both models: TLI and CFI>0.97, RMSEA<0.05). The confirmatory evaluation based on complete cases (n=266),
on multiple imputed data, and with alternative estimation methods produces global and local model-fit indices
that are comparable to those from the main analysis. The final subscales CTC-F5 and CTQ-6 show acceptable to
good internal consistency (α>0.7).
Conclusions: The final CTC-F5 and the newly developed CTQ-6 demonstrate acceptable to good psychometric
properties for the AIA sample. The CTC-F5 and the CTQ-6 facilitate a psychometrically sound assessment of familial
RPF for this vulnerable and important target group for prevention.
* Correspondence:
Public Health & Health Education, Freiburg University of Education,
Kunzenweg 21, 79117 Freiburg, Germany
© 2015 Kuttler et al. Open Access This article is distributed under the terms of the Creative Commons Attribution 4.0
International License ( which permits unrestricted use, distribution, and
reproduction in any medium, provided you give appropriate credit to the original author(s) and the source, provide a link to
the Creative Commons license, and indicate if changes were made. The Creative Commons Public Domain Dedication waiver
( applies to the data made available in this article, unless otherwise stated.
Kuttler et al. BMC Pediatrics (2015) 15:191
Background
One of the most significant risks worldwide for morbidity
and mortality in young people is alcohol [1]. Excessive
alcohol consumption in adolescence does not only point
to future disorders but accompanied by other risk factors,
it can be an indicator of already existing disorders or
problems. The hospitalization of adolescents following
acute alcohol intoxication presents a key opportunity for
initiating preventive measures, and the sound measurement of the individual’s risks and resources are the basis
for customized prevention. In Germany, prevention efforts
for alcohol intoxicated adolescents (AIA) include support
strategies for the entire family system [2]. A short but psychometric sound instrument to assess familial Risk and
Protective Factors (RPF) could provide counseling practitioners with relevant information. In this paper, we
present the psychometric evaluation of scales used to assess familial risk and protective factors among AIA.
Excessive alcohol consumption as major health risk in
adolescence
In Europe, 10 % of all deaths among young women are associated with alcohol consumption and at 25 % the death
rate for men is even higher, namely 13,000 men between
the age of 16 and 24 die annually from alcohol-related
causes [3]. Early and excessive alcohol consumption is
often linked to alcohol abuse later in life [1, 7–9] and to
further behavioral problems [4–6]. Puberty is an especially
vulnerable phase of life [10] and adolescents hospitalized
due to alcohol intoxication are an at-risk group whose
healthy development is threatened [11–14]. Family plays a
critical role in fostering children’s positive development,
and counseling of AIA has to take the whole family system
into consideration. That is our motivation to evaluate
measurements assessing RPF in the family. The implementation of timely early intervention measures based on
the family’s risk profile could help ensure customized
support measures and prevent mental health issues and
negative developmental cascades among AIA.
Familial risk and protective factors for adolescent
development
Studies show that adolescents with substance abuse have
less parental support and monitoring than their peers
[15–17] and are more likely to grow up in families with
parental addiction [18–20]. They are also frequently victims of sexual or physical abuse [21] which plays a central role in the development and persistence of many
severe disorders and illnesses such as violent behavior
[22], delinquency, depression [23] and other mental disorders [24, 25]. On the other hand, there is evidence that
the buffering effect of protective factors increases with
the increasing number of risk factors to which adolescents are exposed [26–29].
Page 2 of 14
Models of risk and protective factors try to predict the
onset and progression of disorders as a basis for planning
effective preventive intervention [26, 27, 30–32]. The
Social Development Model (SDM) provides a framework
for explaining healthy or problematic development of adolescents. In this model, the family environment emerges
as one of the main factors that influences adolescent development [4, 27, 28, 31, 33, 34]. In compliance with the
SDM, protective familial factors are a) opportunities for
adolescents’ positive involvement in the family b) promotion of such skills, and c) perceived rewards for prosocial
behavior [35, 36]. Routine tasks and responsibilities within
the family seem to be important protective factors especially for male adolescents [37]. Familial recognition for
prosocial involvement has been identified as a protective
factor for problem gambling in young adults [67]. Furthermore, an effect that could be seen across different cultures
is that continuous parental monitoring protects against
adolescent externalizing problem behavior [4]. Other significant protective factors are family attachment (conversations, outings), opportunities for prosocial involvement
(confiding in parents in case of problems, active inclusion
of adolescents), and recognition in the family (parents
offer praise and are proud of their children) [27, 39]. Risk
factors for a healthy development are low family attachment and weak parent–child bonding [40], lack of parental interest in children's school and friends, unclear and
inconsistent rules, lack of parental control, severe family
conflicts, and parental attitudes favorable towards antisocial behavior and substance abuse [27, 39].
The assessment of familial RPF could be the basis for
counseling aimed at reducing family risk factors and
amplifying protective factors. To our knowledge there is
no established instrument for target groups with an elevated risk for developmental hazards (such as AIA), that
assesses a broad array of familial RPF. With our study
we want to take a first step in developing a validated instrument to measure family RPF, which can provide
counselors in hospitals with the information needed to
carry out customized prevention measures.
Methods
Study sample and study design
We conducted our study in the same setting as the instrument’s future application. Between June 2012, and
October 2013 adolescents hospitalized following acute
alcohol intoxication, aged 13 to 17 years, were surveyed
in ten different hospitals throughout Germany [41]. The
questionnaire-based survey was carried out at the patient’s
bedside before the customary brief intervention measures
of the alcohol prevention program “HaLT” [11, 42, 43].
Written consent of both, parents and adolescents, was
collected by the specialized social workers together with
the routine waiver of medical confidentiality for the
Kuttler et al. BMC Pediatrics (2015) 15:191
Page 3 of 14
HaLT-program, and sent to the study center in Loerrach
(Germany). The questionnaire which was marked with a
personal identification number was sent to the study center in Freiburg (Germany).
Instruments
Communities That Care Youth Survey – seven family subscales
(CTC-F7)
RPF. It was developed to establish measures for the prevention of substance abuse, delinquency, and other behavior problems among adolescents in communities [27, 39].
The CTC is based on the Social Development Model and
has been used in the USA, Australia, the Netherlands,
England, Scotland and Germany [17, 45]. A German version of the CTC with eight family scales was used in the
Study to Addiction Prevention in Networks, “SPIN” [46].
Our CTC instrument contains seven family scales: family
conflicts, poor family management, parental attitudes favorable towards drug use and parental attitudes favorable
towards antisocial behavior, family attachment, opportunities for prosocial involvement and rewards for prosocial
involvement (CTC-F7) (Table 2). The response categories
range from 1 = “no” to 4 = “yes” or from 1 = “very wrong”
to 4 = “very right”. The eighth scale pertaining to a family
history of antisocial behavior (e.g. parental drug dealing or
drug use, and prison experience) was not included in our
test instrument because of the personal contact that the
adolescents and the parents had with the interviewer, who
was also the counselor in the prevention program.
The Communities That Care Youth Survey (CTC) developed within the US-American Communities That Care
Network [27, 35, 44] contains a broad range of familial
Creating a six-item short version of the Childhood Trauma
Questionnaire
Ethical approval
This study was approved by the ethic commission of the
State Medical Association Baden-Wurttemberg, Germany
(F-2012-035).
Sample
The sample comprised 342 adolescents with an average age
of 15.5 years (SD 1.21). 51.9 % were male. Seventeen percent of the candidates came from families with a migrant
background. Less than half of the adolescents lived with
both parents and 5.6 % were in institutional care (Table 1).
Table 1 Sociodemographic characteristics of the adolescents
surveyed
Number
in %
Age (years, Mean, SD)
308
15.5 (1.2)
Female sex
337
48.1
Family situation
342
With biological parents
46.5
With mother only
23.1
With mother and her partner
16.1
In an institution
5.6
With father (and his partner)
5.5
Other
3.7
Migration background
336
Maternal employment status
327
17.0
Full time
40.4
Part time
30.0
Not employed
19.6
Seeking employment
8.3
Other
1.7
Paternal employment status
299
Full time
78.6
Part time
10.0
Not employed
5.7
Seeking employment
5.0
Other
0.7
Family violence such as abuse and neglect are risks that
could indicate the necessity of immediate professional
intervention for AIA. The items in CTC-F do not cover
this area. Therefore, we supplemented the CTC scales with
items from the Childhood Trauma Questionnaire (CTQ).
CTQ is a 28 item questionnaire, based on retrospective
self-report and uses a five point Likert scale response system (1 = “never true” to 5 = “very often true”). It enjoys
widespread international acceptance [48–51], has already
been successfully tested on adolescents aged 12–17 years
[47] and has been used in several German surveys [52–55].
The CTQ covers, among others, the domains (1) physical
abuse, (2) emotional abuse, and (3) emotional neglect. We
examined these three CTQ domains [53], looking for items
with high factor loadings and high item-total correlation
and selected the two items for each of the three domains
which best matched both criteria (Table 3).
Psychometric evaluation
The psychometric evaluation of the CTC-family scales
and the CTQ items was executed separately in multiple
steps according to the classical test theory. First, we calculated descriptive item and scale statistics such as mean,
proportion of missing values, item difficulty, item-total
correlation, and internal consistency. Item difficulty was
calculated using the mean value of one item of all subjects
divided by the maximum value of this item. The itemtotal correlation is the correlation of one item with the
scale, treating ordinal data as if they conform to interval
scales. A Cronbach’s alpha higher than α = 0.8 is deemed
Kuttler et al. BMC Pediatrics (2015) 15:191
Page 4 of 14
Table 2 Initial risk and protective factor scales – family domain of the Communities That Care Youth Survey (CTC-F7)
Scale abbrev.
Family domain
Item abbrev.
Item description
FR_2
Poor family management
R45n
Parents ask about school performance
R45a
Parents know where I am
R45p
Parents notice when I come home late
R45d
Parents want me to call if I am going to come home late
R45g
Clear family rules
R45e
Parent would notice if I use drugs
R45f
Parents would find out if I skip school
R45b
Frequent yelling in the family
R45o
Repeated episodes of severe conflict
R45c
Repeated yelling about the same things
R44b
Favorable attitude towards alcohol use
R44d
Favorable attitude towards cigarettes
R44e
Favorable attitude towards marijuana
FR_3
FR_4
FR_5
FP_1
FP_2
FP_3
Family conflict
Parental attitudes favorable to drug use
Parental attitudes favorable to antisocial behavior
Family attachment
Family opportunities for prosocial involvement
Rewards for prosocial family involvement
as an adequate internal consistency for assessing interindividual differences [56, 57].
Secondly, we explored the uni-dimensionality of each
of the initial scales with exploratory factor analysis (EFA)
using the Maximum Likelihood method (ML). ML-EFA
extracts factors step-by-step and assesses with a χ2 test
whether the model fits the postulated structure across
Table 3 The six-item short form from Childhood Trauma
Questionnaire (CTQ-6)
Item
From the time of childhood until today …
R48d
I was hit with a belt, a stick or other hard object
R48c
People in my family hit me so hard it left bruises or marks
R48b
I thought my parents wished I had never been born
R48e
People in my family said hurtful or insulting things to me
R48ar
I felt loved
R48fr
People in my family felt close to each other
R44a
Favorable attitude towards skipping school
R44f
Favorable attitude towards stealing
R44g
Favorable attitude towards antisocial behavior
R44h
Favorable attitude towards child’s violent behavior
P45h
Mother: feel close to
P45j
Mother: communicate with
P45k
Father: feel close to
P45m
Father: communicate with
P45i
Mother: enjoys spending time together
P45l
Father: enjoys spending time together
P53e
Parents encourage family outings
P53c
Parents actively include adolescents in decision making
P53d
In case of problems can ask parents for help
P53b
Parents offer praise
P53a
Parents are proud
the entire population. The ML-EFA analyzes the shared
variance of a variable to reveal the underlying factor
structure [58].
Finally, construct validity was assessed by confirmatory
factor analysis (CFA), which has been shown to be an adequate method for testing theoretically assumed factor
structures of multidimensional scales. The ML method was
used to estimate the parameters, a procedure suitable if a
sufficient sample size is available. Modifications were made
by using goodness-of-fit indices [59]. Indicator reliability
(≥0.4), factor reliability (≥0.6), and average of measured
variance (≥0.5) are measures used to assess the convergent
validity of constructs at the local level [60, 61]. Usually a
Chi-Square test is performed to evaluate models' global
goodness-of-fit, but this test is not suitable for large samples such as ours. Therefore, we used the Comparative Fit
Index (CFI), the Tucker Lewis Index (TLI), and the Root
Mean Square Error of Approximation (RMSEA) to evaluate
Kuttler et al. BMC Pediatrics (2015) 15:191
Page 5 of 14
our models’ global goodness of fit. CFI and TLI values ≥
0.95 and RMSEA ≤ 0.05 indicate good model fit [61].
The main analyses were carried out with a sample that had
missing values imputed by the Expectation Maximization
(EM) Algorithm. EM is an effective, but not perfect technique to manage missing data. As a sort of sensitivity analysis we repeated the CFA (1) on the complete cases and
(2) with multiple imputations (N = 1000), to assure that
the use of single imputation did not produce parameter
estimates highly dependent on the imputed values [62].
Because of the non-normal distribution and categorical
type of data we performed the analysis using the bootstrapping ML method and we calculated the approximate model
fit value Standardized Root Mean square Residual (SRMR)
(≥0.10) [63]. Furthermore, we used polychloric correlation
matrices as input for CFA and Diagonally Weighted Least
Squares (DWLS) and robust measures for non-normal distributed categorical data estimation methods [64, 65].
Weighted Least Square Mean-Variance (WLSMV) adjusted
estimators were used to obtain appropriate fit indices. Additionally, we computed the Weighted Root Mean Square
Residual (WRMR) as an approximate model fit value.
The descriptive analysis, the internal consistency analysis, EM imputation, and EFA were calculated with
SPSS Version 21.0. The CFA using the ML was performed with AMOS software 21.0. Multiple imputed
data sets were created with the randomForest package of
R. For the additional CFA we used the lavaan (0.5.-18)
package for structural equation modeling implemented
in the R system for statistical computing [66].
Results
Descriptive item and CTC-F7 subscales and CTQ-6
characteristics
The descriptive statistics for all initial scales, based on
the original sample without imputed missing values are
summarized in (Table 4). The missing data in the subscales of CTC-F7 and CTQ-6 vary between 4.7 and
12.3 %. Scales with more items show a higher proportion
of missing data. Item difficulty and item-total correlation
show a high degree of heterogeneity. The CTC-FR_4
subscale “parental attitudes favorable to drug use” and
CTC-FR_5 subscale “parental attitudes favorable to antisocial behavior” do not perform well. The item-total correlation is low (ritc between 0.25 and 0.45) and the item
difficulty is high (pi between 0.25 and 0.33). Four of the
seven CTC-F7 subscales and the CTQ-6 reveal a satisfactory to acceptable internal consistency. The two scales
“parental attitudes favorable to drug use” (FR_4) and
“parental attitudes favorable to antisocial behavior”
(FR_5) show low internal consistency, as does the FR_2
scale “poor family management” (Table 4).
Exploratory assessment of uni-dimensionality of CTC-F7
subscales and CTQ-6
The EFA results are based on the single EM imputed data.
EFA produced satisfactory one-factor models only with
the FR_5 scale “parental attitudes favorable to antisocial
behavior” and the CTQ-6. The other scales had either insufficient model fits or were underidentified. For example,
for the FR_2 scale “poor family management”, the χ2 test
of model fit is significant χ2 (14) = 46.39; p < 0.00. This indicates that the model is not well defined. Furthermore,
the CTC subscale FR_4 “parental attitudes favorable to
drug use” shows negative degrees of freedom in the EFA.
This also points to an underidentified model. The χ2 test
for a one-factor solution is also significant (χ2 (9) = 33.06;
p < 0.00) for the FP_1 scale “family attachment” which refers to both parents. Relaxing EFA-model constraints and
allowing for factors with an Eigen value larger than one
result in a two-factor solution that distinguishes items
concerning the mother from those concerning the father.
In summary, the evaluation of the descriptive item statistics, internal consistency, and the exploratory analysis
of construct validity exhibit obvious deficiencies for four
of seven scales.
Confirmatory factor analysis – part 1: from CTC-F7 to CTC-F5
The results presented here are those from the main analysis, which means single EM imputed data and ML-CFA.
Table 4 Initial CTC-F7 and CTQ-6 – descriptive item and scale values
Domain abbrev. Domain
N items Missing % M (Max) Cα
ritc Min-Max Pi
EFA Min-Max
FR_2
Poor family management
7
9.1
22.7 (28) 0.69 0.32 – 0.47
FR_3
Family conflict
3
7.9
6.2 (12)
0.81 0.60 – 0.74
0.72 – 0.86 0.4 – 0.59
0.44 – 0.57 0.66 – 0.90
FR_4
Parental attitudes favorable to drug use
3
6.1
3.8 (12)
0.40 0.25 – 0.30
0.25 – 0.33 0.39 – 0.53
FR_5
Parental attitudes favorable to antisocial behavior
4
4.7
4.5 (16)
0.56 0.25 – 0.45
0.25 – 0.29 0.37 – 0.65
FP_1
Family attachment
6
12.3
17.2 (24) 0.79 0.47 – 0.67
0.51 – 0.79 0.37 – 0.93
FP_2
Family opportunities for prosocial involvement
3
8.2
9.4 (12)
0.74 0.53 – 0.60
0.68 – 0.76 0.63 – 0.79
FP_3
Rewards for prosocial family involvement
2
CTQ-6
Physical abuse, emotional abuse, emotional neglect 6
6.7
6.5 (8)
0.87 0.77
0.74 – 0.78 -
10.5
4.6 (24)
0.82 0.49 – 0.80
0.25 – 0.41 0.57 – 0.79
CTC = Communities that Care Youth Survey Instrument; CTQ = Childhood Trauma Questionnaire; M = Mean Value, Cα = Cronbach’s α total scale, ritc = Item-Total
Correlation, pi = Item Difficulty, EFA = Factor Weighting in Exploratory Factor Analysis
Kuttler et al. BMC Pediatrics (2015) 15:191
Page 6 of 14
The initial analysis included all 28 items of CTC-F7 and
aimed to replicate the seven first order latent factors.
However, this CFA-Model does not display satisfactory
model fit, row “CTC-F7 initial” (Table 5).
Results of the additional analyses are summarized in
Table 8, Table 9, Table 10 and Table 11 and referred to
where appropriate.
The descriptive item analysis, the CFA process and the
evaluation of global goodness-of-fit indices led to the
elimination of three scales: FR_2 “poor family management”, FR_4 “parental attitudes favorable to drug use”,
and FR_5 “parental attitudes favorable to antisocial behavior”. Based on the EFA and the residual correlations
which point to its two-dimensional structure the FP_1
scale “family attachment” was divided into two scales:
FP_1a “attachment to mother” and FP_1b “attachment
to father”. The division leads to an improvement in the
model, but only when strong correlations of the error
terms between the (now) two scales are permitted. Also,
the residual correlation between the construct “family
conflict” (FR_3) and the item p45h (Do you get along
with your mother?) (r = 0.23) points to difficulties. Estimating the CTC-F5 model separately in subgroups of
adolescents living either (a) with both parents, (b) with a
single mother and new partner or (c) in another family
situation (e.g. juvenile shelter, living alone) shows: the residual correlations between FP_1a “attachment to mother”
and FP_1b “attachment to father” are much lower in
models b and c than in model a. Indicators of the latent
construct “parental/mother/father attachment” may not
measure the same construct in adolescent groups differing
by family structure. A formal assessment of measurement
invariance was beyond the scope of this analysis and for
the time being we think the two factor solution is more
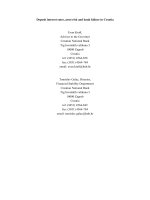
appropriate than the single factor solution, because a substantial proportion of the adolescents live in single parent
families. The final structure of the (modified) CTC-F5 is
displayed in Fig. 1.
The local model fit indices of the final CTC-F5 model
range with regard to the values of the standardized factor
Table 5 Initial and final CTC-F7 and CTQ-6 - confirmatory factor
analysis (ML method, EM imputation; global goodness-of-fit indices)
Model/Fit index Χ2
Χ2/ df p
TLI
Acceptable Fit
<3
>0.95 >0.95 <0.08
Good Fit
<2
>0.05 >0.97 >0.97 <0.05
df
CFI
RMSEA
CTC-F7 initial
1193.93 329 3.63
0.00
0.72
0.75
0.088
CTC-F5 final
91.14
62
1.47
0.009
0.98
0.99
0.037
CTQ-6 initial
193.86
9
21.54
0.00
0.61
0.76
0.25
CTQ-6 final
15.08
6
2.51
0.02
0.97
0.99
0.07
CTC = Communities that Care Youth Survey Instrument; CTQ = Childhood Trauma
Questionnaire; Χ2 = Chi-Squared; df = degrees of freedom; Χ2/df = Standardized
Chi-Squared; TLI = Tucker-Lewis Index; CFI = Comparative Fit Index; RMSEA = Root
Mean Square Error of Approximation
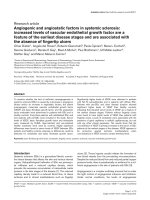
weighting between 0.65 and 0.91 and indicator reliability is
always >0.4 (Table 6). Item p53e (My parents frequently
want me to do things together with them) has the lowest
weighting within the FP_2 scale “opportunities for prosocial
involvement”. There is a correlation of r = 0.82 between the
construct “mother” and the FP_2 scale. There is further
correlation between “mother” and the FP_3 scale “rewards
for prosocial involvement” (r = 0.68) and between the
two constructs FP_2 and FP_3 (r = 0.87). There is a
negative correlation between FP_1a “mother” and
FR_3 “family conflict” (r = −0.57), between FR_3 and
FP_2 (r = −0.71), as well as FR_3 and FP_3 (r = −0.65)
(Fig. 1).
Indices of global goodness of fit of the CTC-F5 are
summarized in Table 5. The modified CTC-F5 model is
improved in comparison with the initial model and
shows good to acceptable global and local fit. All values
are within an acceptable range and the modified models
also display satisfactory local values.
The final model for the CTC-family domain consists
of five subscales: the risk-factor scale: FP_3 “family conflict” and the protective-factor scales: FP_1a attachment
to mother, FP_1b attachment to father, FP_2 “opportunities for prosocial involvement” and FP_3 “rewards for
prosocial involvement”. The descriptive statistics of the
modified CTC-F5 subscales also show satisfactory results
(Table 7).
To check if the results were biased because of the nonoptimal estimation method, we performed (1) a CFA using
the complete cases (n = 266, results not presented). This
leads to model-fit values comparable to those with imputed
data (n = 342). (2) We also analyzed the model using multiple imputed data (N = 1000). The results presented in
Tables 8, 9 and 10, return good model-fit values.
This shows that it is unlikely that substantial distortion
is caused by single imputation of the missing values. The
CFA with bootstrapping method shows that the standard
errors are not biased (Table 10). CFA with multiple imputed data, polychoric correlations as input and robust
estimation methods for categorical data leads to comparable results presented here (Table 11).
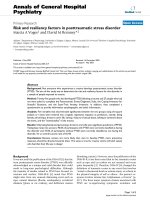
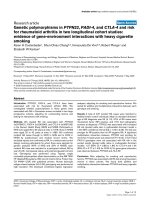
Confirmatory factor analysis – part 2: CTQ-6
The initial ML-CFA with EM imputed data of the six-item
short version of the CTQ with one first order factor does
not fit the data well (Table 5, row “CTQ-6 initial”). Based
on the modification indices [59] which indicated a reduction of the χ2 statistics, a model where the two items of
each dimension were explained by a latent first-order factor each, and a general second-order factor explaining the
three first-order factors (physical abuse, emotional abuse
and emotional neglect) fitted the data well (Fig. 2). With
this structure, the final model displays very good local and
global goodness-of-fit (Tables 5, and 6).
Kuttler et al. BMC Pediatrics (2015) 15:191
Page 7 of 14
Fig. 1 Final structural equation model – CTC-F5
The CFA based on complete cases (n = 266, results not
presented) and based on multiple imputed data sets (N =
1000) (Tables 8, 9, and 10) produces model-fit values comparable to those from the analysis with imputed data (n =
342). This also prevents bias caused by imputation. The
underlying structure of the newly derived CTQ-6 short
version is similar to that of the original long version, indicating construct validity.
Discussion
It was our objective to conduct a psychometric evaluation
and optimization of a collection of scales which assess familial RPF in individuals who belong to a vulnerable group
i.e. young alcohol intoxicated patients. We combined
seven CTC scales to assess familial RPF for adolescents.
Originally, these scales were used to differentiate between
groups with specific risk profiles as a reference for community prevention planning. Because the CTC-F7 scales
do not assess physical and emotional abuse and emotional
neglect - severe threats to the healthy development of AIA
which could require intense or immediate professional
intervention – we designed a CTQ brief scale with six
items, two from each of the domains mentioned above.
Descriptive, exploratory and confirmatory analysis revealed that three of the seven CTC-F7-scales show poor
psychometric properties in AIA. Those three CTC-family
subscales are “poor family management” and especially
“parental attitudes favorable to drug use” (α = 0.40)
and “parental attitudes favorable to antisocial behavior” (α = 0.56). The authors of the original instrument
which has been tested in the United States report that the
internal consistency of the CTC-family subscale ranges
from 0.62 to 0.83 [27]. In an Australian school survey
[38], the internal consistency of the family-RPF scale
ranges from α = 0.72 to 0.81. Due to the fact that the three
scales mentioned above also performed rather poorly in
the German SPIN study of school children with values of
α = 0.59 (parents' attitudes favorable to drug use) and
α = 0.70 (parents' attitudes favorable to antisocial behavior) [29] (personal communication), we think the
better performance within the USA and Australian
surveys is not only due to the very different target
group surveyed in the samples (AIA vs. school children), but can be partly explained by the difference of
parenting styles between Germans, U.S. Americans
and Australians.
Kuttler et al. BMC Pediatrics (2015) 15:191
Page 8 of 14
Table 6 Final CTC-F5 and CTQ-6 - local goodness-of-fit criteria (ML method, EM imputation)
Scale abbrev.
Item abbrev.
Indicator-reliability
Weight
≥0.4
≥0.5
R45b
0.77
0.88
1a
R45o
0.64
0.80
16.1***
R45c
0.45
0.67
13.06***
P45h
0.65
0.81
1a
P45j
0.53
0.72
14.19***
P45i
0.60
0.78
14.51***
P45k
0.72
0.85
19.93***
Acceptable fit indices
t-Value of factor weight
FR_3
FP_1a
FP_1b
P45m
0.61
0.78
18.18***
P45l
0.83
0.91
1a
P53e
0.43
0.65
11.76***
P53c
0.51
0.71
12.84***
P53d
0.57
0.75
1a
P53b
0.78
0.88
19.38***
P53a
0.78
0.88
1a
FP_2
FP_3
CTQ-6
R48ar
0.79
0.89
10.24***
R48fr
0.48
0.69
8.05***
R48b
0.57
0.76
1a
R48e
0.58
0.76
11.54***
R48d
0.52
0.72
1.00***
R48c
0.94
0.97
10.99***
Factor-reliability
AVE
≥0.6
≥0.5
0.82
0.61
0.81
0.58
0.89
0.72
0.75
0.50
0.87
0.78
0.90
0.60
CTC = Communities That Care Youth Survey Instrument; CTQ = Childhood Trauma Questionnaire
*** p ≤ 0.001; AVE = Average Variance Extracted; a = parameter fixed to the value 1 to allow identification
A factor contributing to the particularly low internal
consistency of the CTC-subscales “parental attitudes favorable to drug use” and “parental attitudes favorable to
antisocial behavior” in our survey might be the setting. In
the German SPIN survey, the internal consistency of these
scales was lower than it was in the US and Australian
surveys but higher than in ours. It seems plausible that
the overwhelming majority of adolescents hospitalized for
alcohol intoxication felt that their parents would not
accept drug use and antisocial behavior and answered
these items more uniformly because their alcohol-related
hospitalization had probably caused conflict with their
Table 7 Final CTC-F5 and CTQ-6 - descriptive item und subscale values
Scale abbrev. Family domain
N items Missing % M (Max) Cα
ritc Min-Max Pi
EFA Min-Max
FR_3
Family conflict
3
7.9
6.2 (12)
0.81 0.60 – 0.74
0.44 – 0.57 0.66 – 0.90
FP_1a
Attachment to mother
3
8.2
9.1 (12)
0.80 0.64 – 0.66
0.63 – 0.69 0.75 – 0.78
FP_1b
Attachment to father
3
9.9
8.1 (12)
0.88 0.71 – 0.81
0.51 – 0.70 0.75 – 0.78
FP_2
Family opportunities for prosocial involvement
3
8.2
9.4 (12)
0.74 0.53 – 0.60
0.68 – 0.76 0.63 – 0.79
FP_3
Rewards for prosocial family involvement
2
6.7
6.5 (8)
0.87 0.77
0.74 – 0.78 -
CTQ-6
Physical and emotional abuse and emotional neglect 6
10.5
4.6 (24)
0.82 0.49 – 0.80
0.25 – 0.41 0.57 – 0.79
CTC = Communities that Care Youth Survey Instrument; CTQ = Childhood Trauma Questionnaire; M = mean value, Cα = Cronbach’s total scale, ritc = item total
correlation, pi = item difficulty, EFA = factor loading in Exploratory Factor Analysis
Kuttler et al. BMC Pediatrics (2015) 15:191
Page 9 of 14
Table 8 Initial and final CTC-F7 and CTQ-6 - confirmatory factor analysis (multiple imputation and bootstrapping ML, global
goodness-of-fit indices)
Χ2
Model/Fit indices
df
Χ2/ df
Acceptable Fit
<3
Good Fit
<2
p
TLI
CFI
RMSEA
>0.95
>0.95
<0.08
SRMR
>0.05
>0.97
>0.97
<0.05
≤0.10
CTC-F7 initial
11796.92
329
358.4
0.00
0.65
0.70
0.10
0.11
CTC-F5 final
9301.71
62
150.03
0.00
0.95
0.97
0.07
0.03
CTQ-6 initial
20669.61
9
2296.62
0.00
0.58
0.75
0.26
0.10
CTQ-6 final
1581.29
6
263.55
0.00
0.95
0.98
0.09
0.03
CTC = Communities that Care Youth Survey Instrument; CTQ = Childhood Trauma Questionnaire; Χ = Chi-Squared; df = degrees of freedom; Χ /df = Standardized
Chi-Squared; TLI = Tucker-Lewis Index; CFI = Comparative Fit Index; RMSEA = Root Mean Square Error of Approximation
2
2
Table 9 Final CTC-F5 and CTQ-6 - confirmatory factor analysis (multiple imputation and bootstrapping ML, local goodness-of-fit
criteria)
Scale abbrev.
Item abbrev.
Indicator-reliability
Weight
≥0.4
≥0.5
R45b
0.77
0.87
1a
R45o
0.62
0.71
158.0***
R45c
0.44
0.67
129.41***
P45h
0.64
0.80
1a
P45j
0.53
0.73
140.62***
P45i
0.59
0.77
141.47***
P45k
0.71
0.84
191.07***
P45m
0.58
0.76
172.04***
P45l
0.83
0.91
1a
P53e
0.43
0.66
116,12***
P53c
0.51
0.72
126.92***
P53d
0.55
0.74
1a
P53b
0.77
0.88
187.49***
P53a
0.77
0.88
1a
Acceptable Fit
t-Value of factor weight
FR_3
FP_1a
FP_1b
FP_2
FP_3
CTQ-6
R48ar
0.84
0.92
101.923***
R48b
0.55
0.74
1a
R48e
0.60
0.77
107.43***
R48fr
0.48
0.70
83.17***
R48c
0.93
0.96
109.24***
R48d
0.52
0.72
94.8***
Factor-reliability
AVE
≥0.6
≥0.5
0.82
0.61
0.80
0.58
0.88
0.71
0.75
0.50
0.87
0.77
0.89
0.59
CTC = Communities that Care Youth Survey Instrument; CTQ = Childhood Trauma Questionnaire; *** p ≤ 0.001; AVE = Average Variance Extracted; a = parameter
fixed to the value 1 to allow identification
Kuttler et al. BMC Pediatrics (2015) 15:191
Page 10 of 14
Table 10 Final CTC-F5 and CTQ 6 - bootstrapping estimates of standard error
Scales
Item abbrev.
SE
SE-SE
Mean
Bias
SE-Bias
CTC
FR_3
FP1b
FP2
FP3
FP1a
CTQ-6
Emotional_neglect
Emotional_abuse
Physical_abuse
R45b
0.002
0.00
0.875
0.00
0.00
R45o
0.004
0.00
0.790
0.00
0.00
R45c
0.003
0.00
0.667
0.00
0.00
P45l
0.002
0.00
0.910
0.00
0.00
P45m
0.002
0.00
0.763
0.00
0.00
P45k
0.003
0.00
0.841
0.00
0.00
P53d
0.004
0.00
0.745
0.00
0.00
P53c
0.004
0.00
0.717
0.00
0.00
P53e
0.004
0.00
0.658
0.00
0.00
P53a
0.004
0.00
0.878
0.00
0.00
P53b
0.003
0.00
0.880
0.00
0.00
P45h
0.003
0.00
0.802
0.00
0.00
P45j
0.004
0.00
0.729
0.00
0.00
P45i
0.004
0.00
0.767
0.00
0.00
Emotional_neglect
0.00
0.00
1.00
0.00
0.00
Emotional_abuse
0.021
0.001
1.099
0.001
0.001
Physical_abuse
0.015
0.001
0.621
0.001
0.001
R48ar
0.00
0.00
1.0
0.00
0.00
R48fr
0.01
0.001
0.784
0.001
0.001
R48b
0.00
1.00
0.00
0.00
0.00
R48e
0.018
0.001
1.3
0.001
0.001
R48c
0.021
0.001
1.452
0.00
0.001
R48d
0.00
1.00
0.00
0.00
0.00
CTC-F5 = Communities that Care Youth Survey Instrument, family scales; CTQ-6: Six item short form of the Childhood Trauma Questionnaire; SE: Standard Error
parents. In summary, we would not recommend the use
of these three scales in AIA due to their unsatisfactory
psychometric properties.
The confirmatory factor analysis of the CTC-F5 not only
portrays an adolescent’s close relationship to both parents
plausibly, but also shows significant differences between the
family roles of the mother and the father within the different samples in Germany and the United States. In our sample, a relatively high negative correlation can be detected
between the mother and “family conflict” (r = −0.57). In the
US study, there was low negative correlation between both
parents and the “family conflict” subscale (r = −0.25) [44].
In the AIA sample mothers offer adolescents more “opportunities for prosocial involvement” than fathers do
(r = 0.82/r = 0.51) and show more “rewards for prosocial
involvement” (r = 0.68/r = 0.36). In the US study we find
a higher correlation for fathers with regard to prosocial
involvement than in our German study: “opportunities
Table 11 Initial and final CTC-F5 - confirmatory factor analysis (polychoric correlation matrix as CFA input, diagonally weighted least
squares estimation & robust methods)
Model/Fit indices
Χ2
df
Acceptable Fit
p
<3
Good Fit
CTC-F5 DWLS Model A
Χ2/ df
<2
14967.4
91
TLI
CFI
RMSEA
>0.95
>0.95
<0.08
>0.05
>0.97
>0.97
<0.05
0.00
1
1
0.02
WRMR
0.4
CTC-F5 Robust Model A
5394:86
91
0.00
0.98
0.99
0.06
0.4
CTC-F5 Robust Model B
5394:86
91
0.00
0.99
0.99
0.05
0.34
CTC = Communities that Care Youth Survey Instrument; DWLS = Diagonally Weighted Least Squares, Robust; Χ2 = Chi-Squared; df = degrees of freedom; Χ2/df = Standardized
Chi-Squared; TLI = Tucker-Lewis Index; CFI = Comparative Fit Index; RMSEA = Root Mean Square Error of Approximation; WRMR = Weighted Root Mean Square Residual
Model A: without correlation between latent variable FR_3_Conflict and the measurement error of item p45h (e23)
Model B: with correlation between latent variable FR_3_Conflict and the measurement error of item p45h (e23)
Kuttler et al. BMC Pediatrics (2015) 15:191
Page 11 of 14
Fig. 2 Final structural equation model – CTQ-6
for prosocial involvement” (r = 0.63) and “rewards for
prosocial involvement” (r = 0.51) [44]. Mothers in the
German sample play a much more influential role in the
children’s upbringing than fathers do. This difference is
less pronounced in the US sample.
Our final CTC-F5, with two scales created by the division of the family attachment scale provides satisfactory
model fit and a plausible latent structure. In a CTC survey
conducted in the USA, the postulated model also could
not be corroborated with regard to the scale “family attachment” and, like ours, it was divided into two constructs “attachment to mother” and “attachment to father”.
This generated a model that described the data well
and had a satisfactory model-fit index (χ2(629) = 120.19;
TLI = 0.97; RMSEA = 0.06) [44]. The latent construct
“family attachment” entails further investigation because our data indicate that adolescents living with
both parents might conceptualize it differently than
those living with a single parent. A formal assessment
of measurement invariance for these scales should be
carried out in a next step.
Though Glaser emphasizes the fact that the CTC Survey
was not created as a diagnostic instrument for individual
comparisons but as a tool for planning community prevention strategies [44], the psychometric properties of the
CTC-F5 scales presented here warrant their use to describe individual risk profiles for adolescents hospitalized
for acute alcohol intoxication.
CTQ-6
The original three CTQ subscales emotional and physical
abuse and emotional neglect showed satisfactory internal
consistency in a German representative sample (physical
abuse α = 0.89; emotional abuse α = 0.80; emotional neglect α = 0.83) [53]. Our abridged six-item ultra-short version not only replicates the original three factorial
structure but also conforms to a general (second order)
factor that could be called “childhood abuse and neglect”.
In our AIA sample, it has an internal consistency sufficiently high to be used for individual comparisons. We
think the CTQ-6 is a very promising short tool to assess
childhood abuse and neglect under time constraints in
preventive or clinical practice and its use in further applications like the screening of AIA merits further research.
Limitations
One limitation to our findings is caused by the organizational
structure of the survey which was carried out within the
context of the prevention program HaLT by specialized
social workers. Our test conditions optimally mirror the
future setting of the planned instrument’s implementation.
However, the personal contact with prevention personal
might have caused bias towards social desirability.
Additionally, the results on the construct validity are
limited by the fact that the final models are based on a
fitting process in a single sample. Our attempts to check
for the robustness of the main analyses cannot overcome
Kuttler et al. BMC Pediatrics (2015) 15:191
this problem, but the high congruence of these results is
promising. However, to be sure that the models are
generalizable and not over-fitted to the current dataset,
replication in an independent sample is required.
A further point is the measurement equivalence of the
CTC-F5 and the CTQ-6. As we mentioned, some of the
family scales seem to have different latent structures depending on the adolescent’s family structure. This should
be investigated in further analyses, maybe with other samples e.g. samples from the CTC survey or the SPIN survey.
Other aspects of measurement invariance concern the extent to which the psychometric properties of the CTC-F5
and the CTQ-6 are transportable or generalizable across
other groups (e.g. gender, ethnicity). Glaser verified the
applicability of the CTC survey in respect to differences in
ethnicity and sex [44]. In our case, a comparable analysis
is also called for since 17 % adolescents come from families with a migrant background. Unfortunately, this is not
possible because our sample is too small.
Last, our results are just a snap shot and cannot verify
the predictive ability of the tool. Though, the predictive
ability of the CTC survey instrument has been assessed
within the framework of the International Youth Development Study (IYDS) on problem gambling [67] and in studies on alcohol and substance abuse in adolescence [68]. In
our case, the valid measure of the key familial RPF and
developmental hazards using two abridged tools was developed for a special group of adolescents at risk of abusing alcohol.
It would be beneficial if the implementation of this tool
could be tested in other subpopulations with an elevated
risk for developmental hazards, for example, adolescents
in residential or non-residential youth care services.
Conclusion
In combination, CTC-F5 and CTQ-6, two brief, internally consistent instruments with promising construct validity, create an effective tool to assess familial risk and
protective factors as well as childhood abuse and neglect
in an already vulnerable group of adolescents, i.e. those
hospitalized following acute alcohol intoxication. The
tool’s psychometric characteristics warrant its implementation in customized preventive services for adolescents
and their families. However, these findings require replication in an independent sample.
Competing interests
The authors declare that they have no competing interests.
Authors’ contributions
HK conceived the study, participated in its design, coordination and data
acquisition and significantly contributed to the interpretation of the data
and to the drafting of the manuscript. HS planned and performed the
statistical analysis, participated in drafting the manuscript, and significantly
contributed to the interpretation of the results. EMB provided substantial
input to the study design, statistical analysis, and interpretation of the data.
Page 12 of 14
She revised the manuscript critically for important intellectual content.
All authors read and approved the final manuscript.
Acknowledgements
The authors thank their colleagues from the RiScA Group: Dr. Ulrich S.
Zimmermann and Cornelius Groß, Dresden; Prof. Dr. Olaf Reis and Stefanie
Bumke, Rostock; Prof. Dr. Ludwig Kraus and Dr. Daniela Piontek, Munich.
The authors thank Felix Groeger-Roth from Landespraeventionsrat Niedersachsen (Federal Prevention Council of Lower Saxony) and Prof. Dr. Renate
Soellner, Hildesheim University for providing the German version of the
Communities That Care questionnaire and survey data.
We thank the Federal Centre for Health Education (Bundeszentrale fuer
gesundheitliche Aufklaerung, Köln), for supplying us with USB flash drives,
which we used as incentives for the participating adolescents.
We thank Dr. Heinz-Werner Priess, AGENON, Berlin, for his unlimited, invaluable and very instructive statistical advice.
Funding source
The study was funded by the German Ministry of Health (Grant ID:
IIA5-2511DSM220). The Ministry played no role in design, in the collection,
analysis, and interpretation of data, in the writing of the manuscript; or in the
decision to submit the manuscript for publication.
Received: 12 August 2014 Accepted: 2 October 2015
References
1. Catalano RF, Fagan AA, Gavin LE, Greenberg MT, Irwin CE, Ross DA, et al.
Worldwide application of prevention science in adolescent health. Lancet.
2012;379:1653–64. doi:10.1016/S0140-6736(12)60238-4.
2. Lang S, Kuttler H. Bundesmodellprojekt HaLT - Trainermanual und
Projektdokumentation. 1st ed. Lörrach: Villa Schöpflin; 2007.
3. Anderson P, Baumberg B. Alcohol in Europe - A public health perspective: A
report for the European Commission. Luxembourg: Institute of Alcohol
Studies UK; 2006
4. Piko BF, Fitzpatrick KM, Wright DR. A risk and protective factors framework
for understanding youth’s externalizing problem behavior in two different
cultural settings. Europ Child & Adolescent Psych. 2005;14:95–103.
doi:10.1007/s00787-005-0437-z.
5. Rothman EF, Stuart GL, Greenbaum PE, Heeren T, Bowen DJ, Vinci R, et al.
Drinking style and dating violence in a sample of urban, alcohol-using
youth. J Stud Alcohol Drugs. 2011;72:555–66.
6. Hummel A, Shelton KH, Heron J, Moore L, van den Bree MBM. A systematic
review of the relationships between family functioning, pubertal timing and
adolescent substance use. Addiction. 2013;108:487–96. doi:10.1111/add.12055.
7. Behrendt S, Wittchen H, Höfler M, Lieb R, Low NCP, Rehm J, et al. Risk and
speed of transitions to first alcohol dependence symptoms in adolescents: a
10-year longitudinal community study in Germany. Addiction.
2008;103:1638–47. doi:10.1111/j.1360-0443.2008.02324.x.
8. Buchmann AF, Schmid B, Blomeyer D, Becker K, Treutlein J, Zimmermann
US, et al. Impact of age at first drink on vulnerability to alcohol-related
problems: testing the marker hypothesis in a prospective study of young
adults. J Psychiatr Res. 2009;43:1205–12. doi:10.1016/j.jpsychires.2009.02.006.
9. Buchmann AF, Schmid B, Blomeyer D, Zimmermann US, Jennen-Steinmetz C,
Schmidt MH, et al. Drinking against unpleasant emotions: possible outcome of
early onset of alcohol use? Alcohol Clin Exp Res. 2010;34:1052–7. doi:10.1111/
j.1530-0277.2010.01180.x.
10. Blomeyer D, Friemel CM, Buchmann AF, Banaschewski T, Laucht M,
Schneider M. Impact of pubertal stage at first drink on adult drinking
behavior. Alcohol Clin Exp Res. 2013;37:1804–11. doi:10.1111/acer.12154.
11. Steiner M, Knittel T, Zweers U. Wissenschaftliche Begleitung des
Bundesmodellprogramms “HaLT - Hart am LimiT“- Endbericht. Berlin,
Basel; 2008.
12. Reis O, Pape M, Häßler F. Ergebnisse eines Projektes zur kombinierten
Prävention jugendlichen Rauschtrinkens. SUCHT - Zeitschrift für
Wissenschaft und Praxis/Journal of Addiction Research and Practice.
2009;55:347–56.
13. Uhl A, Kobrna U. Rauschtrinken bei Jugendlichen - Medienhype oder
bedenkliche Entwicklung. Suchtherapie. 2012;13:15–24.
14. Schwendemann H, Kuttler H, Bitzer EM. Entwicklungsgefährdung bei
Jugendlichen mit Alkoholintoxikation prognostizieren. SUCHT - Zeitschrift
Kuttler et al. BMC Pediatrics (2015) 15:191
15.
16.
17.
18.
19.
20.
21.
22.
23.
24.
25.
26.
27.
28.
29.
30.
31.
32.
33.
34.
35.
36.
für Wissenschaft und Praxis/Journal of Addiction Research and Practice.
2015;61:223–36.
Resnick MD, Bearman PS, Blum RW, Bauman KE, Harris KM, Jones J, et al.
Protecting Adolescents From Harm: Findings From the National Longitudinal
Study on Adolescent Health. J Am Med Assoc. 1997;278:823–32. doi:10.1001/
jama.1997.03550100049038.
Spirito A, Barnett N, Lewander W, Colby S, Rohsenow D, Eaton C, et al. Risks
associated with alcoho-positive status among adolescents in the emergency
department: A matched case–control study. J Pediatr. 2001;139/5:396–402.
Hemphill SA, Kotevski A, Herrenkohl TI, Bond L, Kim MJ, Toumbourou JW,
et al. Longitudinal consequences of adolescent bullying perpetration and
victimisation: a study of students in Victoria, Australia. Crim Behav Ment
Health. 2011;21:107–16. doi:10.1002/cbm.802.
Werner EE, Johnson JL. The Role of Caring Adults in the Lives of Children of
Alcoholics. Subst Use Misuse. 2004;39:699–720. doi:10.1081/JA-120034012.
Yoon G, Westermeyer J, Kuskowski MA, Nesheim L. Impact of the Number
of Parents With Alcohol Use Disorder on Alcohol Use Disorder in Offspring.
J Clin Psychiatry. 2013;74:795–801. doi:10.4088/JCP.13m08350.
Langlois KA, Garner R. Trajectories of psychological distress among
Canadian adults who experienced parental addiction in childhood. Health
Rep. 2013;24:14–21.
Begle A, Hanson R, Danielson C, McCart M, Ruggiero K, Amstadter A, et al.
Longitudinal pathways of victimization, substance use, and delinquency:
findings from the National Survey of Adolescents. Addict Behav.
2011;36:682–9. doi:10.1016/j.addbeh.2010.12.026.
Lansford JE, Miller-Johnson S, Berlin LJ, Dodge KA, Bates JE, Pettit GS. Early
Physical Abuse and Later Violent Delinquency: A Prospective Longitudinal
Study. Child Maltreat. 2007;12:233–45. doi:10.1177/1077559507301841.
Stuewig J. The Relation of Child Maltreatment to Shame and Guilt Among
Adolescents: Psychological Routes to Depression and Delinquency. Child
Maltreat. 2005;10:324–36. doi:10.1177/1077559505279308.
Goodwin RD, Fergusson DM, Horwood JL. Childhood abuse and familial
violence and the risk of panic attacks and panic disorder in young
adulthood. Psychol Med. 2005;35:881–90. doi:10.1017/S0033291704003265.
Bader K, Hänny C, Schäfer V, Neuckel A, Kuhl C. Childhood Trauma Questionnaire
– Psychometrische Eigenschaften einer deutschsprachigen Version. Z Klin Psychol
Psychother. 2009;38:223–30. doi:10.1026/1616-3443.38.4.223.
Bond L, Thomas L, Toumbourou J, Patton G, Catalano R. Improving the
Lives of Young Victorians in Our Community: a survey of risk and
protective factors. Melbourne: Community Care Division, Dept. of Human
Services; 2000.
Arthur MW, Hawkins JD, Pollard JA, Catalano RF, Baglioni Jr AJ. Measuring
Risk And Protective Factors For Substance Use, Delinquency, And Other
Adolescent Problem Behaviors: The Communities That Care Youth Survey.
Eval Rev. 2002;26:575–601. doi:10.1177/019384102237850.
Ostaszewski K, Zimmerman MA. The effects of cumulative risks and
promotive factors on urban adolescent alcohol and other drug use: a
longitudinal study of resiliency. Am J Community Psychol. 2006;38:237–49.
doi:10.1007/s10464-006-9076-x.
Groeger-Roth F, Schubert H, editors. “Das kommt aus Amerika, das geht hier
nicht…“ - Erfahrungen mit CTC in Niedersachsen: Sicher leben in Stadt und
Land. Godesberg: Forum Verlag; 2012.
Sawyer SM, Afifi RA, Bearinger LH, Blakemore S, Dick B, Ezeh AC, et al.
Adolescence: a foundation for future health. Lancet. 2012;379:1630–40.
doi:10.1016/S0140-6736(12)60072-5.
Viner RM, Ozer EM, Denny S, Marmot M, Resnick M, Fatusi A, et al. Adolescence
and the social determinants of health. Lancet. 2012;379:1641–52. doi:10.1016/
S0140-6736(12)60149-4.
Bengel J, Meinders-Lücking F, Rottmann N. Schutzfaktoren bei Kindern und
Jugendlichen - Stand der Forschung zu psychosozialen Schutzfaktoren für
Gesundheit. Köln: Bundeszentrale für Gesundheitliche Aufklärung; 2009.
Masten AS. Global perspectives on resilience in children and youth. Child
Dev. 2014;85:6–20. doi:10.1111/cdev.12205.
Catalano RF, Kosterman R, Hawkins JD, Newcomb MD, Abbott RD. Modeling
the Etiology of Adolescent Substance Use: A Test of the Social
Development Model. J Drug Issues. 1996;26:429–55.
Hawkins JD, Weis JG. The Social Development Model: An Integrated
Approach to Delinquency Prevention. J Prim Prev. 1985;6(2):73–97.
Schubert H, Veil K, Spieckermann H, Abels S. Evaluation des
Modellprojektes “Communities That Care” in Niedersachsen. Köln:
Sozial - Raum - Management; 2013.
Page 13 of 14
37. Petermann U, Petermann F. Risiko- und Schutzfaktoren in der kindlichen
Entwicklung. Familienpolitik und soziale Sicherung: Festschrift für Heinz
Lampert;mit 5 Tabellen. Springer: Berlin,Heidelberg; 2005:39–55.
38. Scholes-Balog KE, Hemphill SA, Kremer P, Toumbourou JW. A longitudinal
study of the reciprocal effects of alcohol use and interpersonal violence
among Australian young people. J Youth Adolesc. 2013;42:1811–23.
doi:10.1007/s10964-013-9910-z.
39. Hawkins JD, Catalano RF, Arthur MW, Egan E, Brown EC, Abbott RD, et al.
Testing Communities That Care: The Rationale, Design and Behavioral
Baseline Equivalence of the Community Youth Development Study. Prev
Sci. 2008;9:178–90. doi:10.1007/s11121-008-0092-y.
40. Parra GR, DuBois DL, Sher KJ. Investigation of profiles of risk factors for
adolescent psychopathology: a person-centered approach. J Clin Child
Adolesc Psychol. 2006;35:386–402. doi:10.1207/s15374424jccp3503_4.
41. Kuttler H, Reis O, Pradel H, Gross C, Zimmermann US, Kraus L, et al.
Entwicklung eines Kurzfragebogens zum Erkennen und Prognostizieren
von Risiko- und Schutzfaktoren bei Alkoholintoxikationen im Jugendalter
(RiScA). Forum für Kinder- und Jugendpsychiatrie, Psychosomatik und
Psychotherapie in Deutschland e.V. (BKJPP), Forum-Verlag Aachen
2013:15–34.
42. Kuttler H. Teenager mit Alkoholintoxikation im Krankenhaus - Kooperation
von Medizin und Sozialpädagogik als Schlüssel zur Suchtprävention.
Psychosomatik und Konsiliarmedizin. 2008;2(1):50–2.
43. Wolstein J, Wurdak M, Stürmer M. Evaluation des Alkoholpräventionsprojektes
HaLT - Hart am Limit in Bayern. München: Bayerische Akademie für
Suchtfragen; 2011.
44. Glaser RR, Van Horn ML, Arthur MW, Hawkins JD, Catalano RF. Measurement
properties of the Communities That Care Youth Survey across demographic
groups. J Quant Criminol. 2005;21:73–102.
45. Schubert H, Veil K. Erster Zwischenbericht der SPIN Evaluation,
Literaturanalyse Communities That Care: Arbeitspapier 35. Cologne:
Forschungsschwerpunkt Sozial - Raum - Management (SRM),
Fachhochschule Köln; 10/2009.
46. Groeger-Roth F. Lokale Risiko- und Schutzfaktoren für Jugendkriminalität:
Die Rolle von sozialräumlichen Unterschieden für die kommunale
Prävention, Sozialräumliches Arbeiten in der Straffälligenhilfe : dahin gehen,
wo es weh tut. Freiburg im Breisgau: Lambertus; 2012. p. 73–89.
47. Bernstein DP, Stein JA, Newcomb MD, Walker E, Pogge D, Ahluvalia T, et al.
Development and validation of a brief screening version of the Childhood
Trauma Questionnaire. Child Abuse Negl. 2003;27:169–90.
48. Mugisha J, Muyinda H, Wandiembe P, Kinyanda E. Prevalence and factors
associated with Posttraumatic Stress Disorder seven years after the conflict
in three districts in northern Uganda (The Wayo-Nero Study). BMC
Psychiatry. 2015;15:170. doi:10.1186/s12888-015-0551-5.
49. Grassi-Oliveira R, Cogo-Moreira H, Salum GA, Brietzke E, Viola TW, Manfro
GG, et al. Childhood Trauma Questionnaire (CTQ) in Brazilian samples of
different age groups: findings from confirmatory factor analysis. PLoS One.
2014;9:e87118. doi:10.1371/journal.pone.0087118.
50. Saddichha S, Werker GR, Schuetz C, Krausz MR. Stimulants and Cannabis Use
Among a Marginalized Population in British Columbia, Canada: Role of
Trauma and Incarceration. Int J Offender Ther Comp Criminol 2014.
doi:10.1177/0306624X14541661.
51. Larsson S, Aas M, Klungsøyr O, Agartz I, Mork E, Steen NE, et al. Patterns of
childhood adverse events are associated with clinical characteristics of
bipolar disorder. BMC Psychiatry. 2013;13:97. doi:10.1186/1471-244X-13-97.
52. Wingenfeld K, Spitzer C, Mensebach C, Grabe H, Hill A, Gast U, et al. Die
deutsche Version des Childhood Trauma Questionnaire (CTQ): Erste Befunde
zu den psychometrischen Kennwerten. Psychother Psychosom Med
Psychol. 2010;60:442–50. doi:10.1055/s-0030-1247564.
53. Klinitzke G, Romppel M, Häuser W, Brähler E, Glaesmer H. Die deutsche
Version des Childhood Trauma Questionnaire (CTQ) - psychometrische
Eigenschaften in einer bevölkerungsrepräsentativen Stichprobe. Psychother
Psychosom Med Psychol. 2012;62:47–51. doi:10.1055/s-0031-1295495.
54. Häuser W, Schmutzer G, Brähler E, Glaesmer H. Misshandlungen in Kindheit
und Jugend: Ergebnisse einer Umfrage in einer repräsentativen Stichprobe
der deutschen Bevölkerung. Deutsches Ärzteblatt. 2011;108:287–94.
55. Iffland B, Brähler E, Neuner F, Häuser W, Glaesmer H. Frequency of child
maltreatment in a representative sample of the German population. BMC
Public Health. 2013;13:980. doi:10.1186/1471-2458-13-980.
56. Bühner M. Einführung in die Test- und Fragebogenkonstruktion. 2nd ed.
München, Don Mills: Pearson Studium; 2006.
Kuttler et al. BMC Pediatrics (2015) 15:191
Page 14 of 14
57. Streiner DL, Norman GR. Health measurement scales: A practical guide to
their development and use. 4th ed. Oxford, New York: Oxford University
Press; 2008.
58. Costello AB, Osborne JW. Best Practices in Exploratory Factor Analysis: Four
Recommendations For Getting the most from Your Analysis. 2005.
Accessed 15 Sep 2015.
59. Jöreskog KG, Sörbom D. LISREL 8 user’s reference guide. 2nd ed. Chicago, IL:
Scientific Software International; 1996.
60. Hair JF. Multivariate data analysis. 6th ed. Upper Saddle River, N.J: Pearson
Prentice Hall; 2006.
61. Kline RB. Principles and practice of structural equation modeling. 2nd ed.
New York NY u.a: Guilford Press; 2005.
62. Schafer JL, Graham JW. Missing data: our view of the state of the art.
Psychol Methods. 2002;7:147–77.
63. Backhaus K, Erichson B, Weiber R. Fortgeschrittene multivariate Analysemethoden:
Eine anwendungsorientierte Einführung. Berlin: Springer; 2011.
64. Forero CG, Maydeu-Olivares A, Gallardo-Pujol D. Factor Analysis with Ordinal
Indicators: A Monte Carlo Study Comparing DWLS and ULS Estimation.
Structural Equitation Modeling 2009:625–41
65. Jöreskog KG. On the estimation of polychoric correlations and their asymptotic
covariance matrix. Psychometrika. 1994;59:381–9. doi:10.1007/BF02296131.
66. Rosseel Y. lavaan: an R Package for structural equation modeling. J Stat
Softw. 2012;28:1–36.
67. Scholes-Balog KE, Hemphill SA, Dowling NA, Toumbourou JW. A
prospective study of adolescent risk and protective factors for problem
gambling among young adults. J Adolesc. 2014;37:215–24. doi:10.1016/
j.adolescence.2013.12.006.
68. Boden JM, Fergusson DM, Horwood LJ. Risk factors for conduct disorder
and oppositional/defiant disorder: evidence from a New Zealand birth
cohort. J Am Acad Child Adolesc Psychiatry. 2010;49:1125–33. doi:10.1016/
j.jaac.2010.08.005.
Submit your next manuscript to BioMed Central
and take full advantage of:
• Convenient online submission
• Thorough peer review
• No space constraints or color figure charges
• Immediate publication on acceptance
• Inclusion in PubMed, CAS, Scopus and Google Scholar
• Research which is freely available for redistribution
Submit your manuscript at
www.biomedcentral.com/submit