mproved insulin sensitivity and body composition, irrespective of macronutrient intake, after a 12 month intervention in adolescents with pre-diabetes: A randomised control trial
Bạn đang xem bản rút gọn của tài liệu. Xem và tải ngay bản đầy đủ của tài liệu tại đây (596.73 KB, 10 trang )
Garnett et al. BMC Pediatrics 2014, 14:289
/>
RESEARCH ARTICLE
Open Access
Improved insulin sensitivity and body composition,
irrespective of macronutrient intake, after a
12 month intervention in adolescents with
pre-diabetes; RESIST a randomised control trial
Sarah P Garnett1,2,3*, Megan Gow1,3, Mandy Ho3, Louise A Baur2,3, Manny Noakes4, Helen J Woodhead5,6,
Carolyn R Broderick7,8, Kerryn Chisholm9, Julie Briody10, Sukanya De2, Katherine Steinbeck11, Shubha Srinivasan1,
Geoffrey R Ambler1,3 and Chris T Cowell1,2,3
Abstract
Background: A higher protein to carbohydrate ratio in the diet may potentiate weight loss, improve body composition
and cardiometabolic risk, including glucose homeostasis in adults. The aim of this randomised control trial was to
determine the efficacy of two structured lifestyle interventions, differing in dietary macronutrient content, on insulin
sensitivity and body composition in adolescents. We hypothesised that a moderate-carbohydrate (40-45% of energy),
increased-protein (25-30%) diet would be more effective than a high-carbohydrate diet (55-60%), moderate-protein
(15%) diet in improving outcomes in obese, insulin resistant adolescents.
Methods: Obese 10–17 year olds with either pre-diabetes and/or clinical features of insulin resistance were recruited
at two hospitals in Sydney, Australia. At baseline adolescents were prescribed metformin and randomised to one of
two energy restricted diets. The intervention included regular contact with the dietician and a supervised physical
activity program. Outcomes included insulin sensitivity index measured by an oral glucose tolerance test and body
composition measured by dual-energy x-ray absorptiometry at 12 months.
Results: Of the 111 adolescents recruited, 85 (77%) completed the intervention. BMI expressed as a percentage of the
95th percentile decreased by 6.8% [95% CI: −8.8 to −4.9], ISI increased by 0.2 [95% CI: 0.06 to 0.39] and percent body
fat decreased by 2.4% [95% CI: −3.4 to −1.3]. There were no significant differences in outcomes between diet groups at
any time.
Conclusion: When treated with metformin and an exercise program, a structured, reduced energy diet, which is either
high-carbohydrate or moderate-carbohydrate with increased-protein, can achieve clinically significant improvements in
obese adolescents at risk of type 2 diabetes.
Trial registration: Australian New Zealand Clinical Trail Registry ACTRN12608000416392. Registered 25 August 2008.
Keywords: Insulin sensitivity, Body composition, Macronutrient intake, Adolescents, Pre-diabetes
* Correspondence:
1
Institute of Endocrinology and Diabetes, The Children’s Hospital at
Westmead, Locked Bag 4001, Westmead, Sydney, NSW 2145, Australia
2
Kids Research Institute, The Children’s Hospital at Westmead, Locked Bag
4001, Westmead, Sydney, NSW 2145, Australia
Full list of author information is available at the end of the article
© 2014 Garnett et al.; licensee BioMed Central Ltd. This is an Open Access article distributed under the terms of the Creative
Commons Attribution License ( which permits unrestricted use, distribution, and
reproduction in any medium, provided the original work is properly credited. The Creative Commons Public Domain
Dedication waiver ( applies to the data made available in this article,
unless otherwise stated.
Garnett et al. BMC Pediatrics 2014, 14:289
/>
Background
There is substantial interest in the effect of the macronutrient composition of the diet on potentiating weight loss
and improving cardiometabolic risk [1,2]. Results from
several studies indicate that a weight loss diet with increased protein and reduced carbohydrate may increase
body fat mass loss, attenuate loss of fat free mass (FFM)
and improve lipid profile and glucose homeostasis, compared with a conventional high carbohydrate, low fat diet
[3]. It is speculated that protein is superior to carbohydrate in promoting satiety as well as dietary induced
thermogenesis, with no unfavourable health implications
[4,5]. In addition, high carbohydrate diets may lead to
higher post prandial glucose and insulin spikes, placing increased demands on beta cell function and exacerbating
insulin sensitivity [6]. However, improved outcomes with
an increased protein diet are not consistently reported. A
recent systematic review [7] identified three randomised
control trials (RCT), conducted in highly controlled environments, two were in residential camps [8,9] and the
other in a boarding school [10], comparing increased
protein to isoenergetic standard protein diets in obese
children; none reported differences in weight loss, cardiometabolic risk, or glycaemic status between diets.
However, there is a paucity of trials in free-living overweight or obese adolescents.
We undertook an RCT, known as Researching Effective
Strategies to Improve Insulin Sensitivity in Children and
Teenagers (RESIST), with the aim of determining the
effectiveness of a moderate-carbohydrate, increased protein diet compared to a high carbohydrate diet on insulin
sensitivity in adolescents with pre-diabetes and/or clinical
features of insulin resistance treated with metformin. We
hypothesised that the moderate-carbohydrate, increasedprotein diet would be more effective than the highcarbohydrate diet in improving insulin sensitivity, body
composition and metabolic profile. The six month results
have been previous published and in contrast to our hypothesis, demonstrated no significant differences in weight
loss or metabolic profile between dietary groups [11]. The
aims of this manuscript are to describe the changes in
whole body insulin sensitivity index (ISI), derived from an
oral glucose tolerance test (OGTT), and in body composition, measured by dual-energy x-ray absorptiometry
(DXA), after 12 months of intervention.
Methods
This study was a 12 month parallel RCT which took place
at The Children’s Hospital at Westmead (CHW) and
Campbelltown Hospital, Sydney, Australia. This study was
conducted according to the guidelines laid down in the
Declaration of Helsinki and was approved by CHW
Human Research Ethics Committee (07/CHW/12) and
Sydney South West Area Health, Western Zone (08/
Page 2 of 10
LPOOL/195). Written informed consent from parents and
assent from the adolescents was sought prior to enrolment. The protocol for the study has been published [12].
All participants were treated with metformin and received
the same 12 month lifestyle intervention. The only difference between treatment arms was the macronutrient
composition of the diet.
The intervention consisted of three phases:
I (0–3 months): Intensive dietary intervention
II (4–6 months): Intensive exercise program plus
dietary support
III (7–12 months): Participants were encouraged to
continue with their diet/exercise regimens and
metformin.
Study population
Participants were recruited through physician referral
[12]. After a patient was assessed and identified as
meeting the trial criteria, the patient and parent/carer
made contact with study dieticians who explained
the study, sent information sheets/consent forms and
booked appointments. Treatment allocation (allocation
ratio 1:1) occurred centrally by minimisation [13], stratified by sex, pubertal stage and BMI status [14], with
the aid of computer software [15] at CHW, by study
dieticians.
Inclusion criteria
Ten to 17 year old adolescents who were overweight or
obese, as defined by the International Obesity TaskForce
[14] with either pre type 2 diabetes [16] and/or clinical
features of insulin resistance. As previously described clinical features of insulin resistance were defined as a fasting
insulin (pmol/L)/glucose (mmol/L) ratio >20 with one or
more of the following: acanthosis nigricans, polycystic
ovarian syndrome, hypertension, fasting HDL cholesterol <1.03 mmol/L or fasting triglycerides ≥1.7 mmol/L [12].
Exclusion criteria
Diabetes, contraindications to metformin, secondary
causes of obesity, psychiatric disturbance, significant
mental illness, inability to take part in physical activity,
weight loss medications or medications known to cause
weight gain, and weight >120 kg.
Our target sample size was 108 (54 in each arm). This
was based on the primary outcome, change in whole
body ISI of 0.8 (SD 1.3), with an 80% chance of detecting
a significant increase in ISI at the two sided 5% level and
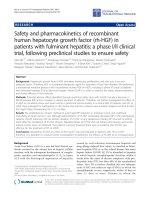
included a 20% dropout rate [12]. A total of 111 entered
the study between January 2009 and November 2011,
Figure 1.
Garnett et al. BMC Pediatrics 2014, 14:289
/>
Page 3 of 10
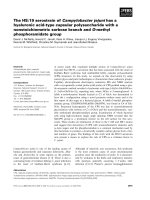
Referred (n= 188)
Declined to participate (n=43)
Assessed for eligibility (n=145)
Excluded (n=31)
Did not meet inclusion
criteria (n=31)
Declined to participate (n=3)
Allocated (n=111)
Allocated to a moderate carbohydrate,
increased protein diet (n=56)
Phase I: Intensive dietary intervention
Followed up (n=55)
Withdrawals (n=1)
Phase II: Intensive exercise intervention
Followed up (n=49)
Unable to attend 6 month follow-up (n=2)
Withdrawals (n=4)
Phase III: Maintenance
Followed up (n=39)
Withdrawals (n=10)
Allocated to a high carbohydrate,
low fat diet (n=55)
Phase I: Intensive dietary intervention
Followed up (n=51)
Withdrawals (n=4)
Unrelated medical issues (n=1)
Did not want to participate (n=3)
Phase II: Intensive exercise intervention
Followed up (n=49)
Withdrawals (n=2)
Did not want not to participate (n=2)
Phase III: Maintenance
Followed up (n=46)
Withdrawals (n=5)
Did not want not to participate (n=5)
Not contactable
Figure 1 RESIST participant flow.
Interventions
Metformin
Consistent with clinical practice at CHW all participants
were treated with metformin (Diabex) which was provided at no cost for the duration of the study. The initial
dose was 250 mg twice daily. After 2 weeks this was
increased to a final dose of 500 mg twice daily.
Diet
Diet 1 was a high-carbohydrate diet, with 55-60% of
total energy as carbohydrate (moderate glycaemic load),
30% fat (≤10% saturated fat) and 15% protein. Diet 2 was
a moderate-carbohydrate, increased-protein diet, with
40-45% of total energy as carbohydrate (moderate glycaemic load), 30% fat (≤10% saturated fat), 25-30% protein. Diets were prescriptive at two different energy
levels: 6,000 to 7,000 kJ (10 to 14 years) or 7,000 to
8,000 kJ (15 to 17 years). The energy levels were a range
for each age group, to enable prescribed energy to
individualize, depending upon the energy requirements.
Details of the delivery of the intervention have been previously described [12].
Garnett et al. BMC Pediatrics 2014, 14:289
/>
Exercise
Phase I Standardised physical activity advice,
consistent with recommendations for
adolescents [17] was delivered by study
dieticians.
Phase II Participants received, free of charge, a
supervised exercise program, 45–60 minutes,
twice/week for 12 weeks in a commercial
gym, including Fitness First, or a local park in
the geographic area in which they lived. The
program was designed to be of moderate-tovigorous intensity and consisted of circuit
training with an age-appropriate mix of
resistance and aerobic stations, conducted by
qualified fitness trainers, blinded to treatment
arm. Participants were also encouraged to
exercise at least once a week at home.
Medical care
Clinical progress was reviewed by the participant’s primary or study physician, who was blinded to the trial
arm of the adolescent and who assessed puberty using
Tanner Staging [18], blood pressure, acanthosis nigricans
[19] and menstrual history.
Page 4 of 10
overnight fast [12]. Blood drawn was analysed using standard techniques for lipids, alanine aminotransferase (ALT),
gamma-glutamyl transferase (GTT)), and renal function
tests (urea, electrolytes, and creatinine). Abnormal triglycerides and HDL-cholesterol were defined as ≥1.7 mmol/L
and <1.03 mmol/L, respectively. Elevated hepatic transaminases were defined as ALT and/or GGT ≥1.5 upper
limit of 30 U/L [26].
Body composition
Body composition was measured by DXA (Prodigy,
Lunar-GE, Madison,WI USA) equipped with propriety
software version13.6. The manufacturer recommended
scan mode, as determined by height and weight, and
when possible, standard positioning techniques were
used. When the adolescent’s width exceeded maximum
scan width, the adolescent was “mummy wrapped”, with
arms placed in a lateral position. Scans were analysed
using manufacturer recommended techniques. Fat mass
index (FMI) and FFM index (FFMI) were calculated as
fat mass (g)/height (cm)2 and FFM (g)/height (cm)2, respectively [27].
Dietary intake
Primary outcome
Dietary intake was obtained by 24-hour dietary recalls at
6 weeks and 3, 6 and 12 months. This procedure was
conducted by dieticians using a standardised three-pass
methodology and food model booklet as previously described [12]. Energy and macronutrient intake were estimated using Foodworks 2009 (version 6.0.2539; Xyris
Inc., Brisbane, QLD, Australia).
Insulin sensitivity measured at CHW by whole body ISI
derived from an OGTT using the following formula:
Metformin compliance
Outcome measures
All measures were undertaken by clinicians blinded to
treatment allocation at baseline, three and 12 months.
10000=√ððFasting insulin  fasting glucoseÞ
Âðmean 2hr glucose  mean 2hr insulinÞÞ
[20].
Secondary outcomes
Change in body composition, anthropometry, acanthosis nigricans, triglycerides, HDL-cholesterol and blood
pressure.
Adherence was assessed by pill counts by the clinical
trials pharmacist at CHW. After three months of intervention, 69 (62%) participants returned pills and after
6 months 50 (45%) participants returned pills. There was
no difference between diet groups in adherence at either
time period. At three months it was estimated the participants took (median [interquartile range]) 88% [61 to
98] of prescribed metformin and after 6 months participants took 65% [38 to 94]. There was no pill count at
12 months. As previously reported 16 (14%) participants
reported side effects to metformin [11].
Measurements
Weight and height were measured [21] and BMI z-scores
were calculated [22]. BMI was expressed as a percentage
of the 95th centile (BMI%95 centile) [23]. Change in BMI
z-score is not presented, as >96% of the adolescents had
a BMI >97th centile which is beyond the scope of
the CDC2000 reference data [24]. Blood pressure was
measured using an automated blood pressure monitor
(Dinamap 1846SX). Elevated blood pressure was defined
as ≥90th centile [25]. An OGTT was performed after an
Statistical analysis
Data were analysed using PASW statistical software for
Windows, version 18 (SPSS Inc). Differences between
continuous data were examined using independent sample
t-tests for normally distributed data or Mann–Whitney
tests for non-parametric data. Chi-squared tests were used
to examine differences in categorical data; odds ratios
were used to examine the magnitude of the association.
Correlations between variables were assessed by Pearson’s
Garnett et al. BMC Pediatrics 2014, 14:289
/>
Page 5 of 10
correlation coefficients or Spearman’s rho for normally
distributed and non-parametric data, respectively. Consistent with an intent-to-treat approach, all available data for
participants as originally randomly assigned, were retained.
Linear mixed models with an unstructured covariance
were used to test for the effects of diet and time (baseline,
three, six and 12 months). Non-parametric data were log
transformed. Age at baseline and age difference between
visits were tested in the modelling but were not statistically
and/or clinically significant and hence results have been
expressed as unadjusted models. The least significant difference method was used for post-hoc comparisons. The
assumptions of modelling were tested and met. Mean
changes and differences derived from linear mixed models
are presented with 95% CIs. Data that were log transformed are presented as geometric means with 95% CIs.
Results
Of the 111 adolescents (66 girls) recruited, 85 (77%)
completed the 12 month intervention (Figure 1). There
was no statistical difference in baseline anthropometry, body composition or clinical parameters between
groups (Table 1). The exception was that more participants had pre-diabetes in the moderate-carbohydrate,
increased-protein group (n = 11; 19.6%) compared to
the high-carbohydrate group (n = 3; 5.5%), P = 0.024.
There was also no statistical difference in baseline
anthropometry, body composition or clinical parameters between the completers and the drop-outs. Participants who dropped out were more likely to come from
a single parent family (odds ratio 4.3 [95% CI: 1.6 to
12.0], P = 0.05). Attrition rate was not statistically significantly different between diet groups (Figure 1). Over
the 12 month intervention there was a statistically significant (P < 0.001) decrease in height z-score from 1.27
at baseline to 0.76 at 12 months and the number of
children who were pre-pubertal (Tanner stage 1 and 2)
decreased from 30.9% to 15.1%. The change in height
and pubertal stage was not significantly different between diet groups.
Table 1 Baseline characteristics
Intervention group
Moderate-carbohydrate, increased-protein diet (n = 56) High-carbohydrate, low-fat diet (n = 55) P*
Age and sex
Age years median [range]
13.0
[10.1 to 16.5]
13.2
[10.2 to 17.4]
0.959
Girls n (%)
34
(60.7)
32
(58.2)
0.786†
Tanner stage 1
7
(12.7)
7
(12.7)
2
9
(16.4)
11
(20.0)
3
15
(27.3)
9
(16.4)
4
15
(27.3)
16
(29.1)
5
9
(16.4)
12
(21.8)
Pubertal status‡ n (%)
Anthropometry
Mean (SD) unless otherwise indicated
Weight kg
90.7
(19.0)
90.7
(21.2)
0.992
Height z-score
1.27
(1.29)
1.30
(1.11)
0.894
Weight z-score
2.73
(0.53)
2.68
(0.57)
0.646
BMI z-score
2.39
(0.25)
2.33
(0.32)
0.253
BMI %95 centile
133
(19)
132
(23)
0.770
Obese§ n (%)
55
(98.2)
52
(94.5)
0.300†
43.5
(10.0)
42.6
(11.7)
0.683
Body composition (DXA)|
Total body fat (kg)
Total fat %
49.5
(5.5)
48.3
(5.7)
0.249
Total fat free mass (kg)
44.4
(11.3)
45.1
(11.4)
0.740
Fat free mass index
1.66
(0.24)
1.69
(0.29)
0.638
*P independent sample t-tests unless otherwise indicated.
†
Chi-squared test.
‡
One girl in the moderate carbohydrate, increase protein diet group had missing data.
§
Obesity defined by International Obesity Taskforce [14].
|
DXA: Dual-energy x-ray absorptiometry.
Garnett et al. BMC Pediatrics 2014, 14:289
/>
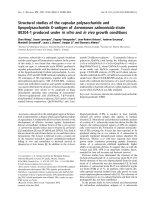
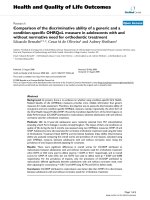
Effects of intervention on insulin sensitivity index
ISI increased between baseline and three months, which
remained significantly different from baseline at 12 months;
estimated mean difference 0.23 [0.06 to 0.39], P = 0.009;
Figure 2a. The magnitude of change was similar for girls
and boys, although boys commenced the trial with a
lower median ISI (1.2 [range 0.3 to 3.0]) compared to
girls (1.4 [0.3 to 3.4]), P = 0.04. Adjusting for puberty
and/or age did not alter the outcome. There was no significant difference in ISI between diet groups at any
time point.
Effects of intervention on total body fat
Total body fat% decreased over the 12 month intervention (P < 0.001, Figure 2b). There was a significant sex
and pubertal interaction in the modelling. After adjusting for pubertal stage, the magnitude of change was
similar for boys and girls, however, boys commenced the
Page 6 of 10
trial with a lower total body fat percentage (46.3% ± 5.3)
compared to girls (50.7% ±5 .3), P < 0.001. There was no
significant difference in total body fat% between diet
groups at any time point. Similarly the FMI significantly
(P = 0.009) decreased from 16.2 ± 0.4 (estimated marginal mean ± SE) at baseline to 15.6 ± 0.5 at 12 months
and there was no significant difference (P = 0.421) in
FMI between diet groups at any time point.
Effects of intervention on fat free mass index
After three months of intervention there was a significant decrease in FFMI, followed by a significant increase
between three and 12 months (Figure 2c). Analysis stratified by sex indicated that girls, but not boys, had a significant decrease; estimated mean difference (0.03 [95%
CI: 0.01 to 0.05], P = 0.005) in the FFMI during the first
three months, which increased (0.03 [0.001 to 0.06],
P = 0.014) to baseline levels at 12 month. Boys’ FFMI did
Figure 2 Glycemic status and body composition measures by dietary group over the 12 month intervention. Estimated marginal means
(SE) are presented from linear mixed models for the moderate-carbohydrate, increased-protein diet group (▼) and the high-carbohydrate diet
group (△). a: Insulin sensitivity index. 1Significance between baseline and 3 months and 12 months as indicated. 2Significance between 3 and
12 months. b: Total body fat percent measured by dual energy x-ray absorptiometry (Fat % DXA). 1Significance between baseline and 3 months
and 12 months as indicated. 2Significance between 3 and 12 months. c: Fat free mass index. 1Significance between baseline and 3 months and
12 months as indicated. 2Significance between 3 and 12 months. d: BMI%95th centile. 1Significance between baseline and 3 months, 6 months
and 12 months as indicated. 3Significance between 3 and 6 months. 4Significance between 6 and 12 months.
Garnett et al. BMC Pediatrics 2014, 14:289
/>
Page 7 of 10
not change over the first three months, but FFMI was
higher at 12 months compared to both baseline (0.09
[0.06 to 0.12], P < 0.001]) and three months (0.11 [0.06
to 0.15], P < 0.001). Adjusting for puberty and/or age did
not alter the outcome. There was no significant difference between diet groups at any time point.
Effects of intervention on BMI%95th centile
BMI%95th centile decreased between baseline and
12 months (P < 0.001, Figure 2d). The decrease in BMI%
95th centile occurred between baseline and six months
and there was no significant change over the following
six months. The magnitude of change (estimated mean
difference 6.8% [95% CI: 4.9 to 8.8]) over the 12 months
was similar for boys and girls, although boys commenced the trial with a higher mean (±SD) BMI%95th
centile compared to girls; 136.8 ± 21.1 and 129.3 ± 20.6,
P = 0.020, respectively. There was no significant difference between diet groups at any time point.
Effects of intervention on lipids and blood pressure
Between baseline and 12 months there was a significant
increase in HDL-cholesterol and a significant decrease
in diastolic blood pressure (Table 2). There were no significant differences between baseline and 12 month measures of LDL-cholesterol , triglycerides or systolic blood
pressure, nor was there any significant difference in
lipids or blood pressure between diet groups at any time
point. Sex was not a significant predictor of change in
HDL-cholesterol, LDL-cholesterol or triglycerides. However, a sex difference in blood pressure was observed.
The magnitude of change in both SBP z-score and DBP
z-score over the 12 months was similar for boys and
girls, although boys commenced the trial with a higher
blood pressure. At baseline the SBP z-score (estimated
marginal mean (SE)) for boys and girls was 1.10 (0.14)
and 0.49 (0.16), respectively and DBP was 1.13 (0.09)
and 0.75 (0.11), respectively.
Dietary adherence
The geometric mean [95% CI] for the reported energy
intake over the 12 month intervention was 5.97 [5.94 to
6.37] MJ per day for adolescents randomised to the
moderate-carbohydrate, increased-protein diet and 6.41
[6.00 to 6.85] MJ per day for adolescents randomised to
the high-carbohydrate diet. The difference was not significant (P = 0.126), nor did the reported energy intake differ
over time (P = 0.935). Protein % energy was significantly
(P = 0.027) higher in the moderate-carbohydrate increasedprotein group compared to the high-carbohydrate group,
20.3% [19.3 to 21.2] and 18.8% [17.8 to 19.2], respectively,
and this did not differ over time (P = 0.081). There was no
statistical difference in reported fat % energy (both groups
30.4% [28.5 to 32.2], P = 0.710) or carbohydrate % energy
(46.5% [44.7 to 48.1] for the increased-protein group and
48.2% [46.4 to 49.9] for the high-carbohydrate group,
P = 0.155). Fat % energy intake did not change significantly
over time (P = 0.191). In contrast, reported carbohydrate
% energy was significantly higher in both groups at
six months compared to six weeks, three months and
12 months, P = 0.003.
Clinical outcomes in adolescents who completed the
intervention
There was no statistical difference in clinical outcomes
between diet groups at any time point; data has been
pooled for this analysis, Table 3.
BMI %95th centile
Of the 85(82 obese at baseline) who completed the study,
67 (78.8%) decreased BMI %95th centile and 18 increased
BMI %95th centile. Two participants completed the
12 month intervention with a weight within the normal
range, and 12 were classified as overweight. Baseline sex,
age, puberty, weight, or fasting insulin were not significantly associated with change in BMI %95th centile. However, participants who entered the trial with a higher ISI,
lost less weight (BMI %95th centile), rho −0.26, P = 0.018.
Pre-diabetes
Eighty-three participants had glycaemic status measured
at baseline and 12 months. Eight (9.6%) of the 83 participants had pre-diabetes at baseline (three impaired fasting
glucose (IFG), four impaired glucose tolerance (IGT), one
with both IFG and IGT), but only 2 had pre-diabetes at
12 months. The six participants who improved glycaemic
Table 2 Lipids and blood pressure at baseline and 12 months
After 12 months intervention
P*
Triglycerides mmol/L†
Baseline
1.1
[1.0-1.2]
1.0
[0.9-1.1]
0.209
HDL-C mmol/L
1.05
(0.02)
1.12
(0.03)
<0.001
LDL-C mol/L
2.77
(0.08)
2.75
(0.08)
0.456
SBP z-score
0.79
(0.12)
0.65
(0.12)
0.270
DBP z-score
0.94
(0.08)
0.74
(0.10)
0.047
*Pairwise comparison with baseline.
†
Geometric mean [95% CI].
Estimated marginal means (SE) are presented from linear mixed models, unless otherwise indicated.
Garnett et al. BMC Pediatrics 2014, 14:289
/>
Page 8 of 10
Table 3 Clinical presentation at baseline, 3, 6 and 12 months
Baseline
3 months
6 months
12 months
n = 111
n = 106
n = 100
n = 85
Acanthosis nigricans present
94
(84.7)
88
(83.8)*
79
Pre-diabetes
14
(12.6)
19
(17.9)
Dyslipidaemia
61
(55.0)*
57
(54.3)*
51
49
(44.1)
41
(38.7)
30
(85.9)†
61
(76.3)§
10
(12.1)†,**
(53.7)|
32
(28.8)†
(30.6)†
37
(43.5)
(HDL-C <1.03 mmol/L and/or triglycerides ≥1.7 mmol/L)
SBP and/or DBP ≥90 percentile
†
‡
†
Elevated liver enzymes (ALT and/or GGT ≥1.5 upper limit of 30 U/L)
22
(20.0)
21
(20.4)
17
(17.3)
14
(12.6)‡
Microalbuminuria
9
(8.5)§
9
(8.9)§
9
(9.5)§
9§
(8.1)§
(Urine/albumin/creatinine, Girls: 3.5 to 25 mg/mmol, Boys: 2.5 to 25 mg/mmol)
*1 missing value, †2 missing values, ‡3 missing values, §5 missing values, | 8 missing values **including one adolescent diagnosed with type 2 diabetes.
Values are n (%).
status lost significantly more weight. The mean BMI %
95th centile decreased by −21.3 [95% CI:-34.3 to −8.2]),
total fat % decreased by −8.7 [−22.3 to 1.7] and ISI increased by 1.0 [0.02 to 3.6]. An additional 8 participants
developed pre-diabetes over the 12 months and one, an
11 year old boy, gained 16 kg and developed type 2
diabetes.
Acanthosis nigricans
Eighty participants were assessed for acanthosis nigricans
at baseline and 12 months, of which 66 (82.5%) entered
the trial with acanthosis nigricans. After the 12 month
intervention acanthosis nigricans resolved in seven participants and developed in two. Those who had resolution
lost more total body fat % compared to those who did not,
mean difference in total body fat % 4.7 [95% CI:1.6 to 7.8],
but there was no significant difference in ISI.
Dyslipidemia
Eighty-two participants had blood lipids measured at
baseline and 12 months, of which 46 (56.1%) entered the
trial with dyslipidaemia. After 12 months of intervention,
dyslipidaemia resolved in 19 (23.2%) participants and developed in 5 (6.1%). There were no statistical differences
in change in BMI %95th centile, total body fat% or ISI
between those who did or did not have resolution.
Blood pressure
All participants who completed the interventions had
blood pressure measured at baseline and 12 months, of
which 49 (44.1%) entered the trial with elevated blood
pressure. After 12 months of intervention, blood pressure decreased to normal levels in 12 (14.1%) participants and increased in 12 (14.1%). There was no
statistical difference in the number of participants with
elevated blood pressure at any time point (P = 0.183).
There were no statistical differences in change in BMI %
95th centile, total body fat% or ISI between those who
did or did not have improved blood pressure.
Discussion
Overall, results from this study indicate that a 12 month
lifestyle intervention combined with metformin therapy
in overweight and obese adolescents at risk of developing type 2 diabetes was effective in achieving moderate improvement in body composition and BMI.
Pre-diabetes and clinical features including acanthosis
nigricans, also improved, particularly in adolescents who
lost weight (BMI % 95th centile) and/or total body fat %.
ISI also increased significantly; however, the magnitude
of difference between baseline and 12 months was small
and may not be clinically significant. In contrast to our
hypothesis, that adolescents randomised to a moderatecarbohydrate, increased-protein diet would have better
outcomes compared to the high-carbohydrate diet, the
diets had no differential effect on any outcome measure,
at any time point. These results are consistent with three
other RCTs in overweight and obese adolescents that investigated the effect of varying protein content compared with control diets on weight loss in residential
settings [7] but in contrast to those from a recent systematic review of RCTs in overweight and obese adults
[3]. To our knowledge, there is only one study, the Diogenes study, which has shown a beneficial effect of increasing the protein in the diet, particularly when
coupled with a low glycaemic diet, on both body fat and
cardiometabolic markers in children [28,29]. There are a
number of reasons why the results may differ from our
study and others, including study design; in the Diogenes
study families were randomised, not children and the
focus was children at risk of obesity and weight maintenance, not obese children and weight loss.
The lack of effect between diets in our study may be
due to poor compliance. Many participants had difficulty
in achieving the macronutrient goals of the prescribed
diet and the mean difference in protein intake was marginal (<2% of energy). However, the results remained unchanged in post-hoc analysis of those who were able to
meet the targets. Our study was undertaken in a real-life
Garnett et al. BMC Pediatrics 2014, 14:289
/>
setting and it is not evident if lack of compliance is a
consequence of inadequate protein targets or a consequence of readily available high carbohydrate snack
foods.
The specific effect of metformin therapy on outcome
measures in our study is not clear. The beneficial effects
of metformin therapy combined with lifestyle interventions in adolescents with clinical features of insulin resistance are well documented [30,31]. However, results
from the largest randomised, placebo controlled trial of
metformin alone, on weight and metabolic markers in
150 obese adolescents with hyperinsulinemia and/or
pre-diabetes, indicated no significant change in ISI after
three and six months of metformin therapy [32]. There
are no RCTs which have compared lifestyle interventions
to metformin therapy alone in adolescents. We speculate
that it is the combined effect of metformin therapy and
lifestyle intervention which resulted in weight loss and
improved glycaemic status in our study. It should also
be noted that the improvement in ISI occurred during
puberty, a time when insulin sensitivity is expected to
decrease irrespective of body composition [33].
The magnitude of total fat % loss after the 12 month
intervention was small (−2.4%), although similar to other
studies examining the impact of dietary and exercise interventions in obese adolescents and children [30]. However, we may have expected many of the participants to
be increasing body fat as part of normal growth and development during puberty [24]; the number of children
who were pre-pubertal (Tanner stage 1 and 2) decreased
from 30.9% to 15.1% over the 12 months. Loss of total
fat% was not associated with resolution of dyslipidemia
or lowering of blood pressure; previous studies have reported mixed results [34].
Limitations of the study including the use of ISI to
measure glycaemic status, proxy measures of dietary compliance (24 hour recalls) and non-blinding of participants
and dieticians. Lack of baseline dietary intake meant that
we were unable to determine whether intake was altered
by either dietary intervention. However, both groups lost
similar amounts of weight, indicating that the energy deficit is likely to be similar in both diet groups. Another
limitation was that metformin adherence was not measured at 12 months, hampering our interpretation of the
effect of lifestyle compared to metformin therapy.
A strength of the study was the retention rate. After
the six month intensive lifestyle intervention, including
regular dietary counselling, food hampers to support the
prescribed diet, a three month supervised physical activity program and email support, we retained 88% of those
recruited. After 12 months, the last six months being a
maintenance phase with regular, but limited contact with
health professionals, we retained 77%. The challenges
of recruitment and retention of adolescents have been
Page 9 of 10
previously described [35]. Most (77%) adolescents that
dropped out reported lack of interest, highlighting that
one program does not suit everyone and alternative approaches to managing adolescents with insulin resistance/
pre-diabetes are required. Food preferences are personal;
dietary modification may need to be individualised.
Conclusion
Reduced energy intake, combined with physical activity
and assisted by metformin, is likely to be the mainstay
for improving insulin sensitivity in this large RCT, completed in a challenging developmental stage. We were
unable to demonstrate that the two study diets had
differential effects on ISI, body composition or BMI, at
any time point. This finding and the improvement in
acanthosis nigricans, as a clinical indicator of insulin resistance suggest that a prescribed reduced energy diet is
the important intervention message rather than diet
composition for overweight and obese adolescents at
risk of type 2 diabetes.
Abbreviations
FFM: Fat free mass; RCT: Randomised control trial; RESIST: Researching
Effective Strategies to Improve Insulin Sensitivity in Children and Teenagers;
OGTT: Oral glucose tolerance test; BMI%95 centile: BMI expressed as a
percentage of the 95th centile; ISI: Insulin sensitivity index; DXA: Dual energy
x-ray absorptiometry; CHW: The Children’s Hospital at Westmead;
ALT: Alanine aminotransferase; GTT: Gamma-glutamyl transferase; FMI: Fat
mass index; FFMI: Fat free mass index.
Competing interests
The authors declare that they have no competing interests.
Authors’ contributions
SPG, LAB, MN, CTC, KC designed the research. MG, MH, HJW, CRB, JB, SD, KS,
SS, GRA conducted research. SPG and MH analysed the data. All authors
contributed to writing and/or review of the paper. SPG had full access to all
the data in the study and takes responsibility for the integrity of the data
and data analysis. All authors read and approved the final manuscript.
Acknowledgements
We are extremely grateful to all the adolescents and families who took part
in this study. We would also like to acknowledge Fitness First for use of the
gym facilities, the personal trainers who volunteered their time to train the
participants and Alphapharm Pty Ltd for providing metformin. The following
food companies donated food to the hampers distributed to the participants
of the study: the Australian Egg Corporation, George Weston, Simplot
Australia Propriety Limited, Unilever Australia Limited, Meat and Livestock
Australia and Nestle Australia.
Financial support
The project was funded by BUPA Foundation Australia Pty Limited (2008 to
2012), Diabetes Australia Research Trust (DART) 2008 and Heart Foundation,
Australia (#G08S3758) 2009 to 2010. SPG was supported by a National Health
and Medical Research Council Australian (NHMRC) Clinical Research
Fellowship (#457225) 2007 to 2010 and an Early Career Research Fellowship,
Cancer Institute NSW 2011 to 2013. The funding organisations had no role in
the design, conduct, analysis/interpretation of the data, preparation, review,
or approval of the manuscript or decision to submit the manuscript for
publication.
Author details
1
Institute of Endocrinology and Diabetes, The Children’s Hospital at
Westmead, Locked Bag 4001, Westmead, Sydney, NSW 2145, Australia. 2Kids
Research Institute, The Children’s Hospital at Westmead, Locked Bag 4001,
Garnett et al. BMC Pediatrics 2014, 14:289
/>
Westmead, Sydney, NSW 2145, Australia. 3The Children’s Hospital at
Westmead Clinical School, University of Sydney, Locked Bag 4001,
Westmead, Sydney, NSW 2145, Australia. 4CSIRO Food and Nutritional
Sciences, PO Box 10041, Adelaide, BC South Australia 5000, Australia.
5
Department of Paediatrics, Campbelltown Hospital, PO Box 149,
Campbelltown, NSW 2560, Australia. 6Department of Diabetes and
Endocrinology, Sydney Children’s Hospital Network, Randwick, Sydney, NSW
2031, Australia. 7The Children’s Hospital Institute of Sports Medicine, The
Children’s Hospital at Westmead, Locked Bag 4001, Westmead, Sydney, NSW
2145, Australia. 8The School of Medical Sciences, UNSW Medicine, The
University of New South Wales, Sydney, NSW 2052, Australia. 9Nutrition and
Dietetics and Weight Management Services, The Children’s Hospital at
Westmead, Locked Bag 4001, Westmead, Sydney, NSW 2145, Australia.
10
Department of Nuclear Medicine, The Children’s Hospital at Westmead,
Locked Bag 4001, Westmead, Sydney, NSW 2145, Australia. 11Academic
Department of Adolescent Medicine, Sydney Medical School, University of
Sydney, Sydney, NSW 2066, Australia.
Received: 5 August 2014 Accepted: 6 November 2014
References
1. Weickert MO: What dietary modification best improves insulin sensitivity
and why? Clin Endocrino 2012, 77:508–512.
2. Abete I, Astrup A, Martinez JA, Thorsdottir I, Zulet MA: Obesity and the
metabolic syndrome: role of different dietary macronutrient distribution
patterns and specific nutritional components on weight loss and
maintenance. Nutr Rev 2010, 68:214–231.
3. Wycherley TP, Moran LJ, Clifton PM, Noakes M, Brinkworth GD: Effects of
energy-restricted high-protein, low-fat compared with standard-protein,
low-fat diets: a meta-analysis of randomized controlled trials. Am J Clin
Nutr 2012, 96:1281–1298.
4. Due A, Toubro S, Skov AR, Astrup A: Effect of normal-fat diets, either
medium or high in protein, on body weight in overweight subjects: a
randomised 1-year trial. Int J Obes Relat Metab Disord 2004, 28:1283–1290.
5. Paddon-Jones D, Westman E, Mattes RD, Wolfe RR, Astrup A, WesterterpPlantenga M: Protein, weight management, and satiety. Am J Clin Nutr
2008, 87:1558S–1561S.
6. Buyken AE, Mitchell P, Ceriello A, Brand-Miller J: Optimal dietary approaches
for prevention of type 2 diabetes: a life-course perspective. Diabetologia
2010, 53:406–418.
7. Gow ML, Ho M, Burrows TL, Baur LA, Stewart L, Hutchesson MJ, Cowell CT,
Collins CE, Garnett SP: Macronutrient distribution of the diet – impact on
BMI and cardiometabolic outcomes in overweight and obese children
and adolescents: a systematic review. Nutr Rev 2014, 72:453–470.
8. Gately PJ, King NA, Greatwood HC, Humphrey LC, Radley D, Cooke CB,
Hill AJ: Does a high-protein diet improve weight loss in overweight and
obese children? Obesity 2007, 15:1527–1534.
9. Duckworth LC, Gately PJ, Radley D, Cooke CB, King R, Hill AJ: RCT of a
high-protein diet on hunger motivation and weight-loss in obese
children: an extension and replication. Obesity 2009, 17:1808–1810.
10. Rolland-Cachera MF, Thibault H, Souberbielle JC, Soulie D, Carbonel P,
Deheeger M, Roinsol D, Longueville E, Bellisle F, Serog P: Massive obesity in
adolescents: dietary interventions and behaviours associated with weight
regain at 2 y follow-up. Int J Obes Relat Metab Disord 2004, 28:514–519.
11. Garnett SP, Gow M, Ho M, Baur LA, Noakes M, Woodhead HJ, Broderick CR,
Burrell S, Chisholm K, Halim J, De S, Steinbeck K, Srinivasan S, Ambler GR,
Kohn MR, Cowell CT: Optimal macronutrient content of the diet for
adolescents with prediabetes; RESIST a randomised control trial. J Clin
Endocrinol Metab 2013, 98:2116–2125.
12. Garnett SP, Baur LA, Noakes M, Steinbeck K, Woodhead HJ, Burrell S, Chisholm
K, Broderick CR, Parker R, De S, Srinivasan S, Hopley L, Hendrie G, Ambler GR,
Kohn MR, Cowell CT: Researching Effective Strategies to Improve Insulin
Sensitivity in Children and Teenagers-RESIST. A randomised control trial
investigating the effects of two different diets on insulin sensitivity in
young people with insulin resistance and/or pre-diabetes. BMC Public
Health 2010, 10:575.
13. Altman DG, Bland JM: Treatment allocation by minimisation. BMJ 2005, 330:843.
14. Cole TJ, Bellizzi MC, Flegal KM, Dietz WH: Establishing a standard definition
for child overweight and obesity worldwide: international survey. BMJ
2000, 320:240–1243.
Page 10 of 10
15. Evans S, Royston P, Day S: Minim: allocation by minimisation in clinical
trials [ />16. American Diabetes Association: Diagnosis and classification of diabetes
mellitus. Diabetes Care 2008, 31(Suppl 1):S55–S60.
17. Australian Government, Department of Health and Ageing: Australian,
National Children’s Nutrition and Physical Activity Survey 2008 [http://www.
health.gov.au/internet/main/publishing.nsf/Content/health-pubhlth-strategphys-act-guidelines/$File/FS-YPeople-13-17-Years.PDF]
18. Tanner JM, Whitehouse RH: Clinical longitudinal standards for height,
weight, height velocity, weight velocity, and stages of puberty. Arch Dis
Child 1976, 51:170–179.
19. Burke JPHD, Hazuda HP, Stern MP: A quantitative scale of acanthosis
nigricans. Diabetes Care 1999, 22:1655–1659.
20. Matsuda M, DeFronzo RA: Insulin sensitivity indices obtained from oral
glucose tolerance testing: comparison with the euglycemic insulin
clamp. Diabetes Care 1999, 22:1462–1470.
21. Norton K, Olds T: Anthropometrica. Sydney: University of NSW Press; 1996.
22. Centres for Disease Control. 2000 CDC Growth Charts for the United States
[ />23. Flegal KM, Wei R, Ogden CL, Freedman DS, Johnson CL, Curtin LR:
Characterizing extreme values of body mass index-for-age by using the
2000 centers for disease control and prevention growth charts. Am J Clin
Nutr 2009, 90:1314–1320.
24. Kuczmarski RJ, Ogden CL, Guo SS: CDC growth charts for the United
States: methods and development. Vital Health Stat 2000, 2002(11):1–190.
25. National High Blood Pressure Education Program Working Group on High
Blood Pressure in Children Adolescents: The fourth report on the
diagnosis, evaluation, and treatment of high blood pressure in children
and adolescents. Pediatrics 2004, 114(Suppl 2):555–576.
26. Fraser A, Longnecker MP, Lawlor DA: Prevalence of elevated alanine
aminotransferase among US adolescents and associated factors:
NHANES 1999–2004. Gastroenterology 2007, 133:1814–1820.
27. Wells JC, Williams JE, Chomtho S, Darch T, Grijalva-Eternod C, Kennedy K,
Haroun D, Wilson C, Cole TJ, Fewtrell MS: Body-composition reference
data for simple and reference techniques and a 4-component model:
a new UK reference child. Am J Clin Nutr 2012, 96:1316–1326.
28. Papadaki A, Linardakis M, Larsen TM, Van Baak MA, Lindroos AK, Pfeiffer AF,
Martinez JA, Handjieva-Darlenska T, Kunesova M, Holst C, Astrup A, Saris
WH, Kafatos A: The effect of protein and glycemic index on children’s
body composition: the DiOGenes randomized study. Pediatrics 2010,
126:e1143–e1152.
29. Damsgaard CT, Papadaki A, Jensen SM, Ritz C, Dalskov SM, Hlavaty P, Saris
WH, Martinez JA, Handjieva-Darlenska T, Andersen MR, Stender S, Larsen TM,
Astrup A, Molgaard C, Michaelsen KF: Higher protein diets consumed ad
libitum improve cardiovascular risk markers in children of overweight
parents from eight European countries. J Nutr 2013, 143:810–817.
30. Quinn S, Baur L, Garnett S, Cowell C: Treatment of clinical insulin
resistance in children: a systematic review. Obes Rev 2010, 11:722–730.
31. Park MH, Kinra S, Ward KJ, White B, Viner RM: Metformin for obesity in
children and adolescents: a systematic review. Diabetes Care 2009,
32:1743–1745.
32. Kendall D, Vail A, Amin R, Barrett T, Dimitri P, Ivison F, Kibirige M, Mathew V,
Matyka K, McGovern A, Stirling H, Tetlow L, Wales J, Wright N, Clayton P,
Hall C: Metformin in obese children and adolescents: the MOCA trial.
J Clin Endocrinol Metab 2013, 98:322–329.
33. Cook JS, Hoffman RP, Stene MA, Hansen JR: Effects of maturational stage on
insulin sensitivity during puberty. J Clin Endocrinol Metab 1993, 77:725–730.
34. Ho M, Garnett SP, Baur LA, Burrows T, Stewart L, Neve M, Collins C: Impact
of dietary and exercise interventions on weight change and metabolic
outcomes in obese children and adolescents: a systematic review and
meta-analysis of randomized trials. JAMA Pediatr 2013, 167:759–768.
35. Steinbeck K, Baur L, Cowell C, Pietrobelli A: Clinical research in adolescents:
challenges and opportunities using obesity as a model. Int J Obes 2008,
33:2–7.
doi:10.1186/s12887-014-0289-0
Cite this article as: Garnett et al.: Improved insulin sensitivity and body
composition, irrespective of macronutrient intake, after a 12 month
intervention in adolescents with pre-diabetes; RESIST a randomised control
trial. BMC Pediatrics 2014 14:289.