Genetic variability, heritability and genetic advance studies in quantitataive traits in rice (Oryza sativa L.)
Bạn đang xem bản rút gọn của tài liệu. Xem và tải ngay bản đầy đủ của tài liệu tại đây (291.01 KB, 7 trang )
Int.J.Curr.Microbiol.App.Sci (2019) 8(8): 2220-2226
International Journal of Current Microbiology and Applied Sciences
ISSN: 2319-7706 Volume 8 Number 08 (2019)
Journal homepage:
Original Research Article
/>
Genetic Variability, Heritability and Genetic Advance studies in
Quantitataive Traits in Rice (Oryza sativa L.)
Sirigadi Rajesh*, K. Chaithanya, J. Sajeev, B. Jalandhar Ram and B. G. Suresh
Department of Genetic and Plant Breeding, Sam Higginbottom University of Agriculture,
Technology and Sciences, Prayagraj-(211007), Uttar Pradesh, India
*Corresponding author
ABSTRACT
Keywords
Rice (Oryza sativa L.),
genetic variability,
heritability and genetic
advance
Article Info
Accepted:
18 July 2019
Available Online:
10 August 2019
The present investigation carried out on 25 rice genotypes during Kharif-2018 at
field experimentation centre of Genetics and Plant Breeding, Naini Agricultural
Institute, SHUATS, Prayagaraj to assess genetic variability, heritability and
genetic advance. Analysis of variance showed highly significant genetic
variability for all the 25 rice genotypes for 13 quantitative characters studied
indicating that significant at 1% and 5% genetic variability present in the material.
High to moderate estimates of GCV and PCV were recorded for number of
panicles per hill, number of spikelets per panicle, test weight, flag leaf length, days
to 50% flowering, plant height, and grain yield per hill. High estimates of
heritability coupled with high values of genetic advance as perecent mean was
observe for characyers number of spikelets per panicle, days to 50% flowering,
number of panicles per hill and test weight respectively suggesting there was
preponderance of additive gene action for the experession of these characters.
Hence selection of these traits were useful for further improvement in breeding
programme.
Introduction
Rice (Oryza sativa L.) is a cultivated crop
belonging to family Graminae, sub-family
Bamboosoideae and tribe Oryzeae (sarla and
Swamy, 2005). It is diploid with 12
chromosomes (2n=24) (Garriset et al., 2005).
Rice is cultivated as low as 3m below sea
level in Bhutan and Nepal khush and Virk,
2000). It is one of the major food crops all
over the world and is the most widely
consumed staple food for large part of the
world’s human population, especially in Asian
region. It is the agricultural commodity which
in production ranks third (741.5 million tons
in 2014) worldwide after sugarcane and
maize. However, in aspect of calories intake
and nutrition, it is the most important grain
which provides more than one fifth of the
calories to human, worldwide (Smith, Bruce
D, 1998). Rice contains starch (75-80%),
water (12% and protein (7%) (Hossain et al.,
2015). Also, in many countries of the world,
rice is the source of animal feed (Muhammad
2220
Int.J.Curr.Microbiol.App.Sci (2019) 8(8): 2220-2226
et al., 2015). According to Economic survey
2017-2018 total production of rice in India is
110.2 million tons with gross area of 43.2
million hectares, whereas yield per hectare is
2550 kg. Indian states like West Bengal
contributes (15.1 million tons), U. P (12.9
million tons) and Punjab (11.0 million tons) in
production of rice in India.
Materials and Methods
The experimental material comprised of 25
germplasm of rice (oryza sativa L.) grown in
RBD at field experimentation centre of
Genetics and Plant Breeding, Naini
Agricultural Institute, SHUATS, Prayagraj, U.
P, India, during Rabi 2018. The recommended
agronomic and plant protection measures were
followed in order to raise a normal crop.
Observations on 13 different quantitative
characters viz., days to 50% flowering, days to
maturity, plant height, flag leaf length, flag
leaf width, number of tillers per hill, number
of panicles per hill, panicle length, number of
spikelets per panicle, biological yield, test
weight, harvest index and grain yield per hill
were recorded on 5 randomly selected plants
for each replication of each genotype except
for days to 50% flowering and days to
maturity where data is recorded based on plot
basis during various phenophase of the crop.
Mean values of 5 randomly selected plants of
3 replications for each genotype were
averaged and expressed as the mean of the
respective character and considered by RBD
for each of the character separately as per
standard statistical procedure given by (Panse
and Sukhtame, 1978).
Heritability (h2) in the broad sense was
calculated according to the formula given by
(Allard, 1960) for all the characters.
Phenotypic and genotypic coefficient of
variation (PCV and GCV) were computed
according to (Burton, 1952).
Results and Discussion
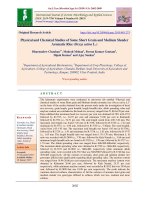
Analysis of variance shown that highly
significant differences among the genotypes
for all the traits as shown in Table 1. This
indicates that there was an ample scope for
selection of promising lines from the present
gene pool for yield and its components. The
presence of large amount of variability might
due to diverse source of materials taken as
well as environmental influence affecting the
phenotypes.
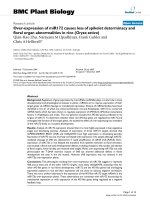
On the basis of mean performance as shown in
Table 2, the highest grain yield per hill was
observed for the rice genotypes like MTU1075 (43.00g) followed by MTU-1121
(42.40g), MTU-1001 (40.50g) and IR-11N187 (40.20g) was found to be superior in grain
yield.
In the present investigation as shown in Table
3. The studies on GCV and PCV indicated that
the presence of high amount of variation and
role of the environment on the expression of
these traits. The magnitude of PCV was higher
than GCV for all the characters which may
due to higher degree of interaction of
genotype with the environment (Senapathi and
Kumar, 2015).
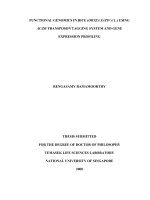
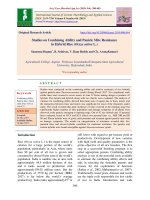
Among the 13 quantitative characters GCV
ranged from harvest index (4.31%) to number
of panicles per hill (31.11%). The GCV
estimates would show that the genotypic
variability was low (below 10%) for harvest
index (4.31%), biological yield (8.91%) and
panicle length (9.94%). Moderate (10-20%)
for flag leaf width (10.98%), grain yield per
hill (11.19%), days to maturity (11.53%),
plant height (11.92%), days to 50% flowering
(13.77%), number of tillers per hill (14.32%),
flag leaf length (17.94%) and test weight
(18.59%). High for (above 20%) number of
spikelets per panicle (23.67%) and number of
panicles per hill (31.11%).
2221
Int.J.Curr.Microbiol.App.Sci (2019) 8(8): 2220-2226
The PCV ranged from harvest index (5.29%)
to number of panicles per hill (31.27%). The
PCV estimates would show that the
phenotypic variability was low for harvest
index (5.29%), Moderate for panicle length
(10.46%), flag leaf width (11.34%), grain
yield per hill (11.53%), plant height (12.34%),
days to 50% flowering (13.78%), biological
yield (14.49%), days to maturity (15.54%),
number of tillers per hill (17.52%), test weight
(18.83%) and flag leaf length (18.92%). High
for number of panicles per hill (31.27%).
In the present investigation, as expected, the
PCV estimates were higher than the GCV
estimates the variation due to environment as
well as variation due to interactions. However,
there was a close correspondence between the
estimates of PCV and GCV for the characters
viz., days to 50% flowering, days to maturity,
plant height, panicle length, flag leaf width,
biological yield, test weight and grain yield
per hill under study indicating the fact that
these characters were less influenced by the
environmental factors as evidenced from the
less differences in magnitude of PCV and
GCV.
In contrast, others characters, viz.,biological
yield, days to maturity, number of tillers per
hill and harvest index were highly influenced
by environment as evidenced from high
magnitudinal
differences
between
the
estimates of PCV and GCV. Hence selection
for these characters sometimes may be
misleading. These environmental factors could
be due to heterogeneity in soil fertility status
and other unpredictable factors (Reddy et al.,
2012). The findings of (Falconer, 1960) are
not only helpful in determining the heritable
portion of variation. For this estimates of
heritability of these traits are necessary.
Similar pattern of PCV and GCV was reported
by several workers for all of most of these
characters (Dhurai et al., 2014, Rashmi et al.,
2017, and Harsha et al., 2017). According to
Burton and Devane (1953) heritability in
broad sense is ratio bêtween genotypic
variance to total variance.
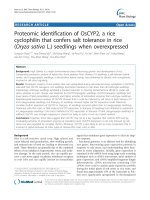
Table.1 Analysis of variance for 13 characters of 25 rice genotypes during kharif-2018
Characters
Days to 50% flowering
Plant height
Flag leaf length
Flag leaf width
No of Tillers/hill
No of Panicles/ hill
Panicle length
No of Spikelets/panicle
Days to maturity
Biological yield
Test weight
Harvest Index
Grain Yield/ Plant
Mean Sum of Squares
Replication
Treatments
(df= 2)
(df= 24)
0.013
579.564**
2.271
577.556**
1.64
122.00**
0.005
0.086*
1.281
12.245**
0.410
12.249**
1.638
22.497**
1.960
7445.784**
122.080
855.119**
98.314
206.566**
1.960
51.708**
4.029
15.152**
5.760
49.465**
Error
(df=48)
0.305
13.729
4.42
0.002
1.742
0.126
0.772
0.960
182.511
73.190
0.460
2.192
1.010
** Significant at 1% level of significance, * Significant at 5% level of significance
2222
Int.J.Curr.Microbiol.App.Sci (2019) 8(8): 2220-2226
Table.2 Mean performance for 13 quantitative characters of 25 rice genotypes during kharif-2018
Genotypes
MTU - 1001
MTU - 1061
MTU - 1064
MTU - 1075
MTU - 1121
MTU - 7029
BPT - 3291
BPT - 5204
MTU - 1010
HHZ3 - SAL6 - Y1 Y2
IR - 11A 257
IR - 10N 276
HHZ4 - SAL 12 - LI1
- LI2
PR - 133
IR - 11N - 187
IR - 118 - 304
SHIATS DHAN - 1
SHIATS DHAN - 2
SHIATS DHAN - 3
SHIATS DHAN - 4
SHIATS DHAN - 5
TP – 30596
TP – 30601
TP – 30603
TP – 30606
Mean
CD5%
Max
Min
Days to
50%
flowering
111.33
126.00
122.67
121.33
119.67
119.00
114.67
121.00
88.33
88.00
Plant
height
(cm)
111.87
99.83
105.21
111.06
104.48
83.85
94.28
89.25
106.73
120.04
Flag leaf
length
(cm)
35.65
27.30
30.67
29.78
30.49
20.20
35.54
24.31
26.41
41.64
Flag leaf
width
(cm)
1.59
1.33
1.49
1.56
1.61
1.32
1.75
1.23
1.31
1.55
No of
Tillers/
hill
14.33
16.47
14.53
12.33
12.93
15.27
11.40
15.80
15.07
11.27
No of
Panicles/
hill
13.20
14.27
12.47
9.00
10.80
14.73
10.27
13.13
14.47
9.13
Panicle
length
(cm)
25.40
24.40
24.70
25.80
26.50
23.90
22.30
23.00
25.60
26.00
No of
Spikelets/
panicle
197.67
196.67
241.67
256.33
259.00
231.67
262.33
249.00
202.00
316.33
Days to
maturity
Biological
yield (g)
Test
weight(g)
138.67
153.67
149.67
149.33
147.67
148.00
142.67
150.00
116.00
118.00
85.13
74.67
80.20
83.87
86.80
71.53
76.27
72.87
58.87
69.00
95.33
87.00
86.00
129.13
140.20
125.87
40.04
41.76
37.90
1.41
1.58
1.51
13.40
9.27
11.67
10.33
9.13
10.60
34.10
25.90
29.30
187.00
244.00
171.67
124.33
115.00
116.00
94.67
98.33
94.67
98.00
93.67
91.67
105.00
95.67
86.33
88.33
87.33
89.33
100.93
0.91
126.00
86.00
110.10
127.50
126.30
130.11
126.81
119.84
128.70
120.77
109.11
121.57
112.21
121.56
115.06
6.08
140.20
83.85
37.87
48.03
33.57
41.59
40.45
32.67
38.55
37.97
32.69
36.95
39.11
31.41
34.90
3.45
48.03
20.20
1.79
1.39
1.54
1.87
1.50
1.24
1.68
1.38
1.55
1.51
1.61
1.72
1.52
0.07
1.87
1.23
9.67
12.20
12.47
16.60
13.40
14.00
12.40
15.40
13.07
10.80
10.73
12.27
13.07
2.17
16.60
9.27
7.67
10.07
11.40
14.40
10.33
12.00
10.27
13.27
10.73
9.60
8.53
10.93
11.23
0.58335
14.73
7.67
24.80
29.50
31.60
26.80
27.90
30.20
26.50
28.70
29.40
28.10
27.90
28.40
27.07
1.44
34.10
22.30
200.67
239.00
217.33
274.33
147.33
216.33
212.33
213.67
124.33
152.00
132.67
117.00
210.49
1.61
316.33
117.00
122.67
127.33
123.67
127.00
121.67
120.67
134.00
124.67
115.50
118.33
116.67
119.33
129.62
22.18
153.67
115.00
2223
16.98
19.44
22.80
17.38
18.58
18.38
15.34
16.64
24.82
22.56
Harvest
Index
(%)
47.81
42.57
48.02
51.48
48.98
49.94
49.45
47.55
50.43
48.19
Grain
Yield/
hill (g)
40.50
31.60
38.50
43.00
42.40
35.60
36.70
34.80
30.20
33.30
79.80
51.20
67.27
26.50
23.56
22.76
49.73
51.93
46.31
38.70
26.90
30.70
70.47
82.47
71.93
79.67
80.47
77.33
77.53
75.13
75.47
85.07
72.27
65.87
74.85
14.04
86.80
51.20
30.86
26.55
25.22
17.40
26.23
23.50
16.60
21.62
25.44
24.80
25.80
26.20
22.24
1.11
30.86
15.34
49.27
48.56
50.38
47.80
47.72
48.94
46.77
46.47
43.80
47.27
50.72
45.10
48.21
2.43
51.93
42.57
34.80
40.20
35.90
38.00
38.40
37.50
36.00
34.90
33.10
40.10
36.60
29.60
35.92
1.65
43.00
26.90
Int.J.Curr.Microbiol.App.Sci (2019) 8(8): 2220-2226
Table.3 Estimation of genetic parameters for grain yield and other components in rice
Characters
Vg
Vp
GCV
PCV
Days to 50%
flowering
Plant height
Flag leaf length
Flag leaf width
No of Tillers/hill
No of Panicles/ hill
Panicle length
No of
Spikelets/panicle
Days to maturity
Biological yield
Test weight
Harvest Index
Grain Yield/ hill
193.09
193.39
13.77
187.94 201.67
39.19
43.61
0.03
0.03
3.50
5.24
12.21
12.33
7.24
8.01
2481.61 2482.57
224.20
44.46
17.08
4.32
16.15
406.71
117.65
17.54
6.51
17.16
13.78
Heritability
(%) Bs
99.84
GA
28.60
GA AS
% Mean
28.34
11.92
17.94
10.98
14.32
31.11
9.94
23.67
12.34
18.92
11.34
17.52
31.28
10.46
23.67
93.19
89.86
93.66
66.78
98.98
90.37
99.96
27.26
12.22
0.33
3.15
7.16
5.27
102.60
23.70
35.03
21.88
24.10
63.77
19.47
48.74
11.53
8.91
18.59
4.31
11.19
15.54
14.49
18.83
5.29
11.53
55.13
37.79
97.38
66.34
94.11
22.90
8.44
8.40
3.49
8.03
17.64
11.28
37.78
7.23
22.36
Vg = genotypic variance, Vp = phenotypic variance, GCV = Genotypic coefficient of variation, PCV = Phenotypic
coefficient of variation, GA = Genetic advance
The estimates of genotypic coefficient of
variation (GCV) reflect the total amount of
genotypic variability present in the material.
However, the proportion of this genotypic
variability which is transmitted from parents
to offspring is reflected by heritability. Broad
sense heritability determines the efficiency
with which we can utilize the genotypic
variability in breeding programme. The
genotypic variance and its components are
influenced by the gene frequencies of genes
differ from one population to another,
estimates of heritability also vary from one
population to another for a given character.
The range of heritability was considered as
low (<30%), medium (30-60%) and high
(>60%) as proposed by Johnson et al., (1955).
The estimates of heritability from present
investigation are presented in Table 3.
In the present study, the heritability in broad
sense (h2) ranges from biological yield
(37.79%) to number of spikelets per panicle
(99.96%). High estimates of heritability
(above 60%) recorded for harvest index
(66.34%), number of tillers per hill (66.78%),
flag leaf length (89.86%), panicle length
(90.37%), plant height (93.19%), flag leaf
width (93.66%), grain yield per hill (94.11%),
test weight (97.38%), number of panicles per
hill (98.97%), number of spikelets per panicle
(99.96%) and days to 50% flowering
(99.84%). While moderate estimate of
heritability for (30-60%) biological yield
(37.79%) and days to maturity (55.13%).
None of the characters showed low estimates
of heritability (below 10%). It showed that the
phenotypic variability of none characters had
greater share of environmental.
The estimates of heritability are more
advantageous where expressed in terms of
genetic advance. Johnson et al., (1955)
suggested that without genetic advance the
estimates of heritability will not be of
practical value and emphasized the concurrent
use of genetic advance along with heritability.
Genetic advance as percent mean was low
2224
Int.J.Curr.Microbiol.App.Sci (2019) 8(8): 2220-2226
(below 10%) for harvest index (7.23%) and
moderate (10-20%) for biological yield
(11.28%), days to maturity (17.64%) and
panicle length (19.47%). While high genetic
advance as percent mean (above 20%)
recorded for flag leaf width (21.88%), grain
yield per hill (22.36%), plant height
(23.70%), number of tillers per hill (24.10%),
days to 50% flowering (28.34%), flag leaf
length (35.03%), test weight (37.78%),
number of spikelets per panicle (48.74%) and
number of panicles per hill (63.76%).
Most of the characters showed high
heritability coupled with high genetic advance
as percent mean was observed for flag leaf
width, grain yield per hill, plant height,
number of tillers per hill, days to 50%
flowering, flag leaf length, test weight,
number of spikelets per panicle and number
of panicles per hill. Whereas high heritability
coupled with moderate genetic advance as
percent mean was observed for biological
yield, days to maturity and panicle length
indicating that this charater seems to be
heritable and can be improved by selection.
These findings were in accordance with
Deepa et al., (2006), Prajapathi et al., (2011)
and Sandeep et al., 2018.
Moderate heritability coupled with high
genetic advance as percent mean was
observed for biological yield, while high
heritability coupled with low genetic advance
as percent mean was observed for number of
panicles per hill which indicated the moderate
influence of environment and selection would
be ineffective.
From the present investigation it is concluded
that among 25 genotypes of rice on the bases
of mean performance MTU-1010 (6.8 t/ha)
was found to be superior in grain yield over
the check followed by MTU-1121 (6.2 t/ha),
SHIATS DHAN-1 (6.0 t/ha) and MTU-1075
(5.9 t/ha) showed 1-1.2 t/ha over the check
and these genotypes showed high variability
for all 13 quantitative parameters taken in the
present study.
High to moderate estimates of GCV and PCV
were recorded for number of panicles per hill,
number of spikelets per panicle, test weight,
flag leaf length, days to 50% flowering, plant
height and grain yield per hill. High estimates
of heritability coupled with high values of
genetic advance as percent mean was
observed for characters number of spikelets
per panicle, days to 50% flowering, number
of panicles per hill and test weight
respectively suggesting that there was
preponderance in gene action.
References
Allard, R. W. 1960. Principles of Plant
Breeding. John Wiley and Sons Inc.
New York. pp 485.
Burton, G.W. (1952). Quantitative inheritance
of grasses. Proc. 6th International
Grassland Congress. 1: 277-283.
Burton, G.W. and Devane. (1953). Estimation
of heritability in tall fescue Festula
arundnacea from replicated clonal
material. Agronomy Journal, 45: 478481.
Dhurai, S.Y., Bhati, P.K. and Saroj, S.K.
(2014). Studies on Genetic Variability
For Yield and Quality Characters In
Rice (Oryza sativa L.) Under
Integrated.
Falconer, D. S. (1960). Introduction to
quantitative genetics Edinburgen and
London: Aliver and Bodyd.
Garris A. J., Tai T. H., Coburn J., Kresovich S
and Mc Couch S. Genetic Structure and
diversity in Oryza sativa Genetics.
2005; 169: 1631-1638.
Harsha, Deo, Indra., Kumar, sudhir and
Talha, Mohammed (2017). Assessment
of Genetic variability and character
association studies in rice genotypes
2225
Int.J.Curr.Microbiol.App.Sci (2019) 8(8): 2220-2226
(Oryza sativa L.). International Journal
of Current Microbiology and Applied
Sciences. 6(10); 2865-2869.
Hossain S., maksudu H.M. D and Jamilur R.
J. Genetic variability, Correlation and
Path
Coefficient
Analysis
of
Morphological traits in some Extinct
Local Aman Rice (Oryza sativa L.).
Journal of Rice Research. 2015; 3.
Islam. M. J., Raffi. S. A., Hossain. M A. and
Hanson. A. K. (2015). Analysis of
genetic variability, heritability and
genetic advance for yield and yield
associated traits in some promising
advanced lines of rice (Oryza sativa L.).
Progressive Agriculture. 26(1): 26-31.
Johnson, H.W., Robinson, H.F and Comstock,
R.E. (1955). Estimates of genetic and
environment variability in soyabean.
Agronomy Journal, 47: 314-318.
Khush G. S and Virk P. S. Rice breeding:
Achievement and future strategies.
Crop Improvement. 2000; 27: 115-144.
Muhammad, T., Dera, W. and Ahmed Z.
(2002). Genetic Variability of different
plant and yield characters in rice. Sarha
Journal of Agriculture, 18 (2): 207-210.
Panse, V. G and Sukhatne, P. V. (1961).
Statistical methods for agricultural
workers 2nd Edn ICAR, New Delhi ;P:
361.
Prajapathi, M.K., Singth, C. M., Suresh B. G.,
Lavanya, G. R and Jadhav. P. (2011).
genetic parameters for grain yield and
its component characters in rice (Oryza
sativa L.). Electronic Journal of Plant
Breeding. 2(2): 235-238.
Rashmi, Deep., Singh, Pawan Kumar.,
Loitongbam, Bapsila, (2017). Genetic
variability study for yield and yield
components in rice. International
Journal of Agriculture, Environment
and Biotechnology 10(2): 171-176,
April 2017.
Reddy, G. E., Suresh B. G., Sravan, T and
Reddy, A. (2013). Interrelationship and
cause effect analysis if rice genotypes in
North East Plain Zone. The Bioscan.
8(4): 1141-1144.
Sandeep. S, Sujatha. M, Subbarao. LV. and
Neeraja. C. N., (2018). Genetic
variability, heritability and genetic
advance studies in rice (Oryza sativa
L.). International Journal of Current
Microbiology and Applied Sciences.
7(12): 3719-3727.
Senapati, B.K and Kumar, A. (2015). Genetic
assessment of some phenotypic variants
of rice (Oryza Sativa L.) for quantitative
characters under the Gangatic plains of
West Bengal. Academic Journal. 4 (3):
187-201.
Smith., Bruce D. The Emergence of
Agriculture.
Scientific
American
Library A Division of HPHLP, New
York, ISBN 0-7167-6030-4. 1998.
How to cite this article:
Sirigadi Rajesh, K. Chaithanya, J. Sajeev, B. Jalandhar Ram and Suresh B. G. 2019. Genetic
Variability, Heritability and Genetic Advance studies in Quantitataive Traits in Rice (Oryza
sativa L.). Int.J.Curr.Microbiol.App.Sci. 8(08): 2220-2226.
doi: />
2226