DSpace at VNU: Molecular mapping of genes conferring aluminum tolerance in rice (Oryza sativa L.)
Bạn đang xem bản rút gọn của tài liệu. Xem và tải ngay bản đầy đủ của tài liệu tại đây (202.51 KB, 9 trang )
Theor Appl Genet (2001) 102:1002–1010
© Springer-Verlag 2001
O R I G I N A L A RT I C L E
V.T. Nguyen · M.D. Burow · H.T. Nguyen · B.T. Le
T.D. Le · A.H. Paterson
Molecular mapping of genes conferring
aluminum tolerance in rice (Oryza sativa L.)
Received: 29 March 2000 / Accepted: 16 August 2000
Abstract Crop productivity on acid soil is restricted by
multiple abiotic stress factors. Aluminum (Al) tolerance
seems to be a key to productivity on soil with a pH below 5.0, but other factors such as Mn toxicity and the deficiency of P, Ca and Mg also play a role. The development of Al-tolerant genotypes of rice is an urgent necessity for improving crop productivity in developing countries. Inhibition of root growth is a primary and early
symptom of Al toxicity. The present study was conducted to identify genetic factors controlling the aluminum
tolerance of rice. Several parameters related to Al tolerance, most importantly the relative root growth under Al
stress versus non-stress conditions, were scored in 188
F3 selfed families from a cross between an Al-tolerant
Vietnamese local variety, Chiembau, and an Al-susceptible improved variety, Omon269–65. The two varieties
are both Oryza sativa ssp. indica, but showed a relatively
high level of DNA polymorphism, permitting the assembly of an RFLP map consisting of 164 loci spanning
1,715.8 cM, and covering most of the rice genome. A total of nine different genomic regions on eight chromosomes have been implicated in the genetic control of root
and shoot growth under aluminum stress. By far the
greatest effects on aluminum tolerance were associated
with the region near WG110 on chromosome 1. This region does not seem to correspond to most of the genes
that have been mapped for aluminum tolerance in other
species, nor do they correspond closely to one another.
Most results, both from physiological studies and from
molecular mapping studies, tend to suggest that aluminum tolerance is a complex multi-genic trait. The identification of DNA markers (such as WG110) that are diagnostic for aluminum tolerance in particular gene pools
provides an important starting point for transferring and
pyramiding genes that may contribute to the sustainable
improvement of crop productivity in aluminum-rich
soils. The isolation of genes responsible for aluminum
tolerance is likely to be necessary to gain a comprehensive understanding of this complex trait.
Communicated by M.A. Saghai Maroof
V.T. Nyguyen · B.T. Lee
Institute of Biotechnology, Hanoi, Vietnam
V.T. Nguyen · M.D. Burow · A.H. Paterson
Plant Genome Mapping Laboratory, Texas A & M University,
College Station, Texas, 77843-2474, USA
H.T. Nguyen
Plant Molecular Genetics Laboratory, Texas Tech University,
Lubbock, Texas, 79409-0001, USA
T.D. Le
Department of Genetics, National University of Hanoi,
Hanoi, Vietnam
V.T. Nguyen · M.D. Burow · A.H. Paterson (✉)
Applied Genetic Technology Center (AGTEC),
Dept. Crop and Soil Science, Dept. Botany, and Dept. Genetics,
University of Georgia, 30602 Athens, Georgia, USA
Fax: +1-706-583-0160
e-mail:
Present address:
V.T. Nguyen, Department of Genetics,
National University of Hanoi, Hanoi, Vietnam
Keywords Restriction fragment length polymorphism
(RFLP) · Molecular-marker · Rice · Quantitative trait
locus (QTL) · Abiotic stress tolerance
Introduction
The tropics contains 58% of the world’s land that is suitable for agricultural production, as well as 73% of the
world population (FAO 1991). The adaptation of plants
for tropical agriculture is frequently synonymous with
adapting plants to soil stress. Soil-fertility stresses or
soil-nutrient stresses, including both deficiencies and
toxicities, limit agricultural production in the tropics as
well as in many temperate regions. Sanchez and Salinas
(1981) estimated that approximately 55% of the soil in
tropical America, 39% in tropical Africa, and 37% in
tropical Asia are acidic, representing 1.6 billion hectares.
Crop productivity on acid soils is restricted by multiple abiotic stress factors. Since the forms of soil alumi-
1003
num (Al) and their solubilities are high, at a pH of 5 or
less, aluminum toxicity becomes one of the major growth
limiting factors affecting plants on acid soil (Kochian
1995). Symptoms of Al toxicity are not always easily
identified; however, the initial and most dramatic symptom of Al toxicity is the inhibition of root elongation as a
consequence of toxicity to the root apex (Wallace and
Anderson 1984; Taylor 1988, 1991; Ryan et al. 1992,
1993; Delhaize and Ryan 1995; Kochian 1995). Roots injured by high Al are usually stubby and thick, and become dark-colored, brittle, poorly branched and suberized
with a reduced root length and volume. Aluminum toxicity may inhibit shoot growth by limiting the supply of nutrients and water due to poorer subsoil penetration or
lower root hydraulic conductivity. Shoot growth is also
affected by Al toxicity, either due to reduced nutrient and
water supply, or to a limited supply of cytokinins from
the roots (Pan et al. 1989). Massot et al. (1992) showed
that scoring for Al tolerance, using root elongation as a
single criterion, may avoid the mis-classification of genotypes which accumulate a large amount of Al in shoots.
The physiological and biochemical mechanisms of
aluminum toxicity are a matter of controversy (Kochian
1995). Because Al can interact with a number of extracellular and intra-cellular structures, many different
mechanisms of Al toxicity have been hypothesized. Aluminum rhizotoxicity may be related to a disruption of
membrane function, probably due to changes in the structure and function of the root-cell plasmalemma (Zhao et
al. 1987). Depending on the pH, aluminum can bind to
membrane proteins and lipids (Campbell et al. 1994) and
participate in the formation of cross-links between proteins and pectins within the cell wall, reducing membrane
integrity (Foy 1983). Disturbed mitotic process may also
contribute to abnormal root growth (Morimura et al.
1978; Foy 1982a, b). Aluminum is particularly concentrated in the nucleus, and the cell cycle is inhibited, probably at the level of DNA replication (Foy 1974, 1982a, b;
Foy et al. 1978). Although aluminum may bind to DNA
(Matsumoto 1991) of the root cap cells in particular
(Naidoo et al. 1978), the inhibition of cell division is presumably an indirect effect. Rengel (1992) has hypothesized that Al3+ blockage of Ca2+ channels could prevent
the formation of important cytoplasmic Ca2+ transients
needed for cell division to occur. Al3+ is probably an effective cation channel blocker, since it blocks both Ca2+
and K+ channels in wheat root cells (Gassmann and
Schroeder 1994; Huang et al. 1993).
Rice, the world’s leading food crop, is profoundly affected by aluminum toxicity. Many researchers have reported the identification of Al-tolerant genotypes in
rice, as well as in wheat, maize, sorghum and soybean
(Armiger et al. 1968; Howeler and Cadavid 1976;
Fageria et al. 1988; Massot et al. 1992; Sivaguru et al.
1992; Sivaguru and Paliwal 1993; Khatiwada et al. 1996;
Urrea-Gomez et al. 1996; Bushamuka and Zobel 1998;
Massot et al. 1992; Sousa 1998). The identification of
DNA markers diagnostic of Al tolerance can accelerate
the development of cultivars that can remain productive
even under Al stress, and may be the starting point for
identifying the specific genes responsible for differences
in the response of plant genotypes to toxic aluminum
levels.
The main objective of the present study was to use
molecular markers to further examine and characterize
the genes and QTLs controlling aluminum tolerance in
rice, using a cross between an Al-tolerant variety, Chiembau (tropical indica) and an Al-susceptible improved
variety, Omon 269–65 (tropical indica).
Materials and methods
Aluminum tolerance screening
The experimental materials were developed by crossing Chiembau, a leading local aluminum-tolerant rice variety (tropical indica) in the north of Vietnam, with Omon 269–65, an improved
variety (tropical indica) from the south of Vietnam. From this
cross, 188 F2 plants were randomly selected and selfed to produce
182 F3 lines. Six F3 lines did not provide sufficient seed to be used
in the progeny test.
The parental lines and 182 self-pollinated F3 families were
screened for Al tolerance using a nutrient-solution culture modified
from Khatiwada et al. (1996). Entries were arranged in a randomized complete block design with three replications. Seeds of uniform size were sterilized with 15% H2O2, rinsed with distilled water, and incubated on filter papers soaked with distilled water in the
dark at 30°C for 2 days. Germinated seeds were grown in distilled
water for another 2 days in a culture room maintained at 27±2°C
with 12 h of light at 300 PPFD. Seedlings were then sown on a styrofoam sheet with a nylon net bottom, with one seedling per hole
and 18 seedlings in one row per line in each replication. The styrofoam sheets were floated on a nutrient solution (Yoshida et al.
1976) in a plastic tray containing either 0 (control) or 30 ppm of Al
(stress treatment). The nutrient solution was replaced every 5 days.
The pH of the solutions was adjusted daily to 4.0 with 1 N NaOH
or 1 N HCl. This level of Al stress was optimal for differentiating
among rice genotypes based on a preliminary screen of 40 varieties
at Al levels ranging from 0 to 200 ppm (data not shown), and is
also consistent with the levels used by other workers (Khatiwada et
al. 1996) to screen for the Al tolerance of rice.
The longest root of each seedling was measured after 10 days
of growth in control or stress solutions. The ratio of average root
length under stress versus non-stress conditions for each line in
each replication was computed, as follows, as an indicator of the
root tolerance index:
RR = SRL ×100%
CRL
where,
RR=root length ratio (%),
SRL=stress root length at 30 ppm Al (cm),
CRL=control root length at 0 ppm Al (cm).
The shoot length ratio (SR), was calculated in the same manner,
based on the stress shoot length (cm) at 30 ppm Al (SSL), versus
the control shoot length (cm) at 0 ppm Al.
Restriction fragment length polymorphism (RFLP) genotyping
Genomic DNA of the parents and 188 F2 progeny was extracted
from 2 g of lyophilized leaf tissue, as described by Li et al. (1995).
DNA was digested with XbaI, HindIII, EcoRI and EcoRV. Electrophoresis, Southern blotting, and autoradiography followed standard procedures (Chittenden et al. 1994).
1004
Data analysis
Construction of the linkage map
An RFLP linkage map was constructed using MAPMAKER
(Lander et al. 1987). A LOD score of 3.0 was used for two-point
analysis and a LOD difference of 2.0 was used for all three-point
and multi-point analysis. The assignment of linkage groups or
markers to their corresponding chromosomes was based on
McCouch and Tanksley (1991). Trait means (for measurements
described above), correlations, and heritability were determined
using SAS (SAS Institute 1987). The mapping of QTLs was performed according to the method of interval mapping (Paterson et
al. 1988; Lander and Bostein 1989) using MAPMAKER/QTL 1.1
(Lincoln et al. 1992). Based on a chromosome number of 12, and
the observed map length of 1,715.8 cM, a LOD score of 2.5 was
selected as the threshold for claiming the presence of a QTL
(Lander and Bostein 1989). With such a threshold, the probability
that even a single false-positive QTL would be detected anywhere
in the rice genome is approximately 0.05. Possible QTLs with a
LOD >2.0 were also noted. In all cases where initial scans suggested two or more QTLs on the same chromosome, tests for independence of the QTLs were performed as described (Paterson et
al. 1988; Lander and Bostein 1989). The QTLs reported are those
that truly represent independent QTLs, rather than correlated effects of the same genetic locus. QTLs were designated with a Q to
indicate they were detected through QTL mapping, followed by an
abbreviation of the trait name and the chromosome number. A final letter was used to accommodate situations where more than
one QTL affecting a trait was identified on the same chromosome.
Chi-square values were calculated to examine if the observed allelic and genotypic frequencies of the marker loci deviated from
the expected ratios. The proportion of total genotypic variance explained collectively by all identified QTLs for each trait was obtained by fitting the model containing all QTLs for the given trait
in MAPMAKER/QTL.
Two hundred and sixteen loci at intervals of about 8 cM
were surveyed in the parents using previously mapped
RFLP probes (Causse et al. 1994) generously provided
by Steven Tanksley, Susan McCouch (Cornell) and Olin
Anderson (USDA-ARS, Albany Calif.), supplemented
with heterologous probes available in the Paterson laboratory. Approximately 68% of the probes detected
RFLPs. A subset of 137 probes detected 164 RFLP
marker loci in the 188 F2 progeny from the cross Chiembau×Omon 269–65. These loci comprised a map of 19
linkage groups that spanned 1,715.8 cM with an average
distance of 10.46 cM (Kosambi 1944) between markers
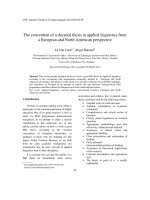
(Fig. 2). There were gaps on chromosomes 1, 2, 3, 4, 8
and 10, but the genome coverage was estimated to be approximately 90% based on alignment to the maps of Causse et al (1994). The order of markers approximately
agrees with the map of Causse et al. (1994), Li et al.
(1995), and Alam and Cohen (1998). Six possible inversions were found. However, all except one
(RG152–RG555) involved very closely linked pairs of
loci, or pairs of loci that were flanked by gaps in the
map, suggesting probable small errors in one or more
maps rather than true differences in chromosome structure. The inversions are as follows: two on chromosome
1 (RZ730b–RG780; RG246a–RG532a), two on chromosome 2 (CDO395–RG139; RG152–RG555), one on
chromosome 3 (CDO122–RZ488), one on chromosome
10 (RG421–RG561), and two on chromosome 11
(RG1109–RG353; RG1094–RG2). Among the total of
137 probes, 15 (11%) detected polymorphism at loci that
were on different chromosomes from previously mapped
locations (RG98, RG118, RG313a, RG323, RG433,
RG598, RZ213, RZ244, RZ251, RZ291, RZ455, RZ909,
CDO192a, CDO1380a and CDO1395a). This result is approximately consistent with the level of sequence duplication previously reported in rice. We report for the first
time (based on a search of the Rice Genes database) the
location in rice of CDO1380b, CDO1395b, CSU039,
CSU382a, CSU382b, pSB414, pSB108, RG247b,
RG313b, RG313c, RG445b, RG996, RZ342 and WG110.
Results
Phenotypic performance
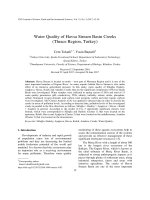
The mean value of the CRL, SRL, RR, CSL, SSL and SR
from the F3 population, as well as the SRL of the F2 population and the two parents, and the broad-sense heritability for each trait are summarized in Fig. 1. The root and
shoot length of Chiembau and Omon 269–65 showed a
differential response to aluminum stress, as expected.
Chiembau has a higher SRL, RR, SSL and SR, indicating
its tolerance. Chiembau also had higher root and shoot
length of controls (non-stressed plants). Root length was
more-sensitive than shoot length to Al stress, as reflected
by the smaller values for root length ratio than for shoot
length ratio. The frequency distribution of CRL, SRL,
RR, CSL, SSL and SR of F3 and SRL of F3 progeny was
approximately normal. In all cases the range of progeny
phenotypes was appreciably greater than the range of parental values, suggesting transgressive variation.
Heritabilities based on replicated tests of F3 progenies
were very high for all traits (0.788–0.942; Fig. 1). By
comparison, the heritability of root length under Al
stress based on the measurement of single F2 plants was
very low (0.06; Fig. 1), reflecting the need for replicated
testing to obtain a reliable assessment of the genetic potential for this trait.
Segregation of marker loci in the F2 population
The overall genomic composition of the F2 population
showed an average of 50.13% (4.2%) of the genome
coming from Chiembau, remarkably close to the expected 50%. A total of 54 (32%) markers, grouped into 30
regions (Fig. 2) on all 12 chromosomes, showed significant deviations (0.05) from expected segregation ratios
based on the chi-square test. The most common deviation is an excess of the Omon homozygote (nine cases),
followed by an excess of heterozygotes (eight cases),
with six cases of excess Chiembau homozygotes, two
cases of heterozygote deficiency, and five cases that cannot be evaluated because the diagnostic markers are
dominant/recessive.
1005
Fig. 1a–g Phenotypic distributions for 182 F3 lines and 188
F2 lines from the cross Chiembau×Omon269–65. a Distribution for control root length.
b Distribution for stress root
length. c Distribution for root
length ratio. d Distribution for
control shoot length. e Distribution for stress shoot length.
f Distribution for shoot length
ratio. g Distribution for stress
root length of 188 F2 lines. P1:
Omon 269–65; P2: Chiembau;
h2b: broad-sense heritability
Interval mapping of QTLs
Control root length
Biometrical parameters for each QTL are presented in
Table 1. While the primary goal of this experiment is
best reflected by the stressed root length, and the ratio of
the length of stressed versus non-stressed roots, QTLs
that confer different rates of root and/or shoot growth independently of Al stress are also of potential interest to
the breeding and genetic communities. Therefore, we
have presented QTLs for all measured traits.
Two QTLs, QAlCr2a and QAlCr3a, were identified on
chromosomes 2 and 3, and a possible QTL (QAlCr6a;
based on the 3.0>LOD>2.0 criteria stated in the data
analysis) on chromosome 6. Chiembau had the favorable
alleles (longer root length) for QAlCr3a and QAlCr6a,
consistent with the difference between the parents.
Omon269–65 had the favorable allele for QAlCr2a, possibly explaining some of the transgressive variation. A
full model containing the three QTLs explained 18.3%
of the phenotypic variance.
1006
Fig. 2 Chromosomal locations of putative QTLs contributing to
Aluminum tolerance of F2 and F3 progeny of Chiembau×Omon
269–65, as reflected by root and shoot growth. Bars and whiskers
to the left of the chromosome(s) indicate 1-LOD and 2-LOD likelihood intervals, respectively. *, **, and *** indicate segregation
distortion significant at 0.05, 0.01, and 0.005
1007
Stress root length
Three QTLs, QAlSr1a, QAlSr1b and QAlSr12a, were
identified on chromosomes 1 and 12. Chiembau had the
favorable alleles (longer root length) for all three, consistent with the difference between the parents. QAlSr12a
showed evidence of overdominance, with a dominance
deviation more than triple the additive effect, possibly
explaining some of the transgressive variation. A full
model containing the three QTLs explained 38.9% of the
phenotypic variance. An additional QTL, QA1R1a, was
found on chromosome 1 near QAlSr1b based on measurement of the F2 plants, barely meeting the significance level. No other QTLs could be detected in the F2
plants.
a marked heterozygote disadvantage. A full model containing the five QTLs explained 39.8% of the phenotypic
variance.
Control shoot length
Two QTLs, QAlCs1a and QAlCs10a, were identified on
chromosomes 1 and 10, respectively. Chiembau had the
favorable alleles (longer shoot length) for both, consistent with the difference between the parents. However,
the additive effect of the Chiembau allele for QAlCs10a
was very small, and the dominance deviation was about
9-times larger, possibly explaining some of the transgressive variation. A full model containing the two
QTLs explained 44.9% of the phenotypic variance.
Root length ratio
Stress shoot length
Three QTLs, QAlRr1a, QAlRr2a and QAlRr3a, were
identified on chromosomes 1, 2 and 3, and two possible
QTLs, QAlRr5 and QAlRr11a, on chromosomes 5 and
11. Chiembau had the favorable alleles (less impaired by
stress) for QAlRr1a, QAlRr5 and QAlRr2a, consistent
with the difference between the parents. Omon269–65
had the favorable allele for QAlRr11a, possibly explaining some of the transgressive variation. QAlRr3a showed
Three QTLs, QAlSs1a, QAlSs1b and QAlSs10a, were
identified on chromosomes 1 (two) and 10, respectively.
A possible QTL, QAlSs3a, was found on chromosome 3.
Chiembau had the favorable alleles (longer shoot length)
for QAlSs1a, QAlSs1b and QAlSs3a, consistent with the
difference between the parents. However, the additive effect of the Chiembau allele for QAlSs3a was very small,
Table 1 QTL for Aluminum tolerance in F2 and F3 from the cross Chiembau×Omon269–65
Traita
Locusb
Flanking marker
Chr.
Additive
effectc
Dominanced
Peak LOD
score
% Variance
explained
SRLF2
CRLF3
QAlR1a
QAlCr3a
QAlCr6a
QAlCr2a
QAlSr1a
QAlSr1b
QAlSrl2a
QAlRr1a
QAlRr3a
QAlRr5a
QAlRr11a
QAlRr2a
QAlSs1a
QAlSs1b
QALSs3a
QAlSs10a
QAlCs1a
QAlCs10a
QAlS3a
QAlS6a
RG323-WG110
RG996-RZ142
RZ682-CDO544
RG139-CDO395
RG459-RZ390b
WG110-RG109
RZ397-RZ816b
WG110-RG109
RG996-RZ142
BCD454-RG470
RG2-RZ53
RG139-CDO395
WG110-RG109
RG394-RZ730a
RG996-RZ142
BCD386-RZ421
WG110-RG109
RZ421-RG516b
RG996-RZ142
RZ213-CDO1395a
1
3
6
2
1
1
12
1
3
5
11
2
1
1
3
10
1
10
3
6
–0.60
–0.48
–0.39
0.44
–0.12
–0.44
–0.10
–4.84
0.76
–2.03
2.33
–2.67
–1.89
–1.49
–0.10
0.02
–2.24
–0.14
–2.16
–0.53
–0.31
0.28
–0.13
0.16
–0.26
0.14
0.32
1.22
–4.12
1.57
–1.40
0.38
0.42
0.75
–0.95
1.07
0.66
1.28
–1.55
2.85
2.54
3.47
2.16
2.93
2.86
11.55
3.43
10.71
3.30
2.48
2.19
3.26
25.31
16.03
2.49
2.54
20.16
2.82
3.38
2.31
7.2
9.3
5.8
7.2
7.0
27.4
8.3
25.0
10.0
6.1
6.2
7.9
51.2
34.9
6.9
8.7
41.3
7.2
9.3
7.3
SRLF3
RRF3
SSLF3
CSLF3
SRF3
a
SRL: Al-stressed root length (stressed); CRL: control root length;
RR: root ratio (Stressed/Control); SSL: stressed shoot length; CSL:
control shoot length; SRF: shoot ratio (Stressed/Control). F2 and F3
indicate the generation in which the phenotype was measured
b Individual QTLs are designated with ”Q” indicating QTLs with a
LOD>2.5; the abbreviation of the trait name and the chromosome
number, is followed by letter to accommodate situations when
more than one QTL affecting a trait is identified on the same chromosome. Possible QTLs with a LOD >2.0 are also reported
c
Additive effects of homozygotes are calculated as: (Omon-Chiembau)/2. A positive effect reflects greater growth of the Omon homozygote, and a negative additive effect reflects greater growth of
the Chiembau homozygote
d Dominance deviations are calculated as: Heterozygote –
[(Omon+Chiembau)/2]. A positive effect reflects growth of the
heterozygote that exceeds the midparent, and a negative effects reflects growth that is less than the midparent
1008
and the dominance deviation was about 9-times larger.
QAlSs3a showed a marked heterozygote disadvantage,
while QAlSs10a showed virtually no difference between
the homozygotes but a large heterozygote advantage,
possibly explaining some of the transgressive variation.
A full model containing the four QTLs explained 59.7%
of the phenotypic variance.
Shoot length ratio
QTL QAlS3a was identified on chromosome 3. A possible QTL, QAlS6a, was found on chromosome 6. Chiembau had the favorable alleles (longer shoot length) for
both, consistent with the difference between the parents.
However, the additive effect of the Chiembau allele for
QAlS6a was small, while the dominance deviation was
about 5-times larger, possibly explaining some of the
transgressive variation. A full model containing the two
QTLs explained 15.5% of the phenotypic variance.
Discussion
A total of nine different genomic regions on eight chromosomes have been implicated in the genetic control of
root and shoot growth under aluminum stress. By far the
greatest additive effects on aluminum tolerance were associated with the region near WG110 on chromosome 1,
in which the Chiembau allele was associated with higher
root length under stress, as reflected by the higher root
length ratio. The relatively large effect of this genomic
region on root length under Al stress was the only one
that could be discerned in the (stressed) un-replicated F2
plants. The region was also associated with differences
in shoot-length both in stressed and non-stressed conditions, so shoot length parameters alone could not be considered as indicative of stress tolerance.
A second genomic region near RG996 (chromosome
3) also showed consistent effects on aluminum tolerance;
however, the effects of this genomic region were complex. With regard to the root length ratio, the allele from
Omon (the less-tolerant parent) showed a slight advantage; however, the heterozygote showed much less tolerance than either homozygote. It is possible that this
could reflect a form of ‘hybrid breakdown’ rather than a
truly higher susceptibility of the heterozygote to aluminum. Although both Chiembau and Omon are of the
same rice subspecies (indica), the relatively high level of
DNA polymorphism (68% of DNA probes screened) between them suggests that they are quite divergent. By
contrast, with regard to shoot length ratio, the Chiembau
allele was favorable and there was some indication of
dominance but not overdominance. The difference in
gene action between the root length ratio and the shoot
length ratio may suggest that there are actually two different (closely linked) genes exerting these effects.
Three additional regions on chromosomes 2, 5 and 11
showed an association with the root length ratio, consid-
ered to be the most reliable measure of aluminum tolerance. In the case of chromosome 2, the same genomic region also was associated with a difference in the control
root length.
Measurement of the shoot length and the shoot length
ratio alone are considered misleading with regard to aluminum tolerance (see above). A possible QTL was found
on chromosome 6 that might affect the shoot length ratio
but not the root length ratio; however, it fell slightly below our (LOD 2.5) significance threshold. We report this
finding for the future reference of other researchers, in
case future studies should show stronger evidence implicating this genomic region in aluminum tolerance, or
should be of interest for the study of shoot growth for
other reasons.
Finally, two additional genomic regions on chromosomes 6 and 10 have been associated with differences
between Chiembau and Omon that do not appear to be
related to aluminum tolerance. The chromosome-6 region affected only the root length of the control treatment, and the chromosome-10 region affected the shoot
length of both the control and stressed treatments to similar degrees. Again, we report these QTLs for the benefit
of others who may need this information for studies that
are not directly related to aluminum tolerance.
We find aluminum tolerance in this population to be
predominantly determined by one gene of relatively
large effect (by the standards of QTL mapping), but to be
modified by several genes of smaller effect. This is reasonably consistent with available data regarding the inheritance of aluminum tolerance in rice; analysis of variance of a 7×7 diallel for relative root length by Khatiwada et al. (1996) showed that high relative root length is
governed by both additive and dominance effects with a
preponderance of additive effects. Another diallel of 56
F1 progenies derived from 8 male×7 female rice parents
with differential Al tolerance suggested inconsistent
dominance effects (Wu et al. 1997).
However, as is true for the mechanisms of aluminum
tolerance, its inheritance in other crops remains controversial. In maize, Al tolerance has been shown by some
authors to be inherited as a complex trait (Magnavaca et
al. 1987; Lima et al. 1992), while others have asserted
that it is a single major gene (Moon et al. 1997; Rhue et
al. 1978). In wheat, rye and triticale, Aniol and Gustafson (1984) associated chromosome arms 6AL, 7AS,
2DL, 3DL, 4DL 4BL and 7D with Al tolerance in ‘Chinese Spring’, and major genes for tolerance in rye seem
to be located on 3R and 6RS, with other genes on 4R.
Aniol (1990) showed that Al resistance was linked to at
least three different chromosome arms: the short arm of
chromosome 5A and the long arms of chromosomes 2D
and 4D, the latter two being consistent with earlier data
(Takagi et al. 1983). Gallego and Benito (1997) and
Gallego et al. (1998) show that Al tolerance in rye is
controlled by at least two independent and dominant loci
(Alt1 and Alt3) located on chromosomes 6RS and 4R.
Others have found Al tolerance in the Triticeae to be
monogenic (Delhaize et al. 1993), with the predominant
1009
locus on the long arm of chromosome 4D (Luo and
Dvorak 1996), and linked to diagnostic RFLP markers
(Riede and Anderson 1996). Johnson et al. (1997) indicated a single dominant gene was transferred from Atlas
66 to Hard Winter Wheat. In dicots, three to five genes
may control Al tolerance in an F4-derived population
from soybean PI 416937, (Bianchi-Hall et al. 1998), and
several single recessive mutations conferring Al sensitivity have been identified in Arabidopsis thaliana (Larsen
et al. 1996).
Further confusing the picture, there seems to be little
correspondence in the location of aluminum tolerance
genes within or between taxa. In addition to the diversity
of genes cited from other sources (above), the major
gene we report near WG110 does not correspond to most
of the genes that have been mapped for aluminum tolerance in other species. WG110, a wheat genomic probe,
maps to wheat homoeologous group 3L ( a location that is not associated with aluminum
tolerance in any of the wheat studies (above).
The great diversity of results both from physiological
studies and from molecular mapping studies, support the
notion that aluminum tolerance is a complex multigenic
trait, and that there may exist many different tolerance or
resistance mechanisms. The identification of DNA markers (such as WG110) that are diagnostic of aluminum
tolerance in particular gene pools provide an important
starting point for transferring and pyramiding genes that
may help to improve productivity in aluminum-rich acid
soils. To gain a good understanding of the molecular basis of aluminum tolerance, it appears necessary to isolate
genes responsible for several different mechanisms of
aluminum tolerance; diagnostic DNA markers represent
a first step toward this goal.
Acknowledgements We thank the Rockefeller Foundation for
providing a dissertation fellowship for V.T. Nguyen to study in the
lab of A.H. Paterson, as well as Texas A & M, Texas Tech University, and the University of Georgia for supporting this research.
References
Alam SN, Cohen MB (1998) Detection and analysis of QTLs for
resistance to the brown planthopper, Nilaparvata lugens, in
a doubled-haploid rice population. Theor Appl Genet 97:
1370–1395
Aniol A (1990) Genetics of aluminum tolerance in wheat (Triticum aestivum L. Thell). Plant Soil 123:223–227
Aniol A, Gustafson JP (1984) Chomosome location of genes controlling aluminum tolerance in wheat, rye, and tricale. Can J
Genet Cytol 26:701–705
Armiger HW, Foy CD, Fleming AL, Caldwell BE (1968) Differential tolerance of soybean varieties to an acid soil high in exchangeable aluminum. Agron J 59:415–418
Bianchi-Hall CM, Carter ET Jr, Rufty TW, Arellano C, Boerma
HR, Ashley DA (1998) Heritability and resource allocation of
aluminum tolerance derived from soybean PI 416937. Crop
Sci 38:513–522
Bushamuka NV, Zobel RW (1998) Maize and soybean tap, basal,
and lateral root responses to a stratified acid, aluminum toxic
soil. Crop Sci 38:416–421
Campbell TA, Jackson PR, Xia ZL (1994) Effect of aluminum
stress on alfalfa root proteins. J Plant Nutr 17:471–1994
Causse MA, Fulton TM, Cho YG, Ahn SN, Chunwongse J, Wu K,
Xiao J, Yu Z, Ronald PC, Harrington SE, Second G, McCouch
SR, Tanksley SD (1994) Saturated molecular map of the rice
genome based on an interspecific backcross population. Genetics 138:1251–1274
Chittenden LM, Schertz KF, Lin Y, Wing RA, Paterson AH (1994)
RFLP mapping of a cross between Sorghum bicolor and S.
propinquum, suitable for high-density mapping, suggests ancestral duplication of Sorghum chromosomes. Theor Appl
Genet 87:925–33
Delhaize E, Ryan PR (1995) Aluminum toxicity and tolerance in
plants. Plant Physiol 107:315–321
Delhaize E, Ryan PR, Randall PJ (1993b) Aluminum tolerance in
wheat (Triticum aestivum L.). Aluminum stimulated excretion
of malic acid from root apices. Plant Physiol 103:695–702
FAO (1991) The Production yearbook. FAO, Rome, Italy
Fageria NY, Wright RJ, Baligar VC (1988) Rice cultivar response
to aluminum in nutrient solution. Commun Soil Sci Plant Anal
19:1133–1142
Foy CD (1974) Effect of aluminum on plant growth. In: Carson
EW (ed) The plant root and its environment. University Press
of Virginia, Charlottesville, Virginia, pp 601–642
Foy CD (1982a) Effect of nutrient deficiencies and toxicities in
plants: acid soil toxicity. Manuscript for handbook of nutrition
and food. CRC Press, Boca Raton, Florida
Foy CD (1982b) Effects of soil acidity on plants. Invited contribution to an EPA ”Acidic Deposition Critical Assessment Document” prepared under a cooperative agreement between EPA
and North Carolina State University, Raleigh, North Carolina
(available from author)
Foy CD (1983) The physiology of plant adaptation to mineral
stress. Iowa State J Res 57:355–391
Foy CD, Chaney RL, White MC (1978) The physiology of metal
toxicity in plants. Annu Rev Plant Physiol 29:511–566
Gallego FJ, Benito C (1997) Genetic control of aluminum tolerance in rye (Secale cereale L.) Theor Appl Genet 95:393–
399
Gallego FJ, Calles B, Benito C (1998) Molecular markers linked
to the aluminium tolerance gene Alt1 in rye. Theor Appl Genet
97:1104–1109
Gassmann W, Schrocder JI (1994) Inward-rectifying K+ channels
in root hairs of wheat. A mechanism for aluminum- sensitive
low affinity K+ uptake. Plant Physiol 105:1399–1408
Howeler RH, Cadavid LF (1976) Screening of rice cultivars for
tolerance to Al-toxicity in nutrient solutions as compared with
a field screening method. Agronomy J 68:551–555
Huang JW, Pellet DM, Papernik LA, Kochian LV (1993) Aluminum interactions with voltage-dependent calcium transport in
plasma membrane vesicles isolated from roots of aluminumsensitive and tolerant wheat cultivars. Plant Physiol 102:85–
93
Johnson JP, Carver BF, Baligar VC (1997) Expression of aluminum tolerance transferred from Atlas 66 to hard winter wheat.
Crop Sci 37:103–108
Khatiwada SP, Senadhira D, Carpena AL, Zeigler RS, Fernandez
PG (1996) Variability and genetics of tolerance for aluminum
toxicity in rice (Oryza sativa L.). Theor Appl Genet 93:
738–744
Kochian LV (1995) Cellular mechanisms of aluminum toxicity
and resistance in plants. Annu Rev Plant Physiol Plant Mol
Biol 46:237–260
Kosambi DD (1994) The estimation of map distances from recombination values. Ann Eugen 12:172–175
Lander ES, Botstein D (1989) Mapping Mendelian factor underlying quantitative traits using RFLP linkage maps. Genetics 121:
185–199
Lander ES, Green P, Abrahamson J, Barlow A, Daly MJ, Lincoln
SE, Newburg L (1987) MAPMAKER: an interactive computer
package for constructing primary genetic linkage maps of experimental and natural populations. Genomics 1:174–181
1010
Larsen PB, Tai CY, Kochian LV, Howell SH (1996) Arabidopsis
mutants with increased sensitivity to aluminum. Plant Physiol
110:743–751
Li Z, Pinson SRM, Stansel JW, Park WD (1995) Identification of
quantitative trait loci (QTLs) for heading date and plant height
in cultivated rice (Oryza sativa L.). Theor Appl Genet 91:
374–381
Lima M, Furlani PR, Miranda JB (1992) Divergent selection for
aluminum tolerance in a maize (Zea mays L.) population.
Maydica 37:123–132
Lincoln SE, Daly MJ, Lander ES (1992) Mapping genes controlling quantitative traits with MAPMAKER/QTL 1.1. Whitehead Institute Tech Rep, 2nd edn. Cambridge, Massachusetts
Luo MC, Dvorak J (1996) Molecular mapping of an aluminum
toerance locus on chromosome 4D of Chinese Spring Wheat.
Euphytica 91:31–35
Magnavaca R, Gardiner CO, Clark RB (1987) Inheritance of aluminum tolerance in maize. In: Gabelman HW, Loughman BC
(eds) Genetic aspects of plant mineral nutrition. Nijhoff,
Dordrecht, The Netherlands, pp 201–212
Massot N, Poschenrieder C, Barcelo J (1992) Differential response
of three bean (Phaseolus vulgaris) cultivars to aluminum. Acta
Bot Neerl 41:293–298
Matsumoto H (1991) Biochemical mechanism of the toxicity of
aluminum and the sequestration of aluminium in the plant cell.
In: Wright RJ, Baligar VC, Murrmenn RP (eds) Plant-soil interaction at low pH. Kluwer Academic, Dordrecht, The Netherlands, pp 825–838
McCouch SR, Tanksley SD (1991) Development and use of restriction fragment length polymorphism in rice breeding and
genetics. In: Khush GS, Toenniessen GH (eds) Rice Biotechnology, CAB Int. Wallingford, UK, pp 83–107
Moon DH, Ottoboni LMM, Souza AP, Sibov ST, Gaspar M,
Arruda P (1997) Somaclonal-variation-induced aluminum-sensitive mutant from an aluminum-inbred maize tolerant line.
Plant Cell Rep 16:686–691
Morimura S, Taakahashi E, Matsumoto H (1978) Association of
aluminum with nucleic and inhibition of cell division in onion
(Allium opa) roots. Z Pflanzenernahr Bodenk 88:395–401
Naidoo G, Steward JMcD, Lewis RJ (1978) Accumulation sites of
Al in smapbean and cotton roots. Agron J 70:489–492
Pan WL, Hopkin AG, Jackson WA (1989) Aluminum inhibition of
shoot lateral branches of Glycine max and reversal by exogenous cytokinin. Plant Soil 120:1–9
Paterson AH, Lander ES, Hewitt JD, Peterson S, Lincoln SE,
Tanksley SD (1988) Resolution of quantitative traits into Mendelian factors by using a complete linkage map of restriction
fragment length polymorphisms. Nature 335:721–726
Rangel Z (1992a) Role of calcium in aluminum toxicity. New
Phytol 121:499–513
Rengel Z (1992b) Disturbance of cell Ca2+ homeostasis as a primary trigger of the Al toxicity syndrome. Plant Cell Environ
15:931–938
Rhue RD, Grogan CO, Stockmeyer EW, Everett HL (1978) Genetic
control of aluminum tolerance in corn. Crop Sci 18:1063–1067
Riede CR, Anderson JA (1996) Linkage of RFLP markers to an
aluminum tolerance gene in wheat. Crop Sci 36:905–909
Ryan P, Shadd JE, Kochian LV (1992) Aluminum toxicity in root:
correlation among ionic current, ion fluxes, and root elongation in aluminum-sensitive and aluminum-tolerant wheat cultivars. Plant Physiol 99:1193–1200
Ryan P, Di Tomaso J, Kochian LV (1993) Aluminum toxicity in
roots: an investigation of spatial sensitivity and role of the root
cap. J Exp Bot 44:437–446
Sanchez PA, Salinas JG (1981) Low-input technology for managing oxisols and ultisols in tropical America. Adv Agron 34:
279–406
SAS Institute (1987) SAS/STAT guide for personal computer, version 6. SAS Institute, Cary, Norh Carolina
Sivaguru M, Paliwal K (1993) Differential aluminum tolerance on
some tropical rice cultivars. I. Growth performance. J Plant
Nutr 16:1705–1716
Sivaguru M, James MR, Anbudurai PR, Balakumar T (1992)
Characterization of differential aluminum tolerance among
rice genotypes cutivated in South India. J Plant Nutr 15:
233–246
Sousa CNA de (1998) Classification of Brazilian wheat cultivars
for aluminum toxicity in acid soils. Plant Breed 117:217–221
Taylor GJ (1988a) The physiology of aluminum phytotoxicity. In:
Sigel H (ed) Metal ions in biogical systems. Aluminum and its
role in Biology, vol 24. Marcel Dekker, New York, pp
123–163
Taylor GJ (1991) Current views of the aluminum stress response:
the physiological basis of tolerance. Curr Top Plant Biochem
Physiol 10:57–93
Urrea-Gomez R, Ceballos H, Pandey S, Antonio FC, Filho B,
Leon LA (1996) A greenhouse screening technique for acid
soil tolerance in maize. Agron J 88:806–812
Wallace SU, Anderson IC (1984) Aluminum toxicity and DNA
synthesis in wheat roots. Agron J 76:5–8
Wu P, Zhao B, Yan J, Luo A, Wu Y, Senadihra D (1997) Genetic
control of seedling tolerance to aluminum toxicity in rice. Euphytica 97:289–293
Yoshida S, Forno DA, Cock JA, Gomez KA (1976) Laboratory
manual for physiological studies of rice, 3rd edn. International
Rice Research Institute. Los Banos, The Phillippines
Zhao XJ, Sucoff E, Stadelmann EJ (1987) Al3+ and Ca2+ alteration
of membrane permeability of Quercus rubra root cortex cells.
Plant Physiol 83:159–162