Development and performance evaluation of cup-chain type metering mechanism for Gladiolus corms in the soil bin
Bạn đang xem bản rút gọn của tài liệu. Xem và tải ngay bản đầy đủ của tài liệu tại đây (471.94 KB, 10 trang )
Int.J.Curr.Microbiol.App.Sci (2019) 8(8): 2813-2822
International Journal of Current Microbiology and Applied Sciences
ISSN: 2319-7706 Volume 8 Number 08 (2019)
Journal homepage:
Original Research Article
/>
Development and Performance Evaluation of Cup-Chain type Metering
Mechanism for Gladiolus corms in the Soil Bin
T. M. Ananda Kumar* and T. P. Singh
Department of FMPE, College of Technology, GBPUA&T, Pantnagar, Uttarakhand, India
*Corresponding author
ABSTRACT
Keywords
Planter, Gladiolus,
Metering device
and cup-chain
Article Info
Accepted:
22 July 2019
Available Online:
10 August 2019
Gladiolus is a very popular flowering plant grown for its elegant cut spike. Presently, the
Gladiolus corms are planted manually which is time and labour intensive process. It also
involves considerable amount of drudgery. Till date very little work on mechanized
planting of corms has been reported. In order to carry out the panting operation in specific
time and to mechanize this operation for Gladiolus crop, a cup-chain type metering
mechanism was developed and its performance was evaluated in linear soil bin. The
experiment was conducted for three levels of nominal spacings (15, 20 and 25 cm) and
four levels of forward speeds (1.5, 2.0, 2.5 and 3.0 km/h). The performance parameters
namely, mean spacing, multiple index, missing index, quality feed index, coefficient of
uniformity, precision, coefficient of precision (CP3), visible damage and number of corms
per meter length were determined. The data was statistically analyzed using two factorial
completely randomized design (CRD).The results indicated that the metering mechanism
was able to drop the corms at desired nominal spacing at forward speed of 1.5 km/h with
100 % quality feed index. The precision was found less than 10 % for all the three nominal
spacings and four forward speeds. The overall performance of metering mechanism was
found better for 25 cm nominal spacing at forward speeds of 1.5 and 2.0 km/h.
Introduction
Floriculture is a fast emerging venture in the
world, especially as a potential money-spinner
for many third world countries. Many flowers
and ornamental plants are being grown for
domestic as well as for export market that
provide more return per unit area than any
other food grain crops. The government sets
its focus on floriculture sector with the hope of
robust growth in the future to help boost and
stabilize the country's economy as well as
increase the opportunities for the employment.
Nowadays, growing of cut flower crops
suitable for flower arrangements/decorations,
bouquets preparation and floral baskets has
increased substantially and so its share in the
total trade. Gladiolus is high value ornamental
flowering crop, which is mainly grown for its
elegant cut spike. It is the second most popular
commercial cut flower next to rose but ranks
first, both in area and production as well as
return per unit area, among the bulbous crop
grown in the country. The total area under
Gladiolus cultivation in the country during
2016-17 was 11660 ha with a production of
2813
Int.J.Curr.Microbiol.App.Sci (2019) 8(8): 2813-2822
50700 MT as loose flowers and 92.89 lakh (in
numbers) as cut flowers (Anonymous, 201617).
Manual planting of Gladiolus corms is a time
and labour-intensive operation. Besides of
large number of labour requirement, it also
involves considerable drudgery and human
discomfort. Shortage of agricultural labor and
increased wages delays the planting operation
and also makes it uneconomical. Therefore, in
order to reduce farmer’s dependency on
manual labor for planting of this crop, there is
need to develop a suitable planter with
efficient metering mechanism. Till date very
little work has been reported on this aspect.
Rad (2006) developed and evaluated a two
row planter for saffron corms that was able to
plant the corms at a row spacing of 22 cm with
planting depth of 15 cm without damaging the
corms. The cup chain type metering
mechanism was used in the planter. Singh and
Singh (2017) developed single row planter for
gladiolus corms. The wooden cup on chain
type mechanism was used in the planter. The
planter was able to perform satisfactorily at
forward speed of 1.5 to 2.0 km/h. planter for
gladiolus corms and the performance was
evaluated in field condition. The planter In
view of the above, the present study was under
taken to develop
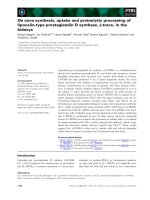
spacing between sups was kept 100 mm.
Chain was fitted on two sprockets i.e. upper
and lower sprockets with 18 and 11 number of
teeth. Both the sprockets have been fitted on a
MS shaft of 25 mm in diameter. This cup
chain system was finally mounted on a
rectangular frame. The frame was made to
support the hopper, metering unit and delivery
pipe. The overall dimensions of frame was
1100 x 250 x 250 mm (Length x width x
breadth) in size. The frame was fabricated
from MS angle of size 35 x 3 mm. The hopper
was fabricated in trapezoidal shape from MS
sheet of 2 mm thickness. The wall inclination
of the hopper was kept 45° from the vertical
for easy flow of the corms towards the bottom
of the hopper. The power to metering
mechanism was provided through ground
wheel of size 320 mm diameter with different
gear ratios to maintain the nominal spacings.
Working principle of metering device
The metering device received power from
ground wheel with a suitable chain and
sprocket system. The cups fixed on chain
pick-ups the corms from hopper as the chain
moves from bottom to top of metering device
and drop the corms into delivery pipe. The
corms will fall into furrow safely through
delivery pipe.
Materials and Methods
Performance evaluation
A cup chain type metering mechanism was
developed and evaluated in linear soil bin for
Gladiolus corms. The metering mechanism
consisted of cups, chain, hopper, shafts with
ball bearings, main frame and delivery pipe.
The schematic diagram of cup chain type
metering mechanism is shown in Fig. 1.
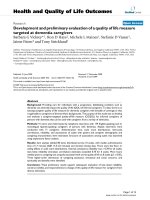
The performance evaluation of metering
mechanism was conducted in the linear soil
bin available in the department of Farm
Machinery and Power Engineering, College of
Technology GBPUA&T Pantnagar (Fig 2).
The experiment was conducted at four levels
of forward speeds (1.5, 2.0, 2.5 and 3.0 km/h)
and three levels of nominal spacings (15, 20
and 25 cm).The performance indexes viz.mean
spacing, multiple index, missing index, quality
of feed index, coefficient of uniformity,
precision, coefficient of precision, visible
Thirteen numbers of circular cups of size 45
mm in diameter (equivalent to mean diameter
of Gladiolus corms) with 25 mm depth was
fitted on 130 cm long roller type chain. The
2814
Int.J.Curr.Microbiol.App.Sci (2019) 8(8): 2813-2822
corm damage and number of corms dropped
per meter length were determined. The data
were analyzed statistically using two factorial
completely randomized design (CRD).
spacing of the corm is considered as miss
index (MISS). The miss index was calculated
using following relationship as suggested by
Yazgi and Degirmencioglu, 2014.
Soil bin
Missing Index, %
A rectangular soil bin of length, width and
height of 25, 1.2 and 1 m was used to test the
metering mechanism under controlled
condition. The soil bin is made of reinforced
cement concrete and on both the side 0.228 x
0.228 m bricks posts are provided over which
two side rails of 1 x 0.5 m of channel sections
are mounted along the length of bin (Fig. 2).
The side rails are used to facilitate the linear
movement of a trolley which has provisions
for changing the forward speeds. The trolley
can be moved both forward and backward
with the help of an electric motor (3 phase, 10
hp and 1440 rpm). The soil bin is filled with
locally available silty clay loam soil, for
conducting the experiment up to a depth of 0.6
m. The moving trolley of soil bin has facility
for soil preparation and leveling of the same.
The corm to corm spacing was measured with
the help of measuring tape for each test run
(Singh and Singh, 2017). Three replications
were taken for combination of experiment and
thereafter the mean spacing was calculated by
the following relationship.
N
i 1
Where, n1= Number of spacings ≥ 1.5 times
the nominal spacing, N= Total number of
measured spacings
Multiple index (MULTI)
The corm to corm spacing observed equal or
less than 0.5 times the nominal spacing of the
cormis considered as multiple indexes
(MULTI). The multiple index was determined
using following relationship as suggested by
Yazgi and Degirmencioglu, 2014.
MultipleIndex, %
n2
100
N
… (3)
Where, n2= number of spacing ≤ 0.5 times the
nominal spacing, N = Total number of
measured spacing.
Mean spacing
X
n1
100
N
… (2)
X1
N … (1)
Quality feed index (QFI)
The quality feed index is the percentage of
spacings that are greater than half but not
greater than 1.5 times the nominal spacing
spacing.
Jinqing et al., 2016 suggested the following
equation to determine the quality feed index.
Where, X = Mean spacing, cm, Xi = distance
between the ith corm and next corm, cm
N = total number of spacings measured
Miss index (MISS)
The corm to corm spacing observed either
equal or greater than 1.5 times the nominal
Quality of feed Index, %
n3
100
N
… (4)
Where, n3 = Number of corms spacing that are
>0.5 times and <1.5 times the nominal
spacing, N = Total number of measured
spacing.
2815
Int.J.Curr.Microbiol.App.Sci (2019) 8(8): 2813-2822
variability due to both multiples and skips
(Bracy and Parish, 1999).
Coefficient of Uniformity (CU)
In order to determine the evenness of corm
placement in row by the metering device, the
average value of observed corm spacing was
determined and then coefficient of uniformity
was calculated using the following equation.
(X - X)
100
Coefficien t of uniformity (C u ) 1
NX
…
Where,
S2 = Standard deviation of the n3 observations
i.e. spacing between 0.5 to 1.5 times the
nominal spacing, Xref = nominal spacing, cm
(5)
Cu= Coefficient of uniformity, %, X = sum of
absolute value, cm, X = Nominal spacing,
cm, N = Number of observation
Coefficient of precision (CP3)
It is defined as percentage of corms spacing
that fall within ±1.5 cm of nominal spacing. It
is also known as 3 cm mode range. Brinkmann
et al., (1980) proposed the use of a new
parameter called coefficient of precision
(CP3) for comparison of seed spacing.
This parameter was proposed to be a better
representation of the ability of a precision
planter to place seeds closer to the actual
required spacing than using the combination
of average spacing and standard deviation.
The mean values of the coefficient of
precision were calculated using the following
equation.
CP3
PREC =S2 /Xref … (7)
Nb
100
Tb
… (6)
Visible damage
The percentage of visible damage caused by
metering device was calculated by observing
the physical damage to the corms after passing
through the metering mechanism. The corms
dropped in the furrow were collected and
observed for any physical damage and the data
related to the same was recorded. The
percentage of visible corm damage was
calculated using the following relationship.
Visible damage, %
Number of damaged corms in 15 m test run
100
Total number of corms droppedin 15 m test run
… (8)
Number of corms per meter length (NCPM)
One meter long strip was selected randomly
from the test run and the number of corms
dropped within this was counted. The
procedure was replicated three times to obtain
the average number of corms per meter length
(Yasir et al., 2012).
Results and Discussion
Mean spacing
Where, CP3 = Coefficient of precision, %, Nb
= Number of corms dropped within ±1.5 cm
range from nominal spacing, Tb = Total
number of corms dropped
Precision
Precision (PREC) is a measure of the
variability in spacing after accounting for
The observed corm spacing was measured
during the test for all the three nominal
spacings at four levels of forward speeds. The
result (Table 1) showed that the observed
spacing was quite close to the desired nominal
spacing of the corms. The ratio of mean to
nominal spacing was found to increase with
the increase in level of forward speed. The
2816
Int.J.Curr.Microbiol.App.Sci (2019) 8(8): 2813-2822
value of the same was also found to decrease
with increase in nominal spacing. This is may
be due to improper functioning of metering
device at higher levels of forward speeds. At
higher levels of forward speeds the time
available for cell fill could be less as
compared to time available at lower level of
forward speeds resulting into missing. On an
average the value of ratio of mean to nominal
spacing was found close to one at forward
speeds of 1.5, 2.0 and 2.5 km/h which
indicated that the observed corm spacing was
very close to the desired nominal spacing. The
results of standard deviation and coefficient of
variation did not show any trend with the
change in forward speed and nominal spacing.
Miss Index (MISS)
The values of MISS for all the three levels of
nominal spacings and four levels of forward
speed were determined which indicated no
missing of the corms at forward speed of 1.5
km/h for all the three levels of nominal
spacings. The miss index was observed to
range between zero and 4.24 % at forward
speed of 2.0 and 3.0 km/h for nominal spacing
of 25 and 15 cm respectively. This indicated
that the miss index increased with increase in
forward speed and decreased with increase in
nominal spacing. This may be due to higher
speed operation of metering mechanism at
resulting into lesser time availability for
picking up of corm from the hopper. The same
reason could be for higher missing at lower
value of nominal spacing. The data was
analyzed and the same was found statistically
significant at 1 % level of significance for
various levels of forward speed and nominal
spacings (Table 3).
Multiple Index (MULTI)
The mean values of MULTI for all the levels
of nominal spacings and forward speeds were
found zero (Table 2). This indicates that
metering device did not drop the corms at
spacing less than 0.5 times the nominal
spacing.
Quality Feed Index (QFI)
The mean values of QFI were determined for
all three nominal spacings and four levels of
forward speed (Table 2). The result indicated
higher quality feed index at forward speed of
1.5 km/h for all the three nominal spacings.
The acceptable limit of QFI has been
suggested ≥90 % (Kachman and Smith, 1995)
for laboratory condition. The QFI values
obtained during the experiment were found
higher than the suggested values for all the
levels of forward speed and nominal spacing.
It was also observed that QFI was higher for
lower level of forward speed and higher level
of nominal spacing.
The reason for this may be due to lower MISS
values and no MULTI resulted in higher
percent of QFI. Similar results were observed
by Singh and Gautam (2015) for Gladiolus
corms in field condition. Forward speed and
nominal spacing was found have significant
effect on QFI at p<0.01 and p<0.05
respectively (Table 3)
Coefficient of Uniformity (CU)
The coefficient of uniformity shows the
evenness of corms delivered by metering
device. The maximum and minimum values of
CU were observed as 97.68 and 87.7 % at
forward speed of 1.5 and 2.0 km/h for the
nominal spacing of 25 and 15 cm respectively
(Table 2). The results indicated that CU
increased with increase in nominal spacing
and decreased with increase in forward speed.
The reason for this may be due to the fact that
the cups of metering device got sufficient time
for self-filling of corms at lower level of
forward speed and for wider nominal spacing
resulting in higher percent of CU. The
2817
Int.J.Curr.Microbiol.App.Sci (2019) 8(8): 2813-2822
statistical analysis indicated significant effect
of speed of operation and nominal spacing on
coefficient of uniformity at 1 % level of
significance (Table 3).
Table.1 Observed mean spacing of corms during test in soil bin
Nominal
spacing,
cm
15 cm
20 cm
25 cm
Forward
Mean
speed,
spacing,
km/h
cm
1.50
15.30
2.00
15.60
2.50
16.10
3.00
16.60
Mean
16.15
1.50
20.20
2.00
20.50
2.50
21.10
3.00
21.50
Mean
20.95
1.50
25.27
2.00
25.80
2.50
25.85
3.00
26.39
Mean
25.32
Ratio of
mean/nominal
spacing
1.02
1.04
1.07
1.11
1.07
1.01
1.03
1.06
1.08
1.05
1.01
1.03
1.03
1.06
1.01
SD, cm
CV %
0.26
0.62
0.96
1.15
0.74
0.85
1.42
1.3
1.49
1.26
1.11
2.00
1.05
0.96
1.28
1.7
4.00
5.96
6.92
4.64
4.13
6.92
6.16
6.95
6.04
4.38
7.74
4.23
3.79
5.03
Table.2 Results of Performance indices
Nominal Forward
spacing,
speed,
cm
km/h
1.5
15
2.0
2.5
3.0
Mean
1.5
20
2.0
2.5
3.0
Mean
1.5
25
2.0
2.5
3.0
Mean
MISS,
%
0.00
1.96
3.57
4.24
2.44
0.00
0.35
2.20
4.10
1.66
0.00
0.00
2.20
3.20
1.35
Performance parameters
MULTI, QFI,
CU, PREC,
%
%
%
%
0.00
100.00 93.20
5.10
0.00
98.04 90.10
6.10
0.00
96.43 88.10
7.12
0.00
95.76 87.70
8.10
0.00
97.56 89.78
6.61
0.00
100.00 96.54
4.60
0.00
99.65 94.60
5.80
0.00
97.80 92.12
7.50
0.00
95.90 90.12
7.50
0.00
98.34 93.35
6.35
0.00
100.00 97.68
5.60
0.00
100.00 96.54
5.50
0.00
97.80 95.32
7.10
0.00
96.80 91.23
7.90
0.00
98.65 95.19
6.53
2818
CP3,
%
81.89
76.66
73.14
65.87
74.39
79.38
75.90
70.13
64.00
72.35
79.09
74.33
68.23
63.68
71.33
Int.J.Curr.Microbiol.App.Sci (2019) 8(8): 2813-2822
Table.3 Statistical analysis of results (p-values)
MISS
QFI
CU
**
**
0.0001
0.0001
0.0001**
Forward Speed (S)
0.0001**
0.02*
0.0001**
Nominal Spacing (W)
0.0039**
0.4854NS 0.361 NS
Interaction (SxW)
**
Significant at 1 % level of significance (p<0.01)
*
Significant at 5% level of significance (p<0.05)
NS
Non significance (p>0.05)
PREC
0.0001**
0.714 NS
0.656 NS
Fig.1 Schematic diagram of cup-chain type metering mechanism
2819
CP3
0.0001**
0.0001**
0.486 NS
Int.J.Curr.Microbiol.App.Sci (2019) 8(8): 2813-2822
Fig.2 Evaluation of metering device in soil bin
Fig.3 Relationship between visible corm damage and forward speed
2820
Int.J.Curr.Microbiol.App.Sci (2019) 8(8): 2813-2822
Fig.4 Number of corms per meter length
Precision (PREC)
The mean value of PREC was observed to
range between 4.6 to 8.1 percent (Table 2).
The minimum value of PREC was observed at
lower level of forward speed for all the three
nominal spacings whereas it was found
maximum at higher level of forward speeds.
This may be due to fact that the standard
deviation of observed spacing found high at
higher levels of forward speed resulting
higher precision. The precision value of less
than 10 %is desirable for laboratory condition
for better performance of precision planter as
suggested by Kachman and Smith (1995). The
result obtained indicated PREC value less
than 10% for all the levels of forward speed
and nominal spacing. Statistical analysis
shows that forward speed highly affects the
precision at 1 % level of significance whereas
the nominal spacing and interaction of these
two parameters didnot show any effect on
precision (Table 3).
Coefficient of Precision (CP3)
The CP3 value is related with the percentage
of corms dropped by metering device within
±1.5 cm of nominal spacing. The maximum
and minimum values of CP3 were observed as
81.89 and 63.68 % at forward speed of 1.5
and 3.0 km/h for nominal spacing of 15 and
25 cm respectively (Table 2). The result
indicated higher value of CP3 for 15 cm of
nominal spacing at forward speed of 1.5 km/h
whereas it was observed minimum at higher
forward speed of 3.0 km/h and wider nominal
spacing (25 cm).Higher CP3 values are
desirable for better performance of metering
device as suggested by Panning et al., 2000.
The results indicted better performance of
metering device at 1.5 km/h forward speed for
15 cm nominal spacing. Results of statistical
analysis showed that CP3values varied
significantly at 1% level of significance for all
the levels of forward speed and nominal
spacing. However, the interaction terms were
not found significant (Table 3).
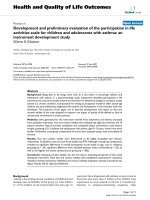
Visible corm damage
Visible corm damage was observed during the
experiment for all the three required nominal
spacings at forward speed of 1.5, 2.0, 2.5 and
3.0 km/h and is depicted in Fig. 2 which
indicated no corm damage at forward speed of
1.5 and 2.0 km/h for all the three nominal
spacings. The maximum damage of corms
(2.4%) was observed at higher forward speed
(3.0 km/h) and lower level of nominal spacing
2821
Int.J.Curr.Microbiol.App.Sci (2019) 8(8): 2813-2822
(15 cm). The reason for this may be due to the
stucking of corms occasionally between chain
and collecting hopper. However, the visible
corm damage was found within the acceptable
limits of ≤0.5% (IS9856).
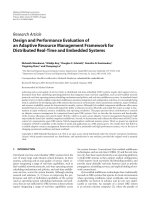
Number of corms per meter
Fig. 3 indicated the relationship between
number of corms per meter length observed at
various forward speeds and nominal spacings.
The desired number of corms per meter length
for 15, 20 and 25 cm nominal spacing was
determined 6, 5 and 4 respectively. The
required number of corms was observed at
lower speeds of 1.5 and 2.0 km/h for all three
nominal spacings. However, it was observed
less with increase in speed of operation
beyond 2.5 km/h which is due to higher
values of MISS. It can be seen from the
results that the performance of metering
device found better at forward speeds of 1.5
and 2.0 km/h.
Based on the results of experiment, it could be
concluded that the developed cup-chain type
metering device should be operated at
forward speed between 1.5 to 2.0 km/h for its
satisfactory performance. At the mentioned
speed QFI was observed 100 % with no corm
damage for all the three nominal spacings.
References
Anonymous, 2016-17. National Horticulture
Board. Ministry of Agriculture and Farmers
welfare, Govt. of India
Bracy, R. P. and Parish, R. L. 1999.Seeding
uniformity
of
precision
seeders.
Horticulture. Techno. 8(2): 182-185.
Brinkmann, W., Flake, E. and Gehlen, A. 1980.
Test:
Einzelkornsaegeraete
fur
Zuckerruben,
Die
Landtechnishe
Zeitschrift, Heft 3/80: 1-8.
IS 9856:1999 Indian Standard Test code for
Potato Planter.
Jinqing, L., Ying, Y., Zihui, L., Qinqin, S.,
Jicheng, L. and Zhongyuan L. 2016. Design
and experiment of an air suction potato seed
metering device. Int. J. Agric. & Biol. Eng.
9(5):33-42.
Kachman, S. D. and Smith, J. A. 1995.
Alternative measures of accuracy in plant
spacing for planters using single seed
metering. Transactions of ASAE. 38:379387.
Kadvekar, S. (2018) Comparative performance of
seed metering mechanisms for finger millet
and barnyard millet. Thesis, M.Tech,
GBPUA&T, Pantnagar, Uttarakhand, India.
Panning, J. W., Kocher, M. F., Smith, J. A. and
Kachman, S. D. 2000. Laboratory and field
testing of seed spacing uniformity for
sugarbeet planters. Applied Eng. In Agric.
16(1):7-13.
Rad, M., 2006. Design and development of a tworaw saffron bulb planter. AMA, 37(2):48.
Singh, P. and Singh, T. P. 2017. Performance
evaluation of cell in belt type metering
device for planting of gladiolus corms.Int.
J. of Agric. Eng. 10(1):159-167.
Yasir, S. H., Liao, Q., Yu, J. and He, D. 2012.
Design and test of a pneumatic precision
metering device for wheat.Agric. Eng. Int.
CIGR J. 14(1):16-25.
Yazgi, A. and Degirmencioglu, A., 2014.
Measurement of seed spacing uniformity
performance of a precision metering unit as
function of the number of holes on vacuum
plate. Measurement, 56: 128-135.
How to cite this article:
Ananda Kumar T. M. and Singh T. P. 2019. Development and Performance Evaluation of CupChain type Metering Mechanism for Gladiolus corms in the Soil Bin.
Int.J.Curr.Microbiol.App.Sci. 8(08): 2813-2822. doi: />
2822