Effect of a single high dose vitamin A supplementation on the hemoglobin status of children aged 6–59 months: Propensity score matched retrospective cohort study based on the data of
Bạn đang xem bản rút gọn của tài liệu. Xem và tải ngay bản đầy đủ của tài liệu tại đây (471.99 KB, 8 trang )
Gebremedhin BMC Pediatrics 2014, 14:79
/>
RESEARCH ARTICLE
Open Access
Effect of a single high dose vitamin A
supplementation on the hemoglobin status of
children aged 6–59 months: propensity score
matched retrospective cohort study based on the
data of Ethiopian Demographic and Health
Survey 2011
Samson Gebremedhin
Abstract
Background: Vitamin A deficiency can cause anemia as the nutrient is essential for hematopoiesis, mobilization of
iron store and immunity. Nevertheless, clinical trials endeavored to evaluate the effect of Vitamin A Supplementation
(VAS) on hemoglobin concluded inconsistently. Accordingly, the objective of the current study is to assess the effect of
single high dose VAS on the hemoglobin status of children aged 6–59 months.
Methods: The study was conducted based on the data of Ethiopian Demographic Health Survey 2011. The data from
2397 children aged 6–59 months who received a single dose of 30 or 60 mg of VAS (depending on age) in the
preceding 6 months were matched with similar number children who did not receive the supplement in the reference
period. The matching was based on propensity scores generated from potential confounders. Distributions of
hemoglobin concentration and risks of anemia were compared between the groups using paired t-test, matched
Relative Risk (RR) and standardized mean difference.
Result: The supplemented and non-supplemented groups were homogeneous in pertinent socio-demographic
variables. Compared to propensity score matched non-supplemented children, those who received vitamin A
had a 1.50 (95% CI: 0.30-2.70) g/l higher hemoglobin concentration (P = 0.014). In the supplemented and
non-supplemented groups, the prevalences of anemia were 46.4% and 53.9%, respectively. VAS was associated
with a 9% reduction in the risk of anemia (RR = 0.91 (95% CI: 0.86-0.96)). Stratified analysis based on household
wealth status indicated that the association between VAS and hemoglobin status was restricted to children from
the poor households (RR = 0.74 (95% CI: 0.61-0.90)). Effect size estimates among all children (Cohen’s d = 0.07)
and children from poor households (d = 2.0) were modest.
Conclusion: Single high dose VAS among Ethiopian children 6–59 months of age was associated with a modest
increase in hemoglobin and decrease in risk of anemia. Household wealth status may modify the apparent
association between VAS and hemoglobin status.
Keywords: Vitamin A supplementation, Anemia, Hemoglobin
Correspondence:
School of Public and Environmental Health, Hawassa University, Hawassa,
Ethiopia
© 2014 Gebremedhin; licensee BioMed Central Ltd. This is an Open Access article distributed under the terms of the Creative
Commons Attribution License ( which permits unrestricted use, distribution, and
reproduction in any medium, provided the original work is properly credited.
Gebremedhin BMC Pediatrics 2014, 14:79
/>
Background
Anemia is a global public health problem affecting both
developing and developed countries. It poses serious
consequences for human health including increased risk
of maternal and child mortality [1]. According to World
Health Organization (WHO), anemia affects 24.8% of
the world population and the burden is substantially
high among preschool-aged children (47.4%), pregnant
women (41.8%) and women of reproductive age (30.2%)
[1]. In 2002 Iron Deficiency Anemia (IDA) was identified
as one of the major contributing factors to the global
burden of disease [2].
Over years several studies documented the public health
significance of anemia in Ethiopia. The recent Ethiopia
Demographic and Health Survey (EDHS) 2011 reported
44.2%, 22.0% and 16.6% prevalence of anemia among
preschool-aged children, pregnant women and nonpregnant women, respectively [3]. The previous EDHS
2005 also reported relatively higher (53.5%, 30.6% and
26.6%) prevalences in the aforementioned three population groups, consecutively [4].
Several factors, both nutritional and non-nutritional,
are known to contribute to the onset of anemia. However, nutritional anemia is the most widespread type.
Especially IDA is estimated to contribute to approximately 50% of the global burden of anemia – though the
proportion may vary according to local situations. Other
micronutrient deficiencies including folate, vitamin B-12,
vitamin C, Vitamin A (VA), zinc and cooper are also
linked with anemia [1,5].
The relationship between Vitamin A Deficiency (VAD)
and anemia has been known for many decades now [6].
So far various pathophysiological mechanisms had been
postulated. Vitamin A appears to enhance hematopoiesis
and mobilization of iron store possibly through increasing circulating erythropoietin [6,7]. VA could also prevent anemia associated with infection via its immu
ne-modulatory effect [6]. Vitamin A deficiency might
also alter absorption and storage of iron [5].
Several observational studies witnessed significant association between hemoglobin and various VA status indicators [6]. Reasonable number of Randomized Controlled
Trials (RCTs) based on daily or weekly VA Supplementation (VAS) have also concluded likewise [8-12]. However,
RCTs based on single high dose VAS concluded equivocally. Studies in Thailand [13], Indonesia [14] and Morocco
[7] reported positive effects; whereas, those in Peru [15]
and Thailand [16] found no association.
In settings where VAD is a public health problem, the
WHO recommends for routine and high dose VAS every
4–6 months for children 6–59 months [17]. This is based
on the knowledge that a single, large dose of VA is well
absorbed in the liver and can be mobilized over an
extended period of time as required. The recently revised
Page 2 of 8
WHO guideline emphasizes on the significance of VAS
for the reduction of childhood mortality, xerophthalmia
and nutritional blindness [17]. The systematic review
by Cochrane collaboration also concluded that VAS reduces all-cause childhood mortality by 24% [18].
Accordingly the current study, based on the data of
EDHS 2011, was carried out in order to evaluate the effect
of routine high dose VAS on hemoglobin status of children aged 6–59 months. The aforementioned dataset was
selected, considering the fact that the prevalences of VAD
and anemia are known to be high in Ethiopia [3,4,19] and
the country is also implementing large scale semi-annual
VAS for children aged 6–59 months.
Methods
Study design
The current study – a retrospective cohort by design – is
a secondary data analysis of the Ethiopia Demographic
and health survey (EDHS) carried out in 2011. Children
aged 6–59 months who received and did not receive VAS
in the preceding 6 months of the survey were identified
and matched using propensity score matching technique.
Ultimately mean hemoglobin concentration and anemia
status determined at the time of the survey were compared between the two study groups.
Study setting
Ethiopia is among the least developing countries in the
world with Gross Domestic Product (GDP) per capita of
1,200 USD [20]. Of approximately 80 million Ethiopians,
84% live in rural areas where access to social services is
limited [21]. The country’s economy is dependent on
agriculture and 29.2% of the population lives below the
poverty-line [20]. Despite the recent improvements in
health indicators, infant and under five mortality rates
(50 and 88 deaths per 1,000 live births, respectively)
remain high and the life expectancy at birth does not
exceed 57 years [3,20]. Malnutrition remains a major
problem as 44%, 29% and 10% of the preschool-aged
children are stunted, underweight and wasted, respectively [3]. Widespread poverty, food insecurity and limited access to social services have contributed to the
high burden of ill-health in the country [20].
Parallel to the recommendation of WHO, Ethiopia
implements routine VAS for children 6–59 months.
According to the national guideline, children aged 6–11
and 12–59 months are given 100,000 and 200,000 international units of VA (i.e. 30 and 60 mg of retinol), respectively, on semi-annual basis [22]. Usually VA capsules are
distributed through Enhanced Outreach Strategy/Community Health Days (EOS/CHD) campaigns. Other services provided during the campaign include deworming
of children 24–59 months and nutritional screening of
children 6–59 months. VAS is also conducted during
Gebremedhin BMC Pediatrics 2014, 14:79
/>
Page 3 of 8
routine vaccination and sick child visit of health institutions. According to DHS 2011 the coverage of VAS in the
aforementioned age group in the country was 53.1%.
Sampling design
The EDHS 2011 applied two stage cluster sampling technique. Enumeration Area (EA) — a cluster that conventionally encompasses 150–200 adjacent households — was
the first stage sampling unit. The original survey included
624 EAs, 187 in urban and 437 in rural areas. Ahead of
the survey, a complete listing of households was carried
out in each of the EAs and eventually 17,817 households
were randomly selected [3].
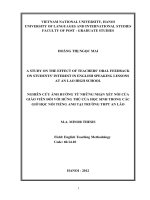
For the current analysis, the data of 9,276 children
aged 6–59 were available. However, for various reasons
the data of only 4,794 children were used for the analysis. Reasons for exclusion were; lack of information
about the VAS status or hemoglobin concentration of
the children, missing values for the variables needed to
generate propensity score and unable to find appropriate
matches (Figure 1). Children included and excluded from
the study were not significantly different in terms of basic
socio-demographic variables include age, sex, place of residence (urban/rural), wealth index and parents’ educational
status (P > 0.05).
Power calculation
Power to detect a difference in the prevalence of anemia
was computed based on the available number supplemented and non-supplemented children in the dataset
and the prevalences of anemia found in the two groups.
The computation was made using the online calculator
called StatsToDo which is designed for matched study
design [23]. The inputs of the calculation were: 95%
confidence level; 2,397 pairs of supplemented and nonsupplemented subjects; 46.7% and 53.9% prevalences of
anemia in supplemented and non-supplemented children;
and one-to-one ratio between the two study groups. Eventually the power was computed as 79.8% and it was judged
to be optimal.
Data collection
The EDHS 2011 data were collected from December
2010 to June 2011 using trained and experienced data
collectors. The survey used standard MEASURE DHS
questionnaire adapted to the Ethiopian context. The
questionnaire was finalized in English and translated to
three major local languages. Prior to the fieldwork, the
tools were pretested and all necessary modifications
were made [3].
Exposure and outcome ascertainments
During the survey VAS status of the children was determined by showing their mothers/primary caregivers a
Figure 1 Flowchart of the study.
VA capsule and enquiring whether their children had
been given a similar one in the preceding 6 months [3].
Hemoglobin concentration was determined via portable
HemoCue analyzer using a drop of capillary blood and
the concentration was adjusted for altitude according
to the recommendation of Centers for Disease Prevention and Control (CDC) [24]. The cutoff points applied
to define anemia were: mild (100–109 g/l), moderate
(70–99 g/l) and severe (< 70 g/l).
Matching of VA supplemented and non-supplemented
children
The propensity score is the conditional probability of
assignment to a particular treatment given a vector of
observed covariates [25]. Propensity score matching refers to the pairing of treatment and control units with
similar values on the propensity score. It is an important
tool for causal inference in retrospective cohort and
quasi-experimental studies in which random assignment
of treatments is impossible and asymmetry of treatment
groups is likely. Propensity score matching avoids selection bias associated with covariates used to predict the
score [26].
In the current analysis propensity scores were generated
via binary logistic regression model that compute the
Gebremedhin BMC Pediatrics 2014, 14:79
/>
probability of receiving high dose VA, as a function of
eleven factors/covariates. The factors/covariates were
wealth index, parents’ educational status, place of residence (urban or rural), age of the child, sex of the child,
number of preschool age children in the household,
household’s usual source of drinking water (improved
or unimproved), household’s excreta disposal method
(improved or unimproved), vaccination status of the
child, and deworming treatment of the child within
6 months of the survey. Child illness related variables
were not considered in generating the propensity scores
as they are potential mediator factors between VAS and
hemoglobin status.
Eventually, every VA supplemented child was matched
with a non-supplemented one using a variant of propensity score matching method called Caliper matching
(i.e. matching to a control with the nearest propensity
score that is within a predefined width). The caliper
width was set as 0.2 of the Standard Deviation (SD) of
the logit of the propensity score [27]. Ultimately 2,397
VA supplemented and 2,397 non-supplemented children were matched.
Data management and analysis
The dataset was downloaded from Measure DHS website and cleaned using SPSS 20.0 software. The data
were subsequently exported to Stata SE 11 for analysis.
Mean hemoglobin concentrations in supplemented and
non-supplemented children were compared using paired
t-test. The association between VAS status and anemia
was determined via McNemar’s Chi-square and matched
Relative Risk (RR). Both were generated using the Stata
MCC command modified for matched cohort design [28].
Statistical significance was set at P value of 0.05. Effect
Size (ES) calculation was made using the standardized
mean difference method. Prior to analysis the assumptions
of McNemar’s Chi-square and t-tests had been checked.
In order to assess the effectiveness of the propensity
score matching, the comparability of the two treatment
groups on the variables used to generate the propensity
score was checked using paired t- or McNemar’s Chisquare- tests. Further, the similarity of the groups based
on other selected variables including dietary diversity score,
meal frequency and breastfeeding was assessed. Dietary
diversity score was calculated according to the recommendation of the WHO [29].
Wealth index was computed as a composite indicator
of living standard based on 18 variables related to ownership of selected household assets, size of agricultural
land, quantity of livestock and materials used for housing construction. The computation was made using
principal component analysis. Initially the analysis
generated six principal components and a single continuous variable was generated by summing up the
Page 4 of 8
principal components into one. Tertiles of wealth
index (poor, middle and rich) were generated using the
composite score.
Ethical consideration
The dataset was accessed after securing permission from
Measure DHS organization. During the survey, the data
were collected in confirmation of national and international
ethical guidelines. Ethical clearance for the survey was provided by the Ethiopian Health and Nutrition Research Institute (EHNRI) review board, the National Research Ethics
Review Committee (NRERC) at the Ministry of Science
and Technology, the Institutional Review Board of ICF
International, and the CDC [3].
Results
Background characteristics of the study subjects
A total of 2,397 pairs of VA supplemented and nonsupplemented children were included in the analysis. In
order to evaluate the overall effectiveness of the propensity
score matching, the basic characteristics of the two groups
were compared using paired t- or McNemar’s Chi-squaretests. The mean (±SD) propensity score was virtually identical for the two groups (0.50 ± 0.17 for both).
The mean (±SD) age of the children in supplemented
and non-supplemented groups were 31.6 (±15.3) and
31.7 (±15.9) months (P = 0.718). The boys to girls ratios
were 1.03 and 1.02, consecutively, (P = 0.974). Likewise,
the study groups were comparable with respect to socioeconomic status indicators including parents’ educational status, place of residence, household wealth index
and household size (P > 0.05). Access to improved water
source and sanitary facility, proportion of children who
completed vaccination, and proportion of children who
received deworming tablets in the preceding 6 months
of the survey, were also similar. Further, among children
aged 6–23 months, proportion who were breastfeeding
during the survey and mean food frequency and dietary
diversity score in the preceding day of the study were
comparable (P > 0.05) (Table 1).
Vitamin A supplementation and anemia
The mean (±SD) hemoglobin levels in supplemented
and non-supplemented children were 107.5 (±17.9)
and 106.0 (±23.8) g/l, respectively, reflecting a significant mean difference of 1.50 (95% CI: 0.30-2.70) g/l in
favor of the supplemented group (t = 2.471, P = 0.014)
(Table 2).
Amongst supplemented children, the prevalence of
anemia was 46.4% (95% CI: 44.4-48.4%). About 20.3%,
22.1% and 3.2% had mild, moderate and severe anemia,
respectively. Alternatively, among non-supplemented children, the prevalence of any form of anemia was 53.9%
(95% CI: 51.9-55.9%) and 3.9%, 27.8% and 3.9% had mild,
Gebremedhin BMC Pediatrics 2014, 14:79
/>
Page 5 of 8
Table 1 Comparison of the characteristics of vitamin A supplemented and non-supplemented children aged
6–59 months, Ethiopia, 2010
Variables
VAS status
Test statistic and
P values for paired t
or McNemar’s test
Supplemented
(n = 2,397)
Non-supplemented
(n = 2,397)
31.6 (±15.3)
31.7 (±15.9)
t = 0.36, P = 0.718
Proportion of female children (%)
49.4
49.4
χ2 = 0.00, P = 0.974
Proportion of mothers who had any formal education (%)
30.1
28.0
χ2 = 3.79, P = 0.056
Mean child age in months (mean (±SD))
Proportion of fathers who had any formal education (%)
47.0
46.6
χ2 = 0.08, P = 0.799
Proportion of urban residents (%)
14.0
14.5
χ2 = 0.29, P = 0.629
−0.36 (±0.07)
−0.36 (±0.07)
t = 0.29, P = 0.770
Proportion of households with improved water source (%)
51.1
51.4
χ2 = 1.11, P = 0.317
Proportion of households with improved sanitary facility (%)
11.1
10.9
χ2 = 0.09, P = 0.806
Proportion of children who received deworming tablet within 6 months (%)
9.6
9.3
χ2 = 3.27, P = 0.119
6.18 (±2.32)
6.18 (±2.33)
t = 0.06, P = 0.995
64.2
64.5
χ2 = 1.26, P = 0.337
Mean wealth index score (mean (±SD))
Household size (mean (±SD))
Proportion of children 12–59 months who completed vaccination (%)♦
Proportion of children 6–23 months who were breastfeeding during the survey*
Dietary diversity score among children 6–23 months (mean (±SD))*
*
Mean feeding frequency among children 6–23 months (mean (±SD))
91.7
89.7
χ2 = 0.47, P = 0.492
1.29 (±1.07)
1.21 (±1.07)
t = 0.84, P = 0.401
1.78 (±1.67)
1.73 (±1.60)
t = 0.43, P = 0.662
♦n = 1,573 pairs of children.
*
n = 898 pairs of children.
moderate and severe anemia, respectively. In the VA supplemented group, the risk of anemia was significantly
reduced, represented by a RR of 0.91 (95% CI: 0.86-0.96)
(Table 3).
Effect modification by household wealth status
The association between VAS and anemia was independently computed across the three wealth strata
(poor, middle and rich). The analysis indicated that the
significant association was only restricted in the ‘poor’
household wealth stratum (RR = 0.74 (95% CI: 0.610.90)). In contrast, the association was marginal in the
middle (P = 0.059) and insignificant in the rich wealth
strata (P = 0.630) (Table 4).
Likewise the mean hemoglobin differences between
matched supplemented and non-supplemented children
in the poor, middle and rich wealth categories were 5.4
(±26.8), 3.1 (±25.8) and 0.3 (±23.7) g/l, respectively.
Table 2 Mean hemoglobin concentration in vitamin A
supplemented and non-supplemented children aged
6–59 months, Ethiopia 2010
Mean hemoglobin concentration (g/l)
Evaluation of the practical significance of VAS in the
prevention of anemia
In the evaluation of the effect of an intervention on an
outcome, along with statistical level of significance, it’s
important to appraise its practical significance using
effect size estimates. This is particularly important in
studies involving large sample sizes as they are likely to
detect statistically significant difference even in the presence of trivial treatment effect.
In the current study, the effect sizes computed based
on standardized mean differences (Cohen’s d) among
Table 3 Pattern of anemia among 2397 paired vitamin A
supplemented and non-supplemented children aged
6–59 months, Ethiopia, 2010
Supplemented
Mean (±SD)
All children (n = 4794)
106.7 (±21.1)
VA supplemented children (n = 2397)
107.5 (±17.9)
VA non-supplemented children (n = 2397)
106.0 (±23.8)
Paired mean difference (supplemented - non
supplemented) (n = 2397)
Pared t-test analysis was significant only in the poor
tertile (P = 0.000). Comparison of the three mean differences using one way ANOVA showed statistically
significant global difference (P = 0.039) and Tukey’s posthoc test detected significant difference between poor and
rich tertiles (Table 5).
1.5 (±21.1)
Non-supplemented
Normal
Anemic
Total
Matched RR = 0.91 (95% CI: 0.86-0.96).
McNemar’s χ2 = 10.51, P = 0.001.
Total
Normal
Anemic
558
541
1099
653
645
1298
1211
1186
2397
Gebremedhin BMC Pediatrics 2014, 14:79
/>
Page 6 of 8
Table 4 The association between VAS and anemia among children aged 6–59 months across three household wealth
strata, Ethiopia, 2010
Number of matched children♦
RR (95% CI) in VA supplemented group
McNemar’s χ2 test
Poor
331
0.74 (0.61-0.90)*
χ2 = 9.48, P = 0.002*
Middle
311
0.86 (0.74-1.00)
χ2 = 3.55, P = 0.059
Rich
329
0.96 (0.82-1.12)
χ2 = 0.32, P = 0.630
Wealth tertiles
♦
Number of matched children both selected from the respective wealth category.
*Statistically significant.
all children and children from poor households were of
0.07 and 0.20, respectively. As compared to the cutoff
points recommended by J Cohen [30], the effect size
estimates were modest.
Discussion
In the current study a relatively small but statistically significant hemoglobin increase of 1.5 g/l was observed in VA
supplemented group. The increment is minimal as compared to results from three previous RCTs that had used
daily or weekly VAS. The RCTs conducted in Tanzania
(1.5 mg VA for 3 days a week for 3 months) [8], Belize
(1.0 mg per week for 6 months) [9] and Guatemala (3.0 mg
VA daily for 2 months) [10] reported statistically significant
9.9, 8.0 and 6.1 and g/l hemoglobin increments in VA supplemented children, respectively. Compared to the effects
reported from these RCTs, the small treatment effect estimated from the current study might be due to variation
in type of VAS regimen (i.e. daily, weekly or semi-annual
supplementation). Though no study so far compared the
effectiveness of various VAS regimens, few studies on other
micronutrients documented better physiological responses
in more frequent supplementation regimens [31-33].
Clinical trials based on high dose VA supplementation
in children have generated mixed findings with respect
to the impact on hemoglobin. In Peru [15] and Thailand
[16] 30 mg and 60 mg VAS respectively, did not yield
significant hemoglobin improvements. Another study in
Thailand [13] witnessed a significant but relatively slim
3 g/l increment following administration of single 60 mg
VA supplement. In Indonesia, 60 mg VAS did not show
significant effect among clinically normal children but
significantly increased the hemoglobin concentration
by 7 g/l among anemic children [14]. In Morocco, two
60 mg VA supplementations given 5 months apart
increased hemoglobin by 6 g/l [7]. The findings of the
current study along with the aforementioned trials may
indicate that high dose VAS has less remarkable effect on
blood hemoglobin level than daily or weekly regimens.
In the current study, the relatively weak association
observed between VAS and hemoglobin/anemia can also
be due to sub-optimal dietary iron intake of the study subjects. As VA is assumed to increase hemoglobin level principally through facilitating hematopoisis and mobilization
of iron store [5,6], VAS in the absence of optimal iron status might not illustrate pronounced effect on hemoglobin
concentration. According to EDHS 2011, among children
aged 6–23 months only 13.3% consumed iron rich foods
in the preceding day of the survey and among children
6–59 months only 6.0% had any form of iron supplementation in the previous one week of the survey [3].
The stratified analysis based on household wealth status indicated that the significant association between
VAS and anemia was only restricted to children from
the poor households. The strength of association between
the two variables uniformly reduced across the three
wealth strata — poor (RR = 0.74), middle (RR = 0.86)
and rich (RR = 0.96). This might be due to the reason
that children from the poor families would have less
access to VA rich foods hence they tend to benefit more
from the supplementation. Conversely among children
from households of higher socio-economic means, the
protective effect of VAS would be minimal as they may
already been adequate in the baseline VA status. So far
no trial examined the modifying effects of household
economic status on responses to micronutrient supplementation among children. But a study among pregnant
women in China reported that in women from the poorest tertile of the socio-economic status, micronutrient
supplementation significantly reduced risk of low
Table 5 Mean hemoglobin difference between matched vitamin A supplemented and non-supplemented children aged
6–59 months across three household wealth strata, Ethiopia, 2010
Wealth tertiles
Mean (±SD) hemoglobin paired difference• (g/l)
Poor
5.4 (±26.8)
Paired t statistic and p value
*
t = 3.64, P = 0.000
Middle
3.1 (±25.8)
t = 1.66, P = 0.979
Rich
0.3 (±23.7)
t = 0.26, P = 0.796
•
Supplemented minus non-supplemented.
*Statistically significant.
**Used as a measure of heterogeneity of effects.
One Way ANOVA**
F = 3.24, P = 0.039*
Gebremedhin BMC Pediatrics 2014, 14:79
/>
birthweight and early neonatal mortality rate; however,
similar effects had not been seen among women from
the wealthier households [34].
In Ethiopia, VAS is usually given to children along with
other services like vaccination and mass-deworming. These
services can also have independent positive effect on
hemoglobin and could potentially confound the association between VAS and anemia. However, in the current
study the confounding effect might not be a serious concern as both of the variables had been used to generate
the propensity score for matching.
Some limitations need to be considered while interpreting the findings of the study. Primarily the ascertainment of the VAS status was entirely based on mothers’
recall. This makes the study liable to recall and misclassification bias and it can result in under- or overestimation the actual strength of association. Though
the study used propensity score matching to balance VA
supplemented and non-supplemented groups based on
selected covariates, still confounding can happen due to
lack of comparability in other unmeasured characteristics.
Further, presumably there is some delay between VAS and
its effect on hemoglobin. However, in the current study
the association was measured regardless of the time gap
between the supplementation and hemoglobin determination, consequently this can result in under estimation of
the association. The large number of subjects excluded
from the study due to lack of appropriate matches can also
be considered as a drawback of the propensity score
matching method. In general, as the study is observational,
the strength of the evidence might not be up to the level
of RCTs.
Conclusion
Single high dose VAS among Ethiopian children 6–
59 months of age was associated with a modest increase in hemoglobin and decrease in risk of anemia.
Household wealth status may modify the apparent association between VAS and hemoglobin status.
Competing interests
The author declares that he has no competing interests.
Authors’ contributions
SG exclusively conducted the data analysis and write-up of the manuscript.
Authors’ information
SG is currently working as an assistant professor of public health at School of
Public and Environmental Health, Hawassa University, Ethiopia.
Acknowledgements
The author acknowledges Measure DHS for granting access to the data.
Received: 16 May 2013 Accepted: 18 March 2014
Published: 21 March 2014
Page 7 of 8
References
1. De Benoist B, McLean E, Egli I, Cogswell M (Eds): Worldwide Prevalence of
Anemia 1993–2005: WHO Global Database on Anemia. Geneva: WHO Press;
2008.
2. World Health Organization: The World Health Report 2002: Reducing Risks,
Promoting Healthy Life. Geneva; 2002.
3. Central Statistical Agency of Ethiopia, Measure DHS: Ethiopia Demographic
and Health Survey 2011. Addis Ababa and Calverton; 2012.
4. ORC Macro, Central Statistical Agency of Ethiopia: Ethiopia Demographic and
Health Survey 2005. Addis Ababa and Calverton; 2006.
5. Kraemer K, Zimmermann MB (Eds): Nutritional Anemia. Basel: Sight and Life
Press; 2007.
6. Semba RD, Bloem MW: The anemia of vitamin A deficiency: epidemiology
and pathogenesis. Eur J Clin Nutr 2002, 56:271–281.
7. Zimmermann MB, Biebinger R, Rohner F, Dib A, Zeder C, Hurrell RF, Chaouki
N: Vitamin A supplementation in children with poor vitamin A and iron
status increases erythropoietin and hemoglobin concentrations without
changing total body iron. Am J Clin Nutr 2006, 84:580–586.
8. Mwanri L, Worsley A, Ryan P, Masika J: Supplemental vitamin A improves
anemia and growth in anemic school children in Tanzania. J Nutr 2000,
130:2691–2696.
9. Smith JC, Makdani D, Hegar A, Rao D, Douglass LW: Vitamin A and Zinc
supplementation of preschool children. J Am Coll Nutr 1999, 18(3):213–222.
10. Mejia LA, Chew F: Hematological effect of supplementing anemic
children with vitamin A alone and in combination with iron. Am J Clin
Nutr 1988, 48:595–600.
11. Muhilal, Permeisih D, Idjradinata YR, Muherdiyantiningsih, Karyadi D: Vitamin
A-fortified monosodium glutamate and health, growth, and survival of
children: a controlled field trial. Am J Clin Nutr 1988, 48:1271–1276.
12. Garg A, Abrol P, Tewari AD, Sen R, Lal H: Effect of vitamin A
supplementation on hematopoiesis in children with anemia. Indian J Clin
Biochem 2005, 20(1):85–86.
13. Bloem MW, Wedel M, Van-Agtmaal EJ, Speek AJ, Saowakontha S, Schreu HP:
Vitamin A intervention: short-term effects of a single, oral, massive dose
on iron metabolism. Am J Clin Nutr 1990, 51:76–79.
14. Sembaa RD, Muhilal, West KP, Wingeta M, Natadisastra G, Scotta A, Sommer
A: Impact of vitamin A supplementation on hematological indicators of iron
metabolism and protein status in children. Nutr Res 1992, 12(4):469–478.
15. Alarcon K, Kolsteren PW, Prada AM, Chian AM, Velarde RE, Pecho IL,
Hoeree TF: Effects of separate delivery of zinc or zinc and vitamin A on
hemoglobin response, growth, and diarrhea in young Peruvian children
receiving iron therapy for anemia. Am J Clin Nutr 2004, 80:1276–1282.
16. Bloem MW, Wedel M, Egger RJ, Speek AJ, Schrzjver J, Saowakontha S,
Schreurs WH: Iron metabolism and vitamin A deficiency in children in
Northeast Thailand. Am J Clin Nutr 1989, 50:332–338.
17. World Health Organization: Vitamin A Supplementation in Infants and
Children 6–59 Months of Age. Geneva; 2011.
18. Imdad A, Herzer K, Mayo-Wilson E, Yakoob MY, Bhutta ZA: Vitamin A
supplementation for preventing morbidity and mortality in children
from 6 months to 5 years of age. Cochrane Database Syst Rev 2010,
12. doi:10.1002/14651858.
19. Demissie T, Ali A, Mekonen Y, Haider J, Umeta M: Magnitude and
distribution of vitamin A deficiency in Ethiopia. Food Nutr Bull 2010,
31(2):234–241.
20. Central Intelligence Agency: The world fact book: Ethiopia. [https://www.
cia.gov/library/publications/the-world-factbook/geos/et.html] (18).
21. Population Census Commission of Federal Democratic Republic of Ethiopia:
Summary and Statistical Report of the 2007 Population and Housing Census of
Ethiopia: Population Size by Age and Sex. Addis Ababa; 2008.
22. Federal Ministry of Health of Ethiopia: Ethiopian national guidelines for
control and prevention of micronutrient deficiencies. [http://www.
aedlinkagesethiopia.org/My_Homepage_Files/Download/Micronutrients%
20guideline.pdf]
23. StatsToDo: sample size for matched pair control trials program. [http://
www.statstodo.com/SSizMatchedPair_Pgm.php]
24. Nestel P: Adjusting Hemoglobin Values in Program Surveys. Washington DC:
The International Nutritional Anemia Consultative Group; 2002.
25. Rosenbaum PR, Rubin DB: The central role of the propensity score in
observational studies for causal effects. Biometrilca 1983, 70(1):41–55.
26. Stuar EA: Matching methods for causal inference: a review and a look
forward. Stat Sci 2010, 25(1):1–21.
Gebremedhin BMC Pediatrics 2014, 14:79
/>
Page 8 of 8
27. Austin PC: Optimal caliper widths for propensity-score matching when
estimating differences in means and differences in proportions in
observational studies. Pharmaceut Statist 2010. doi:10.1002/pst.433.
28. Cummings P, McKnight B: Analysis of matched cohort data. Stata J 2004,
4(3):274–281.
29. World Health Organization, United Nations Children's Fund, UNICEF:
Indicators for Assessing Infant and Young Child Feeding Practices. Geneva;
2008.
30. Cohen J: Statistical Power Analysis for the Behavioral Sciences. 2nd edition.
Hillsdale: Erlbaum; 1988.
31. Desai MR, Dhar R, Rosen DH, Kariuki SK, Shi YP, Kager PA, Ter Kuile FO: Daily
iron supplementation is more efficacious than twice weekly iron
supplementation for the treatment of childhood anemia in western
Kenya. J Nutr 2004, 134(5):1167–1174.
32. Azeredo CM, Cotta RM, Sant’Ana LF, Franceschini Sdo C, Ribeiro Rde C,
Lamounier JA, Pedron FA: Greater effectiveness of daily iron supplementation
scheme in infants. Rev Saude Publica 2010, 44(2):230–239.
33. Chel V, Wijnhoven HA, Smit JH, Ooms M, Lips P: Efficacy of different doses
and time intervals of oral vitamin D supplementation with or without
calcium in elderly nursing home residents. Osteoporos Int 2008,
19(5):663–671.
34. Zeng L, Yan H, Cheng Y, Dibley MJ: Modifying effects of wealth on the
response to nutrient supplementation in pregnancy on birth weight,
duration of gestation and perinatal mortality in rural western China:
double-blind cluster randomized controlled trial. Int J Epidemiol 2011,
40:350–362.
doi:10.1186/1471-2431-14-79
Cite this article as: Gebremedhin: Effect of a single high dose vitamin A
supplementation on the hemoglobin status of children aged 6–
59 months: propensity score matched retrospective cohort study based
on the data of Ethiopian Demographic and Health Survey 2011. BMC
Pediatrics 2014 14:79.
Submit your next manuscript to BioMed Central
and take full advantage of:
• Convenient online submission
• Thorough peer review
• No space constraints or color figure charges
• Immediate publication on acceptance
• Inclusion in PubMed, CAS, Scopus and Google Scholar
• Research which is freely available for redistribution
Submit your manuscript at
www.biomedcentral.com/submit