Predictors of oedema among children hospitalized with severe acute malnutrition in Jimma University Hospital, Ethiopia: A cross sectional study
Bạn đang xem bản rút gọn của tài liệu. Xem và tải ngay bản đầy đủ của tài liệu tại đây (294.09 KB, 8 trang )
Girma et al. BMC Pediatrics 2013, 13:204
/>
RESEARCH ARTICLE
Open Access
Predictors of oedema among children
hospitalized with severe acute malnutrition in
Jimma University Hospital, Ethiopia: a cross
sectional study
Tsinuel Girma1*, Pernille Kæstel2, Christian Mølgaard2, Kim F Michaelsen2, Anne-Louise Hother2 and Henrik Friis2
Abstract
Background: Severe acute malnutrition has two main clinical manifestations, i.e., oedematous and
non-oedematous. However, factors associated with oedema are not well established.
Methods: Children 0.5-14 years of age with SAM (MUAC < 11.0 cm or weight-for-height < 70 % of median and/or
nutritional oedema) admitted to the nutrition unit were included. Information on infections before and during
admission was collected together with anthropometry. Predictors of oedema was analysed separately for younger
(< 60 months) and older children (≥ 60 months).
Results: 351 children were recruited (median age: 36 months (interquartile range 24 to 60); 43.3% females).
Oedema was detected in 61.1%. The prevalence of oedema increased with age, peaked at 37–59 months (75%) and
declined thereafter. Infection was more common in the younger group (33% vs. 8.9%, p < 0.001) and in this group
children with oedema had less infections (25.2% vs. 45.1%, p = 0.001). In the older group the prevalence of
infections was not different between oedematous and non-oedematous children (5.5% v. 14.3%, p = 0.17). In the
younger group oedema was less common in children with TB (OR = 0.20, 95% CI: 0.06, 0.70) or diarrhea (OR = 0.40,
95% CI: 0.21, 0.73).
Conclusions: The proportion of oedema in SAM peaked at three to five years of age and a considerable proportion
was above 5 years. Furthermore, the prevalence of infection seemed to be lower among children with oedema.
Further studies are needed to better understand the role of infection-immunity interaction.
Keywords: Severe acute malnutrition, Oedema, Infection, Risk, Predictors
Background
Millions of children living in low-income countries
suffer from undernutrition; undernutrition contributes
to one-third of the deaths in young children [1,2]. Severe acute malnutrition (SAM) affects an estimated 20
million children under 5 years of age [3]. Despite recent improvement in the protocols for treatment of
SAM, case-fatality rates of 20-30% are still seen and
are higher for oedematous malnutrition [4].
* Correspondence:
1
Department of Pediatrics and Child Health, Jimma University Specialized
Hospital, Jimma, Ethiopia
Full list of author information is available at the end of the article
There are two main clinical manifestations of SAM, i.e.
oedematous and non-oedematous [5]. However, which
factors lead to oedema and the mechanisms behind have
been discussed extensively, but remains unknown. In earlier works, oedema in severe malnutrition was explained
by dietary protein deficiency [6], and subsequently
free-radical-mediated cellular injury was suggested as a
mechanism [7]. Recently, researchers suggested a developmental origin, based on a finding in a retrospective observational study [8].
Studies of predictors of SAM are scarce but important
to understand the disease process. Existing published
works investigated risk factors for undernutrition in general, and mainly in children under the age of five years
© 2013 Girma et al.; licensee BioMed Central Ltd. This is an open access article distributed under the terms of the Creative
Commons Attribution License ( which permits unrestricted use, distribution, and
reproduction in any medium, provided the original work is properly cited.
Girma et al. BMC Pediatrics 2013, 13:204
/>
[9-13]. Large family size, poor maternal nutrition, poverty
and unhygienic environment were shown to be risk factors
in these studies. Regarding age and gender, however, the
results were conflicting.
The aim of this study, therefore, was to identify predictors of oedema among children hospitalized with SAM
in the Nutritional Rehabilitation Unit (NRU) of Jimma
University Specialized Hospital (JUSH), Ethiopia.
Methods
Study setting and subjects
JUSH is located in Jimma Zone in southwest Ethiopia. It
has a Paediatric Ward incorporating the NRU, and has
been implementing the WHO-based National Guideline
for Treatment of Severe Malnutrition [14] since 2004.
The NRU receives severely wasted or oedematous patients who have no associated severe acute illness such
as severe pneumonia, sepsis, or shock. Severely ill SAM
patients are first stabilized in the Critical Care Unit and
afterwards transferred to the NRU.
Eligibility for the study required severe wasting (MUAC
< 11.0 cm or weight-for-height < 70% of the median of the
NCHS growth reference) or nutritional oedema. Children
below 6 months of age, those who had life threatening illness, such as shock, and those readmitted with SAM were
excluded. Children below 6 months of age were excluded
as the diagnosis and treatment of SAM is still not well
standardized. Fourteen years was set as the upper age limit
since older children were not accepted at the paediatric
ward.
Data collection
Data on household’s water source and toilet facility
along with caretaker’s schooling and occupation were
obtained by interviewing caretakers, as were history of
fever, diarrhea, cough and measles, within one month
before admission to hospital. Age of the child was determined from caretakers’ recall. Children were measured
naked and body weight recorded to the nearest 10 g using
a paediatric scale (Tanita BD 815 MA, Tokyo, Japan).
Length was measured in recumbent position for children
less than 2 years of age or not able to stand.
Length was recorded to the nearest 0.1 cm using a
length board (SECA 416, Hamburg, Germany). When
length was measured instead of height in children older
than 2 years, 0.5 cm was subtracted from the length. For
children older than 2 years, height was measured using a
free-standing stadiometer and recoded to the nearest
0.1 cm. MUAC was recorded to the nearest 0.1 cm using
a strip (SECA 2012, Hamburg, Germany). Triceps and
sub-scapular skin fold thicknesses were measured in duplicates to the nearest 0.2 mm using a Harpenden calliper
(Baty International, West Sussex, UK). Presence of pitting
oedema was checked by applying a gentle pressure with
Page 2 of 8
the thumb for 3–5 seconds. It was registered as “0” if no
pitting was detected on the feet. In the presence of pitting,
it was recorded as “+” if detected on feet, “++” legs and
feet, and “+++” if it included the hands and face.
Infections diagnosed during the admission were taken
from the child’s clinical record. The diagnosis of tuberculosis (TB) was based on clinical and radiologic data, according to the Ethiopian National Guideline [15]. Features
indicative of TB were chronic symptoms or physical signs
suggestive of TB, history of exposure to adult with chronic
cough or with TB and suggestive X-rays. For TB suspected
children who were able to produce sputum, microscopic
sputum examination for acid fast bacilli was done. Tuberculin skin test was unavailable. For febrile patients coming
from a malarial area, malaria parasitaemia was examined
with Wright stained thick and thin blood films. Pneumonia was diagnosed when a patient had short duration of
cough (< 2 weeks) or respiratory difficulty, age-specific fast
breathing (above normal for age category), auscultatory
and/or chest x-ray findings. Diarrhea was defined as three
or more loose stools per day. The clinical case definition
for measles was a generalized maculopapular rash lasting
for ≥ 3 days, fever (≥ 38.3°C, if measured), and 1 of the following: cough, coryza, or conjunctivitis. Rapid antibody
tests were used to diagnose HIV.
Table 1 Characteristics and season of admission for
children admitted with severe acute malnutrition
Age < 5 yearsa Age ≥ 5 yearsa p-value
Female sex
n = 261
n = 90
105 (40.2)
47 (52.2)
Caretaker of child in hospital
0.05
< 0.001
Mother
151 (57.8)
30 (33.3)
Father
90 (34.5)
51 (56.7)
Relative
20 (7.7)
9 (10.0)
Caretaker’s occupation
0.03
Farmer
187 (71.6)
76 (83.5)
Employed
39 (15.0)
5 (5.5)
Otherb
35 (13.4)
9 (10.0)
Caretaker’s schooling
0.34
No schooling
170 (65.0)
63 (70.0)
Some schooling
91 (35.0)
27 (30.0)
Toilet facility
238 (91.5)
81 (90.0)
0.61
Safe water supplyc
158 (60.8)
49 (54.4)
0.34
Pre-harvest
129 (49.4)
55 (61.1)
Post-harvest
132 (50.6)
35 (38.9)
d
Admission per season
a
0.06
Values are median (25th; 75th percentile) or n (%).
b
Unemployed, studying or on pension.
c
Main source of drinking water for family is from pipe, protected spring
or well.
d
Pre-harvest (June -Nov) and post-harvest (Dec-May).
Girma et al. BMC Pediatrics 2013, 13:204
/>
Page 3 of 8
Table 2 Anthropometry, presence of oedema and illnesses among 351 children admitted with severe acute
malnutrition by age group
Age < 5 yearsa
Age ≥ 5 yearsa
n = 261
n = 90
p-value
Growth indicators
Weight, kg
8.1 (7.8,8.4)
14.1 (13.3,15.1)
Height, cm
77.6 (76.4,78.6)
105.7 (102.8,109.3)
BMI-for-age Z-score
−2.4 (−2.6,-2.2)
−2.6 (−3.1,-2.2)
0.31
MUAC, cm
11.1 (11.0,11.3)
12.0 (11.6,12.3)
< 0.001
Weight-for-age Z-score
−3.7 (−4.0,-3.5)
−3.5 (−3.8,-3.2)
0.27
Height-for-age Z-score
−3.4 (−3.5,-3.1)
−3.0 (−3.3,-2.7)
0.14
Weight-for-height Z-scoreb
−3.6 (1.3)
MUAC-for-age Z-scoreb
−4.0 (−4.1,-3.8)
159 (61.0)
55 (61.1)
0.87
172 (66.3)
61 (67.8)
Clinical
Bilateral pedal pitting oedema
HIV status
Negative
0.80
Positive
6 (2.3)
3 (3.3)
Unknown
82 (31.4)
26 (28.9)
Co-infection ( ≥ 1)c
86 (33.0)
8 (8.9)
< 0.001
Pneumonia
60 (23.0)
4 (4.4)
< 0.001
Diarrhea
58 (22.2)
3 (3.3)
< 0.001
Tuberculosis (all forms)
14 (5.4)
3 (3.3)
0.58
Malaria
8 (3.1)
1 (1.1)
0.46
237 (90.8)
81 (90.0)
0.55
Fever
182 (70.0)
69 (65.6)
0.48
Diarrhea
169 (65.0)
56 (62.2)
0.53
Cough or difficult breathing
145 (55.8)
42 (46.7)
0.18
Measles
16 (6.2)
5 (5.6)
0.81
Reported illness ( ≥ 1)d
a
Values are mean (95% confidence interval), mean (± standard deviation) or n (%).
Not possible to calculate z-score for age > 5-years using WHO growth standard.
Major diagnoses during admission.
d
Reported symptoms or illness within one month before admission.
b
c
Before giving consent, caretakers were given detailed
verbal and written information about the study using
their language (Afan Oromo). Prior to commencing the
study, ethical clearance was granted from the Research
Ethical Review Committee, College of Public Health and
Medical Sciences, Jimma University. Data were collected
by two trained research nurses who spoke the local
language. A subset of 20 malnourished children was
examined by both nurses to determine percent of technical
error of measurement (% TEM). Inter-observer %TEM
was 1.1% for MUAC. For biceps, triceps, sub-scapular
and suprailiac skinfolds measurements inter-observer %
TEM was between 2.6 and 4.8%. Intra-observer %
TEM for MUAC was < 0.5% for both nurses, whereas
it was between 1.6 and 3.7% for the four skin folds.
The study was conducted from December 2009 to
October 2011.
Statistics and data handling
Mean ± standard deviation (SD) median (25th; 75th percentile) were used for continuous and percentages for
categorical variables when analyzing as well as presenting
data. Analysis was done stratified by age, using cut-off
60 months. Chi square, Fisher’s exact test and student
t-test were used to test for differences in proportion or
mean between groups. Simple and multiple logistic regressions were employed to identify predictors of oedema, and
odds ratio (OR) with 95% confidence interval (CI) was
reported. All the variables except “reported illness” were
used in regression; the variable was omitted because of
possible overlap in its information with “co-infection”.
Data was double entered using EpiData version 3 (EpiData
Association, Odense, Denmark). Stata/IC 11.2 (StataCorp,
Texas) was used for data analysis and WHO Anthro Plus
v 1.0.3 (WHO, Geneva, Switzerland) to calculate Z-score
Girma et al. BMC Pediatrics 2013, 13:204
/>
Page 4 of 8
80
60
40
Children with oedema (%)
20
0
Results
During the study period, a total of 527 SAM children
(0.5 to 14 years of age) were admitted to the paediatric
ward. From these, 176 (33.4%) were excluded, mainly
(96.7%) due to critical illness. No differences were found
between excluded and studied children when comparing
their mean age (1.6 months, 95% CI, -4.2, 7.4), and the
proportions of females (38.6% v. 43.3%, p = 0.30), presence
of oedema (66.1% v. 61.1%, p = 0.26) and proportion
of children under the age of five years (75.6% v. 74.4%,
p = 0.76).
In total, 351 children were included in the study. The
median age was 36 months (interquartile range 24 to 60),
and 261 (74.4%) were under the age of five years. The proportion of females was lower among the younger children
compared to older (40.2% v. 52.2%, p = 0.05) (Table 1).
Among the young children, 151 (57.8%) had their
mothers as attendants in the hospital (Table 1). In both
age groups most children came from farming families,
187 (71.6%) in the younger and 76 (83.5%) in the older
age group. There was no difference between the two age
groups in parental schooling, household’s access to toilet
facility and safe water (Table 1). More children in the older
group were admitted during the pre-harvest (June-Nov)
season compared to the post-harvest period (Dec-May).
However, there was no apparent seasonal variation for
the young age group. The seasonal difference in admission
between the two age groups was not significant.
The mean Z-scores of weight-for-age (WAZ), heightfor-age (HAZ) and BMI-for-age (BMIZ) for young children
were −3.7 (95% CI: -4.0, -3.5), -3.4 (95% CI: -3.5,-3.1)
and −2.4 (95% CI: -2.6,-2.2), respectively (Table 2). The
means of these indices of the younger children, as shown
in Table 2, were not different from that of the older
children. The proportion of infection was significantly
higher among the younger children (33% v. 8.9%, p < 0.001)
(Table 2). Pneumonia was the leading infection in both
groups, with 23.0% and 4.4% affected, respectively.
Oedema was present in 214 (61.1%) children (Table 2).
Among these children 102 (47.7%), 59 (27.6%) and 53
(24.8%) had oedema of grade “+”, “++”, and “+++”, respectively (data not shown in table). There was no difference in the proportion and grade of oedema between
the two age groups (p = 0.87). In the younger group, the
proportion of oedema almost doubled after infancy and
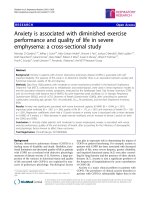
peaked at three to five years of age (Figure 1). The proportion of oedema was about one third lower among
96–168 months old children compared to 60–95 months
(p = 0.003). However, in both age groups the mean HAZ
and admissions seasons were comparable between children
with and without oedema (Table 3).
100
using WHO growth standards. P-value < 0.05 was considered significant.
6-23
13-24
25-36
37-59
60-95
96-168
[ N = 42 ] [ N = 83 ] [ N = 77 ] [ N = 52 ] [ N = 61 ] [ N = 29 ]
Figure 1 Percentage of severely malnourished children with
oedema by age category in months. The error bars represent 95%
confidence intervals
In the younger group, oedematous children had
significantly lower prevalence of infection compared to
non-oedematous children (25.2% v. 45.1%, p = 0.001).
Nevertheless, in the older group the difference in prevalence of infections among oedematous and nonoedematous children was not significant, (5.5% v. 14.3%,
p = 0.17). Finally, logistic regression was performed to
determine predictors of oedema (Table 4).
The risk of oedema was lower for children 96–168 months
of age as compared to 60–95 months (OR = 0.34, 95%
CI: 0.13, 0.88). Among the younger children, the odds
of oedema was lower in children with TB (OR = 0.20, 95%
CI: 0.06, 0.70) or diarrhea, (OR = 0.40, 95% CI: 0.21, 0.73).
These factors did not predict oedema in the older group,
however.
Discussion
Most studies on SAM have focused on children under the
age of five years. However, as shown in our study, a great
proportion of children above the age of 5 were admitted
with SAM. Overall, oedematous malnutrition affected
around 60% of the children. Additionally, among children
under the age of five years a positive relationship was
found between age and oedema, whereas in the older children this relationship was reversed. Finally, the risk of
oedema was found to be lower in children with infection.
The relationship between age and oedema is a significant finding from our study. There are hardly studies
which investigated the age-oedema relationship in older
children (> 5 years). Using logistic regression and as
shown in Figure 1, the proportion of oedema doubled after
infancy with peak at three-five years of age; the odds of
oedema was also five times higher at three-five years of
age as compared to infants. The odds and proportion of
oedema, however, decreased with age after the age of three
to five years.
Girma et al. BMC Pediatrics 2013, 13:204
/>
Page 5 of 8
Table 3 Age, sex, height, weight, admission season and
illness of severely malnourished children by presence of
oedema and age group
Table 3 Age, sex, height, weight, admission season and
illness of severely malnourished children by presence of
oedema and age group (Continued)
Non-oedematousa Oedematousa P-value
n = 102
n = 102
< 5 yr
0.001
1 (1.8)
Unknown
12 (34.3)
14 (25.5)
26 (74.3)
33 (60.0)
0.17
19 (54.3)
23 (41.8)
0.25
52 (32.7)
Cough or difficult
breathing
25 (24.5)
52 (32.7)
Diarrhea
22 (63.0)
34 (61.8)
0.92
15 (14.7)
38 (24.0)
Measles
1 (2.8)
4 (7.3)
0.65
31 (30.4)
17 (10.7)
13-24
31 (30.4)
25-36
37-59
Height-for-age Z-score
−3.5 ± 1.8
−3.2 ± 1.6
0.28
a
Female sex
38 (37.3)
67 (42.1)
0.43
c
Pre-harvest
56 (55.0)
73 (45.9)
0.21
Post-harvest
46 (45.0)
86 (54.1)
46 (45.1)
40 (25.2)
Admission seasonb
Co-infectionc
0.001
TB
10 (9.8)
4 (2.5)
0.02
Pneumonia
33 (32.4)
27 (17.0)
0.01
Diarrhea
33 (32.4)
25 (15.7)
0.002
Malaria
2 (2.0)
6 (3.8)
0.49
Negative
67 (65.7)
106 (66.7)
Positive
5 (5.0)
1 (0.6)
Unknown
30 (29.3)
52 (32.7)
HIV status
0.08
d
Reported illness
96 (94.1)
141 (88.7)
0.15
76 (75.0)
106 (66.7)
0.06
69 (67.6)
76 (47.8)
0.001
Diarrhea
63 (61.8)
106 (66.7)
0.52
Measles
9 (8.8)
7 (4.4)
0.20
n = 35
n = 55
Fever
Cough or difficult
breathing
≥ 5 yr
0.72
Fever
6-12
Age category, mo
0.03
60-95
19 (54.3)
42 (76.4)
96-168
16 (45.7)
13 (23.6)
Height-for-age Z-score
−3.3 ± 1.5
−3.7 ± 1.2
0.51
Female sex
22 (63.0)
25 (45.5)
0.11
Pre-harvest
21 (60.0)
34 (61.8)
0.86
Post-harvest
14 (40.0)
21 (38.1)
5 (14.3)
3 (5.5)
Admission seasonb
0.17
TB
2 (5.7)
1 (1.8)
0.34
Pneumonia
2 (5.7)
2 (11.7)
0.64
Diarrhea
2 (5.7)
1 (5.9)
0.56
Malaria
1 (2.8)
-
0.39
21 (60.0)
40 (72.7)
HIV status
Negative
2 (5.7)
Reported illnessd
Age category, mo
Co-infectionc
Positive
0.30
Values are mean ± standard deviations or n (%).
Pre-harvest (June -Nov) and post-harvest (Dec-May).
Major diagnoses during admission.
d
Illnesses within one month before admission as reported by caretaker.
b
Although the mechanism for this relationship is uncertain, there are some probable explanations. When children start to walk and explore their environment, their
risk of acquiring infection or exposure to environmental
contaminants is likely to increase [16]. Furthermore, the
weaning process and gradual loss of maternally acquired
immunity could contribute to increased infection. As a
result, this infection or exposure to bacterial endotoxins
may increase production of free radicals and oxidative
stress [17,18], which may lead to oedema. However, the
interaction of immunity and infection and its result
might be influenced by age. The requirement for a certain degree of immunocompetence for development of
oedema in SAM children was suggested, based on a
finding of lower CD4+ percentages in non-oedematous
irrespective of their HIV status [19]. Furthermore, a
study among Ugandan children showed that half the
children hospitalized for severe malnutrition developed
oedema after starting ART, although non-oedematous
SAM is common in HIV-infected children [20]. So this
might be a potential explanation for the higher risk of
oedema with increasing age in the first five years. Its
subsequent decline might be as a result of better immunity, and as a result lower risk of infection with increasing age.
Infection was found to be lower in oedematous SAM.
It seems oedematous SAM is an acute disease usually
presenting with shorter duration of illness. Its metabolic dysfunctions resemble that of acute conditions
with high case fatality such as toxic shock syndrome
and multi-organ failure [21]. Theoretically, this short
duration might not be long enough for severe aberration in immunity to develop thus reducing the risk or
severity of infection. In hospitals most deaths of SAM
children, especially with oedema, are associated with
infusion or transfusion [4]. Assessing and managing dehydration/shock in SAM children is also often difficult
and incorrect [22].
Girma et al. BMC Pediatrics 2013, 13:204
/>
Page 6 of 8
Table 4 Factors associated with oedema among 351 children admitted with severe acute malnutrition with odds ratios
(OR) and 95% confidence intervals (CI)
Simple logistic regression
Multiple logistic regression
Model I
OR (95% CI)
P-value
OR (95% CI)
Model II
P-value
OR (95% CI)
P-value
< 5 yr
Age category, mo
6-12
Reference
13-24
3.06 (1.46; 6.41)
0.003
Reference
3.11 (1.48; 6.55)
0.003
Reference
3.04 (1.42;6.53)
0.04
25-36
3.80 (1.77; 8.11)
0.001
3.82 (1.78; 8.18)
0.001
3.67 (1.67;8.02)
0.001
37-59
4.61 (2.00; 10.71)
< 0.001
4.74 (2.04; 11.04)
< 0.001
5.08 (2.10;12.35)
< 0.001
0.20 (0.06; 0.70)
0.01
0.40 (0.21; 0.73)
0.003
0.34 (0.13; 0.88)
0.03
Female sex
1.25 (0.75; 2.10)
0.40
0.76 (0.45; 1.30)
0.35
Height-for-age Z-score
1.08 (0.93; 1.26)
0.29
1.15 (0.98; 1.35)
0.09
0.16
1.28 (0.76; 2.14)
0.35
Admission seasona
Pre-harvest
Reference
Post-harvest
1.43 (0.87; 2.36)
Co-infection b
TB
0.24 (0.07; 0.78)
0.02
0.16 (0.04; 0.55)
0.004
Pneumonia
0.44 (0.25; 0.80)
0.007
0.47 (0.22; 0.76)
0.02
Diarrhea
0.41 (0.22; 0.74)
0.003
0.41 (0.23; 0.81)
0.004
Malaria
1.92 (0.38; 9.71)
0.43
2.0 (0.37; 10.30)
0.42
HIV status
Negative
Reference
Positive
0.12 (0.01; 1.08)
0.06
0.14 (0.02;1.27)
0.08
Unknown
1.03 (0.60; 1.79)
0.91
1.15(0.66; 2.02)
0.62
0.68 (0.39; 1.20)
0.18
0.73 (0.41; 1.30)
0.28
Diarrhea
1.4 (0.74; 2.08)
0.42
1.25 (0.73; 2.14)
0.41
Cough
0.44 (0.26; 0.73)
0.002
0.48 (0.28; 0.82)
0.007
Measles
0.48 (0.17; 1.32)
0.15
0.61 (0.21; 1.75)
0.35
Reported illnessc
Fever
≥ 5 yr
Age category, mo
60-95
Reference
Reference
96-168
0.37 (0.15; 0.91)
0.03
Female sex
0.47 (0.20; 1.11)
0.09
Height-for-age Z-score
0.83 (0.62; 1.12)
0.39 (0.16; 0.99)
0.05
0.23
0.83 (0.60; 1.15)
0.27
Admission season
Pre-harvest
Reference
Post-harvest
0.93 (0.39; 2.20)
0.86
1.21 (0.48; 3.05)
0.71
TB
0.25 (0.02; 3.2)
0.30
0.20 (0 .01; 2.20)
0.18
Pneumonia
0.31 (0.04; 2.30)
0.25
0.42 (0 .05; 3.34)
0.42
Diarrhea
0.15 (0.01; 1.66)
0.12
0.23 (0 .02; 2.18)
0.20
Co-diagnoses
b
Girma et al. BMC Pediatrics 2013, 13:204
/>
Page 7 of 8
Table 4 Factors associated with oedema among 351 children admitted with severe acute malnutrition with odds ratios
(OR) and 95% confidence intervals (CI) (Continued)
HIV status
Negative
Reference
Positive
0.28 (0.02; 3.20)
0.30
0.38 (0.02; 4.66)
0.45
Unknown
0.64 (0.25; 1.62)
0.35
0.65 (0.25; 1.71)
0.38
Fever
0.52 (0.20; 1.31)
0.17
0.41 (0.15; 1.12)
0.08
Diarrhea
0.96 (0.40; 2.30)
0.92
0.88 (0.35; 2.18)
0.78
Cough
0.61 (0.26; 1.42)
0.25
0.60 (0.24; 1.44)
0.25
Measles
2.67 (0.30; 25.00)
0.38
2.68 (0.27; 27.0)
0.40
Reported illnessc
a
Pre-harvest (June -Nov) and post-harvest (Dec-May).
Major diagnoses during admission.
Illnesses within one month before admission as reported by caretaker.
Model I: adjusted for age and sex.
Model II: adjusted for age, sex, co-infection, admission season and height-for-age Z-score.
b
c
Younger children with TB were less likely to present
with oedema. Macallan [23] showed that TB was associated with wasting, as a result of increased resting energy
expenditure and anorexia. Wasting could be due to cytokine induced impairment of amino acids utilization for
protein synthesis [24].
Experimental and prospective community studies are
recommended to better understand the role of infectionimmunity interaction, and effect of age, in the pathogenesis of nutritional oedema [25]. Routine use of antibiotics during treatment of SAM has been questioned
[26,27]. A recent trial showed that antibiotics improved
recovery and reduced mortality [28]. However, similar
evaluation has to be done in areas with low HIV prevalence. Last, in areas where undernutrition is common,
older children should be routinely screened for SAM, at
least in hospitals, and proper treatment instituted.
Generalization of our finding may be affected by certain limitations of the present study. First, selection
bias is an inherent problem of hospital based studies.
Hence, the general population of SAM children may
not have been well represented. Second, the prevalence
of infection might be underestimated due to the absence of detailed and systematic radiological and
microbiological investigations to diagnose or exclude
infection. Often, diagnosing infection in severely malnourished individuals is difficult and required detailed,
and sometimes invasive microbiological investigations.
Third, infants less than 6 months were excluded. Although not common, oedema has been documented in
this group of children by previous studies [29]. Finally,
there might be recall bias in estimating the child’s age.
Practically it is impossible to get recorded date of birth
as almost all deliveries in rural Ethiopia take place at
home [30].
Conclusion
The following two conclusions can be drawn from the
present study. First, proportion of oedematous SAM
peaked at three-five years of age. Second, the prevalence
of infection was lower among children with oedematous
SAM. Although the data are cross-sectional, the relationship suggest that oedema might result from the infectionimmunity interaction, which in turn could be influenced
by age of the child.
Competing interests
The authors declare that they have no competing interests.
Authors’ contributions
TG, PK, KFM, CM and HF were involved in the conception and design of the
study. TG, ALH and PK contributed to acquisition of data. TG, PK, KFM, CM
and HF contributed to analyses and interpretation of the data. TG was
responsible for writing up of the paper while all co-authors reviewed the
draft manuscript. All authors read and approved the final manuscript.
Acknowledgements
The authors are grateful to the participants and their care takers/families as
well as the staffs at the Pediatric ward of Jimma University Specialized
Hospital. The study received funding from Danish International Development
Agency through grants 104.DAN.8-1207 and 09–097 LIFE.
Author details
1
Department of Pediatrics and Child Health, Jimma University Specialized
Hospital, Jimma, Ethiopia. 2Department of Nutrition, Exercise and Sports
University of Copenhagen Frederiksberg Campus, Rolighedsvej 30,
Frederiksberg C DK-1958, Denmark.
Received: 4 June 2013 Accepted: 27 November 2013
Published: 6 December 2013
References
1. Morris SS, Cogill B, Uauy R: Effective international action against
undernutrition: why has it proven so difficult and what can be done to
accelerate progress? Lancet 2008, 371(9612):608–621.
2. Caulfield LE, De Onis M, Blössner M, Black RE: Undernutrition as an
underlying cause of child deaths associated with diarrhea, pneumonia,
malaria, and measles. Am J Clin Nutr 2004, 80(1):193–198.
Girma et al. BMC Pediatrics 2013, 13:204
/>
3.
4.
5.
6.
7.
8.
9.
10.
11.
12.
13.
14.
15.
16.
17.
18.
19.
20.
21.
22.
23.
24.
25.
World Health Organization: WHO, UNICEF, and SCN informal consultation on
community-based management of severe malnutrition in children, SCN
Nutrition Policy Paper No. 21. Geneva: World Health Organization; 2006.
Bachou H, Tumwine JK, Mwadime RKN, Tylleskär T: Risk factors in hospital
deaths in severely malnourished children in Kampala, Uganda. BMC
Pediatr 2006, 6:7.
Management of Severe Malnutirtion: A Manual for Physicians and Other
Senior Health Workers. Geneva: WHO; 1999.
Dewji GN: Kwashiorkor: A protein deficiency disease. Nurs Times 1969,
65(17):523–524.
Fechner A, Böhme C, Gromer S, Funk M, Schirmer R, Becker K: Antioxidant
status and nitric oxide in the malnutrition syndrome kwashiorkor. Pediatr
Res 2001, 49(2):237–243.
Forrester TE, Badaloo AV, Boyne MS, Osmond C, Thompson D, Green C,
Taylor-Bryan C, Barnett A, Soares-Wynter S, Hanson MA, Beedle AS,
Gluckman PD, Bhutta ZA: Prenatal factors contribute to the emergence of
Kwashiorkor or Marasmus in severe undernutrition: Evidence for the
predictive adaptation model. PLoS ONE 2012, 7(4):e35907.
Henry FJ, Briend A, Fauveau V, Huttly SA, Yunus M, Chakraborty J: Gender
and age differentials in risk factors for childhood malnutrition in
Bangladesh. Ann Epidemiol 1993, 3(4):382–386.
Ighogboja SI: Some factors contributing to protein-energy malnutrition in
the middle belt of Nigeria. East Afr Med J 1992, 69(10):566–571.
Jeyaseelan L, Lakshman M: Risk factors for malnutrition in south Indian
children. J Biosoc Sci 1997, 29(1):93–100.
Medhin G, Hanlon C, Dewey M, Alem A, Tesfaye F, Worku B, Tomlinson M,
Prince M: Prevalence and predictors of undernutrition among infants
aged six and twelve months in Butajira. Ethiopia: The P-MaMiE Birth
Cohort. BMC Public Health 2010, 10:27.
Sharghi A, Kamran A, Faridan M: Evaluating risk factors for protein-energy
malnutrition in children under the age of six years: A case–control study
from Iran. Int J Gen Med 2011, 4:607–611.
Ethiopia Federal Ministry of Health: Protocol for the Management of Severe
Acute Malnutrition, Ministry of Health- Federal Democratic Republic of Ethiopia.
Ethiopia: Michael Golden and Yvonne Grellety; 2007.
Ethiopia Federal Ministry of Health: TBL and TB/HIV Prevention and control
program manual, Ministry of Health- Federal Democratic Republic of Ethiopia.
Ethiopia: Ethiopia Federal Ministry of Health; 2008.
Yatsunenko T, Rey FE, Manary MJ, Trehan I, Dominguez-Bello MG, Contreras
M, Magris M, Hidalgo G, Baldassano RN, Anokhin AP, Heath AC, Warner B,
Reeder J, Kuczynski J, Caporaso JG, Lozupone CA, Lauber C, Clemente JC,
Knights D, Knight R, Gordon JI: Human gut microbiome viewed across
age and geography. Nature 2012, 486:222–227. Available from: http://www.
nature.com/doifinder/10.1038/nature11053.
Golden MH: Evolution of nutritional management of acute malnutrition.
Indian Pediatr 2010, 47(8):667–678.
Manary MJ, Leeuwenburgh C, Heinecke JW: Increased oxidative stress in
kwashiorkor. J Pediatr 2000, 137(3):421–424.
Bachou H, Tylleskär T, Downing R, Tumwine JK: Severe malnutrition with
and without HIV-1 infection in hospitalised children in Kampala, Uganda:
Differences in clinical features, haematological findings and CD4+ cell
counts. Nutr J 2006, 5:27.
Prendergast A, Bwakura-Dangarembizi MF, Cook AD, Bakeera-Kitaka S,
Natukunda E, Nahirya Ntege P, Nathoo KJ, Karungi C, Lutaakome J,
Kekitiinwa A, Gibb DM: Hospitalization for severe malnutrition among
HIV-infected children starting antiretroviral therapy. AIDS 2011,
25(7):951–956.
Mh G: Oedematous malnutrition. Br Med Bull 1998, 54:433–444.
Maitland K: Symposium 5: Joint BAPEN and Nutrition Society Symposium
on “Feeding size 0: The science of starvation” Severe malnutrition:
Therapeutic challenges and treatment of hypovolaemic shock. Proc Nutr
Soc 2009, 68(03):274.
Macallan DC: Malnutrition in tuberculosis. Diagn Microbiol Infect Dis 1999,
34(2):153–157.
Macallan DC, McNurlan MA, Kurpad AV, De Souza G, Shetty PS, Calder AG,
Griffin GE: Whole body protein metabolism in human pulmonary
tuberculosis and undernutrition: Evidence for anabolic block in
tuberculosis. Clin Sci 1998, 94(3):321–331.
Smith MI, Yatsunenko T, Manary MJ, Trehan I, Mkakosya R, Cheng J, Kau AL,
Rich SS, Concannon P, Mychaleckyj JC, Liu J, Houpt E, Li JV, Holmes E,
Nicholson J, Knights D, Ursell LK, Knight R, Gordon JI: Gut microbiomes of
Page 8 of 8
26.
27.
28.
29.
30.
Malawian twin pairs discordant for kwashiorkor. Science 2013,
339(6119):548–554.
Lazzerini M, Tickell D: Antibiotics in severely malnourished children:
Systematic review of efficacy, safety and pharmacokinetics. Bull World
Health Organ 2011, 89(8):594–607.
Trehan I, Amthor RE, Maleta K, Manary MJ: Evaluation of the routine use of
amoxicillin as part of the home-based treatment of severe acute
malnutrition. Trop Med Int Health 2010, 15(9):1022–1028.
Trehan I, Goldbach HS, LaGrone LN, Meuli GJ, Wang RJ, Maleta KM, Manary
MJ: Antibiotics as part of the management of severe acute malnutrition.
N Engl J Med 2013, 368(5):425–435.
Begum A, Sharma JD, Azad AK, Mahmud NU, Ahmad M: Prevalence of
oedematous malnutrition in early infancy. J Chittagong Med Coll Teach
Assoc 2010, 21(1):50–55. Available from: o/index.
php/JCMCTA/article/view/7679.
Central Statistical Agency [Ethiopia] and ICF International: Ethiopia
Demographic and Health Survey 2011. Addis Ababa, Ethiopia and Calverton,
Maryland, USA: Central Statistical Agency and ICF International; 2012.
doi:10.1186/1471-2431-13-204
Cite this article as: Girma et al.: Predictors of oedema among children
hospitalized with severe acute malnutrition in Jimma University
Hospital, Ethiopia: a cross sectional study. BMC Pediatrics 2013 13:204.
Submit your next manuscript to BioMed Central
and take full advantage of:
• Convenient online submission
• Thorough peer review
• No space constraints or color figure charges
• Immediate publication on acceptance
• Inclusion in PubMed, CAS, Scopus and Google Scholar
• Research which is freely available for redistribution
Submit your manuscript at
www.biomedcentral.com/submit