A proposal of methodology to analyze platoon dispersion at signalized crosswalk considering pedestrian demand and crosswalk length
Bạn đang xem bản rút gọn của tài liệu. Xem và tải ngay bản đầy đủ của tài liệu tại đây (729.18 KB, 10 trang )
Transport and Communications Science Journal, Vol. 71, Issue 1 (01/2020), 1-10
Transport and Communications Science Journal
A PROPOSAL OF METHODOLOGY TO ANALYZE PLATOON
DISPERSION AT SIGNALIZED CROSSWALK CONSIDERING
PEDESTRIAN DEMAND AND CROSSWALK LENGTH
Chu Tien Dung1*
Vietnam – Japan Research and Development Center (Vijard), University of Transport and
Communications, No 3 Cau Giay Street, Hanoi, Vietnam.
1
ARTICLE INFO
TYPE: Research Article
Received: 27/09/2019
Revised: 22/11/2019
Accepted: 30/11/2019
Published online: 31/01/2020
/>*
Corresponding author
Email:
Abstract. Understanding pedestrian platoon dispersion at signalized crosswalk is essential
not only for improving pedestrian safety but also for estimating pedestrian crossing time
requirement. This paper proposed platoon dispersion ratio (PDR) as an index to analyse the
effects pedestrian demand and crosswalk length upon pedestrian platoon dispersion at
signalized crosswalk. The result shows that the heavier pedestrian demand usually
corresponds to greater platoon dispersion. Regarding the influence of crosswalk length, it is
revealed that the dispersion tends to increase as the crosswalk length increases.
Keywords: Pedestrian platoon, dispersion, dispersion ratio, pedestrian demand, crosswalk
length
© 2020 University of Transport and Communications
1. INTRODUCTION
In the last few decades, researchers and planers have paid great attention to pedestrians
in order to improve their comfort and safety, especially at signalized crosswalks. At
signalized crosswalks, although pedestrians have prioritized right of way, the pedestrian
fatalities due to traffic accident is still high. The threat to pedestrian safety mainly comes
from the turning vehicles since in common phasing plans; they share the same phase with
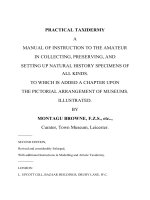
pedestrians. In European Union (EU), as of 2016, 5.320 pedestrians were killed in road
accidents in the EU (excluding Lithuania and Slovakia), which is 21% of all road fatalities
(see Fig.1) [1]. In Japan, as shown in Fig. 2 nearly one-third of the total traffic accident
1
Transport and Communications Science Journal, Vol. 71, Issue 1 (01/2020), 1-10
fatalities are pedestrians [2]. Understanding both pedestrian and vehicle behavior is very
important for improving the safety performance of signalized intersection.
Figure 1. Pedestrian fatalities by total fatalities of all road users (Source: CARE database,
data available in May 2018).
Figure 2. Pedestrian fatalities by total fatalities of all road users (source: Japan National
Police Agency, 2019).
In reality, road users behave by anticipating other user’s behavior. When pedestrian
platoon moves to the downstream of the crosswalk and disperses, the gap may appear for the
turning vehicles. The question is how pedestrian platoon disperses in different pedestrian
demand and crosswalk length? Understanding this deformation in pedestrian platoon will be
essential for predicting the gaps as well as accessing the safety of signalized intersection. In
another aspect, how pedestrian platoon disperses as the platoon moves to the downstream of
the crosswalk is essential for estimating pedestrian crossing time requirement at signalized
crosswalks. However, most of the existing manuals and guidelines (e.g. U.S Highway
Capacity Manual - HCM 2010 [3], Japanese Manual on Traffic Signal Control – 2006 [4]) for
the design and operation of signalized intersections estimate the pedestrian clearance time
depending on crosswalk length and constant speed without considering the effects of platoon
dispersion.
Despite its importance, the studies regarding pedestrian platoon dispersion have not
been properly considered. Although, many models have been established related to vehicle
dispersion, they cannot be applied to pedestrian platoons. This is because pedestrian platoon
dispersion is quite different from that for vehicle platoon. Compared to vehicles that follow
2
Transport and Communications Science Journal, Vol. 71, Issue 1 (01/2020), 1-10
each other on dedicated lanes, pedestrians can adjust their speed more freely, much less
constrained by a platoon than vehicles to its platoon.
Thus, the aim of this study is to investigate the influencing factors in the dispersion of
pedestrian platoon at signalized crosswalks in order to improve pedestrian safety as well as
the operation and design of signalized crosswalks. This paper concentrates upon the
influences of pedestrian demand and crosswalk length on pedestrian platoon dispersion.
This paper is organized as follows: after the introduction and literature review, data
collection and processing are explained. This is followed by analysis methodology. Then a
comprehensive discussion on the effects of pedestrian demand and crosswalk length on
pedestrian platoon dispersion are conducted and discussed. Finally, the paper ends up with
summary of the results and future works.
2. LITERATURE REVIEW
Herein, two basic concepts are introduced from the literature regarding pedestrian
platoon. The U.S Highway Capacity Manual (HCM 2010) [3] defines pedestrian platoon as a
group of pedestrian traveling together either voluntarily or involuntarily, because of signal
control, road geometry or other factors. In a study of Arasan and Kashani [5], platoon
dispersion is defined as the phenomenon, in which pedestrians released from, for example, a
waiting area, will get segregated, as they move to the downstream of the crosswalk.
Virkler [6] analysed the potential benefits of reducing delay through consideration of
pedestrian dispersion. He concluded that if pedestrians can select their own speeds along a
sidewalk, platoon dispersion will naturally occur. Moreover, when pedestrian flow reaches
the end of the crosswalk, dispersion occurred and it would continue to disperse as pedestrian
flow moves further along the sidewalk. However, the dispersion formulation and its
influencing factors are not clear. In another studies, Virkler [7] proposed a model for
estimating crossing time at scramble crossing and two-way crosswalk (Eq. 1). The model is
then adopted by HCM 2010. He found that the platoon dispersion has significant effects on
estimating required pedestrian crossing time. Therefore, in his proposed model, the effects of
platoon dispersion were considered by simply adding amount of time for each pedestrian into
platoon discharge time (the last part).
L
for w ≤ 3m
T=I+
+ 0.27 N ped
Sp
(1)
L
N ped
for w > 3m
T=I+
+ 0.81
Sp
w
Where:
T is total time required for all the crossing process,
I is initial start-up lost time,
L is crosswalk length (m),
Sp is walking speed (m/sec),
Nped is number of pedestrians crossing during an interval p from one side of
the crosswalk,
And w is crosswalk width (m).
Although the model considers the effects of platoon dispersion, simply adding time
headway for each pedestrian might be not enough. Because the dispersion is not influenced
3
Transport and Communications Science Journal, Vol. 71, Issue 1 (01/2020), 1-10
by only pedestrian demand but also other factors such as bi-directional effect, pedestrian
origin-destination, crosswalk length, etc. The Japanese Manual on Traffic Signal Control
(2006) [4] proposes a formula to estimate required crossing time as presented in Equation 2.
However, the proposed model does not consider the effects of platoon dispersion.
T=
L
Sp
+
N ped
(2)
Qd w
Where Qd is discharge rate (ped/m.sec).
Recently, Forde and Daniel [8] uses observed data to evaluate the performance of the
platoon dispersion model of HCM 2010. The model was evaluated under influences and
without influences of traffic conditions including pedestrian and vehicular interactions on urban
collector street segments and the presence of trucks within the traffic stream on principal urban
arterial segments. It is concluded that the HCM 2010 platoon dispersion model performs
relatively well in predicting platoon arrival profiles on urban street segments without influences
of traffic conditions. However, under influences of pedestrian and truck, the model's
performance is limited. Wael et al [9] investigates the rationality and effectiveness of designing
signal coordination for pedestrians considering relationship between pedestrian platoon
dispersion and the signal cycle length. Their results showed that the coordination for the major
pedestrian flow led to a significant reduction in average delay (15%).
3. DATA COLLECTION AND PROCESSING
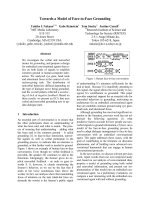
For analyzing pedestrian platoon dispersion, video data was collected at three
signalized crosswalks in Japan (see Fig. 3). The first and the second sites (Mizuho
Kuyakusho and Sasashima) are located in Nagoya City while the third one (Tokyo
International Forum) is located in Tokyo City, Japan. The observation times, the geometric
and pedestrian characteristics of the study sites are presented in Table 1. It is important to
note that the pedestrian flows at these crosswalks are assumed to be unidirectional since the
opposite pedestrian demand is very low (10% compared to subject pedestrian demand).
Therefore, the movement of platoon is almost not influenced by the opposing pedestrian
flows.
The trajectories of crossing pedestrians are extracted from video data by using the
image processing system TrafficAnalyze [10]. The position and timing of each pedestrian
was extracted every 1.0 seconds. The point where the feet of the pedestrian are touching the
ground is the reference observation point. Notably, an advantage of the TrafficAnalyze is
that it helps to collect the trajectory of each individual pedestrian. However, it has some
disadvantages. For example, the accuracy of trajectory is dependent on quality of video
resolution, angle of camera and so on.
Table 1. Surveyed site characteristics.
Intersection name
Mizuho Kuyakusho
Sasashima
Tokyo Forum
Crosswalk position
East leg
East leg
South leg
Survey hour
07:00-09:30
07:00-09:30
07:30-10:00
Dimensions w * L
4(m) * 9 (m)
5(m) * 15(m)
5(m) * 15(m)
Pedestrian type
Pupil
Business
Business
Average demand
682 peds/hr
2025 peds/hr
660 peds/hr
4
Transport and Communications Science Journal, Vol. 71, Issue 1 (01/2020), 1-10
Observation
site
Observation
site
Mizuho Kuyakusho
Sasashima
Observation
site
Tokyo International Forum
Figure 3. Observation sites.
4. ANALYSIS METHODOLOGY
Fig. 4 presents time-space diagram in order to compare the crossing time. In this study,
it is assumed that, the upstream curb and downstream curb are defined based on the direction
of pedestrians. From Fig. 4, it is obvious that there are several possible ways to measure
pedestrian platoon dispersion.
- Comparing the average gap between successive pedestrian.
- Comparing the average flow rate at a downstream curb with the average flow rate at
the upstream curb where the platoon was released.
- Comparing the relative time for the platoon to pass the upstream curb and
downstream curb.
In this paper, considering the purpose of the analysis, the third method is utilized and
platoon dispersion ratio (PDR) is proposed as a measure of platoon dispersion. In order to
define PDR, the following assumptions are made:
Figure 4. Pedestrian time-space diagram.
- A platoon is only considered when pedestrians are waiting before the onset of
pedestrian green at waiting area and those are considered as one platoon only if the
longitudinal distance between them less than 3 meters.
- When the platoon moves to the downstream of the crosswalk, the number of
pedestrians in platoon keeps the same. It means that any possible division in the platoon is
not considered.
5
Transport and Communications Science Journal, Vol. 71, Issue 1 (01/2020), 1-10
PDR is defined as shown in Eq. (3) and it is noted that the larger PDR, the greater
platoon dispersion.
PDR =
TC
TD
(3)
Figure 5. Definition of t1, t2, t3 and t4.
Where TD and TC are the necessary time for all of pedestrian within platoon to pass the
upstream curb and downstream curb, respectively. Eq. 4 and Fig. 5 illustrates how TC and TD
are calculated.
TD = t2 - t1
(4)
TC = t4 - t3
In which:
t1 and t2 are the time at which the first and the last pedestrian in the platoon
pass the upstream curb
t3 and t4 are the time at which the first and the last pedestrian in the platoon pass
the downstream curb.
It should be noted that the first and the last pedestrian who pass the upstream and
downstream curb might be different. PDR can be less than, equal or more than 1. If PDR is
less than or equal to 1, it means that there is no dispersion at all. Such condition might
happen when pedestrian demand is low to medium and they stand quite far from each other
while waiting for the green signal. Therefore, pedestrians can get close to each other when
platoon moves to the downstream of the crosswalk. If PDR is more than 1, the bigger PDR is,
the greater dispersion occurs.
In another dimension, in order to evaluate the performance of existing methodology for
the estimation of required pedestrian crossing time, the observed total crossing time and the
total crossing time by HCM 2010 [3] and Japanese Manual on Traffic Signal Control 2006
[4] are estimated. The observed total crossing time is defined by the Equation 5 while the
total crossing time by HCM (2010) and Japanese Manual are calculated assuming an average
crossing speed of 1.2m/sec and 1.0m/sec respectively.
T = t 4 - t1
(5)
Where T is observed total crossing time while t1 and t4 are explained above.
6
Transport and Communications Science Journal, Vol. 71, Issue 1 (01/2020), 1-10
5. RESULTS AND DISCUSSION.
5.1.
Comparison of total pedestrian platoon crossing time.
Figure 6. Total pedestrian platoon crossing time comparison.
The estimated total crossing times from HCM (2010), Japanese Manual (2006) and the
observed total crossing time are compared as shown Fig. 6. From this figure, it can be seen
that the total crossing time tends to overestimate at Mizuho Kuyakusho while underestimate
at Tokyo forum crosswalk. It can be interpreted that at Mizuho Kuyakusho, the pedestrians
are pupil so their speeds are slower compared to pedestrian speed at Tokyo forum crosswalk
(business pedestrian). At Sasashima crosswalk with high pedestrian demand, the crossing
time has a tendency of underestimation, especially HCM (2010) model. It might be that the
effects of platoon dispersion are not satisfactorily considered in estimating total crossing
time.
5.2.
Analysis influence of pedestrian demand on pedestrian platoon dispersion.
Figure 7. PDR at Tokyo forum and Sasashima crosswalk.
7
Transport and Communications Science Journal, Vol. 71, Issue 1 (01/2020), 1-10
Figure 8. PDR at Mizuho Kuyakusho and Sasashima crosswalk (at 9 meters length).
Before analyzing the influence of pedestrian demand, it is important to note that
Sasashima crosswalk has a demand three times higher than Mizuho Kuyakusho and Tokyo
forum crosswalk. Fig. 7 shows the distribution of PDR at Tokyo forum and Sasashima
crosswalk. From Fig. 7, as expected, the pedestrian demand has a significant influence on
pedestrian platoon dispersion. The distribution of PDR at Sasashima crosswalk is higher than
that at Tokyo crosswalk although both crosswalks have the same crosswalk length. Fig. 8
presents the distribution of PDR at Mizuho Kuyakusho and a reference line of 9 meters from
the upstream curb at Sasashima crosswalk. The result supports the fact that that with the same
length, the crosswalk with higher demand has greater PDR.
5.3.
Analysis influence of crosswalk length on pedestrian platoon dispersion.
Figure 9. PDR at Mizuho Kuyakusho and Tokyo forum crosswalk.
8
Transport and Communications Science Journal, Vol. 71, Issue 1 (01/2020), 1-10
Figure 10. PDR at Mizuho Kuyakusho and Tokyo forum crosswalk (at 9 meters length).
Fig. 9 shows the platoon ratio at Mizuho Kuyakusho crosswalk and Tokyo forum
intersection. It should be emphasized here that these crosswalks have similar pedestrian
demand. It is clear that the dispersion ratio at Tokyo crosswalk with 15-meter length is higher
than that at Mizuho Kuyakusho crosswalk with 9 meters length. In addition, PDR is also
estimated at a reference line of 9 meters from the upstream curb at Tokyo crosswalk and is
presented in Fig. 10. It is interesting to say that, at the same length, PDRs of these two
crosswalks are not significant different although the dispersion at Mizuho Kuyakusho is little
bit higher compared with that at Tokyo crosswalk with 9-meter length. This can be
interpreted as the utility of the lower pedestrian demand at Tokyo crosswalk compared to
Mizuho Kuyakusho crosswalk demand. The influence of crosswalk length upon platoon
dispersion can be explained as the longer crosswalk is, the more crossing time is. Therefore,
pedestrians will have more opportunities to deviate from average crossing time.
6. CONCLUSION AND FUTURE WORK
Existing methodologies for estimating pedestrian crossing time requirement do not
consider the effects of platoon dispersion. The dispersion phenomenon should be taken
satisfactorily to estimate the crossing time requirement because if a great dispersion happens,
pedestrians might not have sufficient time to complete their crossing.
In this paper, a pedestrian platoon dispersion index (PDR) was proposed to analyze the
influences of pedestrian demand and crosswalk length. Data at three signalized crosswalks
were collected and processed for the estimation the PDR. It is concluded that, the higher
demand is, the greater dispersion occurs. Regarding crosswalk length, platoon dispersion
becomes greater as crosswalk length increases.
In this paper, the analysis is limited to only two factors: pedestrian demand and
crosswalk length. Since pedestrian platoon dispersion may be influenced by other factors
such as bi-directional flow, crosswalk width, pedestrian origin-destination, pedestrian type,
etc., more data need to be collected in the future to identify the other influencing factors.
Moreover, model will be developed to quantify the dispersion of pedestrian platoon under
different demand levels, crosswalk geometries and operational policies.
9
Transport and Communications Science Journal, Vol. 71, Issue 1 (01/2020), 1-10
REFERENCES
[1] Traffic Safety Basic Facts – Pedestrians. European Road Safety Observatory, 2018
[2] Traffic Bureau, Japan National Police Agency: Statistics of Traffic Accidents, 2019.
[3] Highway Capacity Manual (HCM), National Research Council, Washington, D.C., USA, 2010
[4] Japan Society of Traffic Engineers, Manual of Traffic Signal Control. Tokyo, Japan, 2006.
[5] V. Thamizh Arasan, Shiraj Hussain Kashani, Modeling Platoon Dispersal Pattern of
Heterogeneous Road Traffic, CD-ROM, Presented at TRB 2003 Annual Meeting
[6] M. R. Virkler, Signal Coordination benefits for pedestrians,Transportation Research Record,
1636 (1998) 77–82. />[7] M. R. Virkler, Scramble and Crosswalk Signal Timing, Transportation Research Record, 1636
(1998) 83-87. />[8] Japan Society of Traffic Engineers, Manual of Traffic Signal Control. Tokyo, Japan, 2006.
[9] A. Forde, J. Daniel, Performance evaluation of the HCM 2010 platoon dispersion model under
midblock pedestrian and truck traffic friction conditions, Journal of traffic and transportation
engineering (English edition), 4 (2017), 522-534. />[10] K. Suzuki, H. Nakamura, TrafficAnalyzer - The Integrated Video Image Processing System for
Traffic Flow Analysis, CD-ROM. Presented at 13th World Congress on Intelligent Transportation
Systems, 8 pages, London, 2006.
[11] W.K. Alhajyaseen, M. Li, H. Nakamura, W. Daamen, Effectiveness of Signal Coordination for
Pedestrian Flows Considering Bi-directional Flow Impacts, Asian Transport Studies, 2 (2013) 223238. />
10