Effect of germinated maize based diets on biochemical parameters in Kadaknath
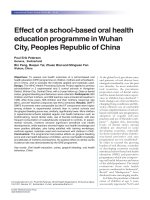
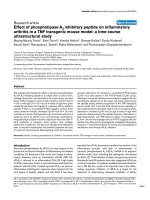
Bạn đang xem bản rút gọn của tài liệu. Xem và tải ngay bản đầy đủ của tài liệu tại đây (385.44 KB, 13 trang )
Int.J.Curr.Microbiol.App.Sci (2019) 8(9): 1072-1084
International Journal of Current Microbiology and Applied Sciences
ISSN: 2319-7706 Volume 8 Number 09 (2019)
Journal homepage:
Original Research Article
/>
Effect of Germinated Maize Based Diets on
Biochemical Parameters in Kadaknath
Akhelesh Kumar Karoriya, Archana Jain*, M. K. Mehta, Chouhan,
Laxmi, Kumar, Rakesh and J. Shakkarpude
Department of Veterinary Physiology and Biochemistry, College of Veterinary Science and
A.H., Mhow, Nanaji Deshmukh Veterinary Science University (M.P.), India
*Corresponding author
ABSTRACT
Keywords
Poultry farming,
chicken, turkeys,
ducks etc
Article Info
Accepted:
12 August 2019
Available Online:
10 September 2019
Poultry farming is the practice of raising poultry, chicken, turkeys, ducks etc. as an
important subcategory of animal husbandry for the production of eggs, meat, feather,
etc. Kadaknath is an important Indian poultry breed which has black meat, slow
growth rate, smaller body size as well as late sexual maturity. For the increment in the
growth of these birds certain feed additives are added to the ration or germination may
also increased the nutritive value of maize and other cereals which are main
component of the poultry ration. The present experiment was conducted on 128 day
old Kadaknath chicks belonging to same hatch and randomly divided into four
treatment groups of 32 chicks each viz., T0, T1, T2, and T3. Control group T0 was
given standard ration with 100% normal maize based diet. The treatment Groups T1,
T2, and T3 were given diets containing standard ration with 50%, 75% and 100%
germinated maize, respectively. The significant increase in serum calcium and
phosphorus along with significant decrease in alkaline phosphatase and acid
phosphatase revealed that the use of germinated maize increase of availability of
calcium and phosphorus for better production. A significant decrease in serum
cholesterol and significant increase in total protein was also observed in all treated
diets as compared to control.
Introduction
Poultry farming is the practice of raising
poultry, chicken, turkeys, ducks etc. as an
important subcategory of animal husbandry
for the production of eggs, meat, feather, etc.
Backyard poultry keeping is practiced by
majority of the poor and marginalized rural
households all over India. These households
rely on low cost backyard poultry rearing to
supplement and enhance their livelihoods.
Kadaknath is an important Indian poultry
breed, also known as Kalamashi in Hindi, is
1072
Int.J.Curr.Microbiol.App.Sci (2019) 8(9): 1072-1084
known for its black-colored meat, poor egg
production, slow growth rate, smaller body
size as well as late sexual maturity. The
commonly available colours of Kadaknath are
jet-black, pencilled and golden. In all the three
varieties of Kadaknath breed, most of the
internal organs exhibit intense black
coloration which is due to the deposition of
melanin pigment in the connective tissue of
organs and in the dermis (Rao and Thomas
1984). It is being reared by tribal communities
in its breeding tract of the Jhabua and Dhar
districts in the western region of the state of
Madhya Pradesh and in adjoining areas of the
states of Gujarat and Rajasthan. Although the
meat of this breed has an unattractive
appearance, it has a delicious flavor (Panda
and Mahapatra, 1989). The flesh of this breed
is black, it is considered not only for the
delicacy of distinctive taste and flavor, but
also of medicinal value.
sugars, minerals and vitamin contents.
However, sprouting has resulted in decreased
starch contents and dry matter content of
grains. It also increases the enzyme contents
of grains.
Materials and Methods
The present experiment was conducted on 128
day old Kadaknath chicks belonging to same
hatch and randomly divided into four
treatment groups of 32 chicks each viz., T0,
T1, T2 and T3. Each group was further
divided into four replications of 08 birds each.
The duration of the experiment was carried
out for 240 days. Control groups (T0) was
given standard ration with 100% normal maize
based diet. The treatment Group T1 was given
diet containing standard ration with 50%
germinated maize.
Maize is one of the main cereals used
worldwide in poultry ration. It is free of
viscous non-starch polysaccharides, the major
anti-nutritive factor present in most other
cereals like barley, wheat and oats. At present
the feed industry is using maize as a basic
energy source in poultry diets. The nutritive
value of maize seed depends on the
technological processes used, such as milling,
oil extraction, starch separation and
germination.
The Group T2 was given diet containing
standard ration with 75% germinated maize
and Group T3 was given diet containing 100%
germinated Maize. The experimental birds
were
vaccinated
against
Marek's
disease, Ranikhet disease and Gumboro
disease/IBD at appropriate time. The birds
were housed in deep litter system in the well
ventilated and lighted rooms and the feed was
given ad.lib. with plenty of fresh water. The
body weight of day old chicks was recorded
on arrival and thereafter on weekly intervals.
The nutritive value of maize and other cereals
depends on germination. One of the most
important methods to increase the nutritive
value of the grains, cereal and oil seeds is to
germinate them. The nutritional value of
sprouted grains is improved due to the
conversion of complex compounds into
relatively simpler compounds that are
nutritionally more valuable. Sprouting of
grains has resulted in increased protein
quantity and quality. Sprouting also increases
the concentration of certain nutrients including
Blood was collected on every 30th days from
each bird. About 3-4ml was collected from
wing vein using 22-24 gauge needle in a clean
dry vial for biochemical analysis. The blood
samples were centrifuged at 3000 rpm for 10
minutes at room temperature and separated
serum stored at 4˚C till further analysis. The
biochemical study was carried out using
ERBA standard diagnostic kits. All
observations were analyzed by using ANOVA
(Snedecor and Cochran, 1994) to compare
different treatment group.
1073
Int.J.Curr.Microbiol.App.Sci (2019) 8(9): 1072-1084
Results and Discussion
Calcium and phosphorus
The mean values of Calcium for T0, T1, T2
and T3 were 10.06±0.01, 11.36±0.01,
12.36±0.02 and 11.03±0.05, after 30 days,
10.72±0.05, 11.63±0.07, 12.44±0.05 and
11.31±0.03, after 60 days, 10.97±0.02,
11.93±0.02, 12.74±0.01 and 11.66±0.01, after
90 days, 10.33±0.01, 12.03±0.04, 12.96±0.01,
and 11.88±0.02, after 120 days, 10.32±0.01,
12.15±0.10, 13.09±0.02 and 12.12±0.01, after
150 days, 10.63±0.01, 12.32±0.05, 13.34±0.01
and 12.36±0.03 after 180 days, 11.06±0.02,
12.56±0.03, 13.74±0.02 and 12.53±0.02, after
210 days and 11.01±0.01, 12.93±0.05,
13.98±0.05 and 12.75±0.02 after 240 days of
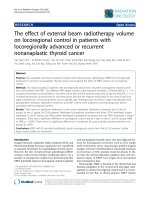
study, respectively,. There was a significant
change (P<0.01) in Calcium in treated groups
as compared to control group (Table 01 and
Figure 01).
The mean values of Phosphorus of T0, T1, T2
and T3 were 11.79±0.01, 12.24±0.02,
12.82±0.01 and 11.94±0.02, after 30 days of
study, 11.82±0.07, 12.76±0.07, 12.91±0.05
and 12.11±0.04, after 60 days 11.87±0.01,
12.87±0.02, 12.96±0.02 and 12.33±0.01, after
90 days 11.94±0.02, 12.92±0.02, 12.99±0.02,
and 12.68±0.01, after 120 days 12.00±0.02,
12.94±0.02, 13.16±0.04 and 12.82±0.05, after
150 days 12.06±0.05, 13.26±0.01, 13.43±0.02
and 13.03±0.01 after 180 days 12.18±0.05,
13.49±0.01, 13.74±0.01 and 13.35±0.05, after
210 days 12.29±0.01, 13.94±0.02,14.12±0.04
and 13.80±0.01, respectively, after 240 days
of study. There was a significant change
(P<0.01) in Phosphorus except for days 30,
60,90, 150 and 240 days where the level was
significance was P<0.05 in all treated groups
as compared to control group (Table 01 and
Figure 02).
There was a significant (p<0.01) increase in
the serum calcium level in all the treated
groups as compared to control groups for
germinated
maize.
The
phosphorus
concentration was significant (P<0.05) in days
30, 60, 90, 150 and 240 and highly significant
after 120, 180 and 210 days of study.
Alkaline and Acid Phosphatase (ALP and
ACP)
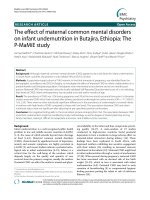
The mean values of Alkaline phosphatase for
T0, T1, T2 and T3 were 153.15±0.02,
151.20±0.04, 150.65±0.11 and 151.80±0.04,
after 30 days of study, 153.30±0.07,
150.77±0.04, 150.35±0.03 and 151.69±0.08,
after 60 days, 153.64±0.02, 150±0.05,
149.96±0.03 and 151.37±0.04, after 90 days,
153.79±0.04, 150.29±0.04, 149.54±0.07, and
151.15±0.06, after 120 days, 154.50±0.07,
150.01±0.04, 149.38±0.07 and 150.78±0.05,
after 150 days, 153.77±0.04, 149.83±0.04,
149.04±0.02 and 150.43±0.13 after 180 days,
153.88±0.03, 149.43±0.08, 148.74±0.05 and
150.02±0.10, after 210 days and 153.80±0.07,
149.28±0.08, 148.23±0.05 and 149.88±0.01,
after 240 days of study, respectively. There
was a significant change (P<0.01) in ALP
except for days 30, 60 and 90 days where the
level was significance was P<0.05 in treated
groups as compared to control group (Table
02 and Figure 03).
The mean values of Acid phosphatase were
7.87±0.03,
7.57±0.12,
6.69±0.01
and
7.69±0.13, after 30 days of study, 8.16±0.04,
7.29±0.02, 6.38±0.03 and 7.16±0.07, after 60
days 8.14±0.03, 6.97±0.02, 6.09±0.02 and
7.05±0.03, after 90 days 8.06±0.01,
6.67±0.03, 5.83±0.04, and 6.81±0.04, after
120 days 8.39±0.02, 6.30±0.04, 5.45±0.03 and
6.64±0.02,
after
150
days
8.40±0.02,6.04±0.04,
5.31±0.05
and
6.30±0.02 after 180 days 8.42±0.01,
5.67±0.02, 5.16±0.02 and 6.19±0.02, after 210
days 8.19±0.02, 5.46±0.02,5.06±0.03 and
6.06±0.02 after 240 days, respectively, for T0,
T1, T2 and T3.
1074
Int.J.Curr.Microbiol.App.Sci (2019) 8(9): 1072-1084
There was a significant change (P<0.01) in
Acid phosphatase in treated groups as
compared to control group (Table 02 and
Figure 04). The present study revealed that
there was a significant (p<0.05) decrease in
plasma alkaline phosphatase after 30, 60 and
90 days and acid phosphatase after 30 days,
and in remaining days the activities of these
enzymes were highly significant (P<0.01) in
all the treated groups.
Total proteins,
glucose
Total
cholesterol
and
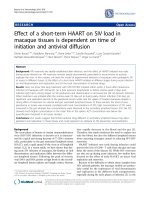
The mean values of Total protein for T0, T1,
T2 and T3 were 7.01±0.03, 8.42±0.01,
9.13±0.03 and 8.12±0.01, after 30 days of
study, 7.05±0.02, 8.65±0.16, 9.35±0.01 and
8.40±0.05, after 60 days, 7.90±0.02,
8.87±0.03, 9.30±0.04 and 8.42±0.01, after 90
days, 7.93±0.01, 8.57±0.02, 9.42±0.04, and
8.33±0.01, after 120 days, 8.09±0.02,
8.38±0.01, 9.42±0.04 and 8.63±0.01, after 150
days, 8.16±0.02,8.41±0.05, 9.46±0.01 and
8.69±0.02 after 180 days, 8.21±0.01,
8.70±0.04, 9.52±0.05 and 8.47±0.14, after 210
days and 8.32±0.05, 8.73±0.05,9.63±0.02 and
8.51±0.04after
240
days
of
study,
respectively. There was a highly significant
change (P<0.01) in Total protein in treated
groups as compared to control group (Table
03 and Figure 05).
The mean values of Total cholesterol for T0,
T1, T2 and T3 were 125.54±0.63,
113.58±0.81, 110.04±0.58 and 113.72±0.02,
after 30 days of study, 129.86±0.23,
113.98±0.06, 112.16±0.21 and 112.25±0.05,
after 60 days, 131.59±0.25, 114.89±0.11,
112.63±0.21 and 112.12±0.05, after 90 days,
112.64±0.27, 114.99±0.07, 113.73±0.23, and
112.29±0.04, after 120 days, 132.74±0.29,
115.21±0.08, 113.87±0.23 and 112.89±0.07,
after 150 days, 133.79±0.29, 115.91±0.08,
114.33±0.23 and 113.12±0.05 after 180 days,
136.94±0.19, 113.11±0.03, 114.47±0.13 and
114.01±0.07, after 210 days and 134.19±0.29,
116.71±0.08, 114.93±0.23 and 114.12±0.07
after 240 days of study, respectively. There
was a significant change (P<0.01) in Total
cholesterol in treated groups as compared to
control group (Table 03 and Figure 06).
The mean values of Glucose were
185.68±0.04, 189.31±0.05, 191.76±0.02 and
187.21±0.01, after 30 days of study,
187.95±0.01, 189.93±0.02, 192.04±0.01 and
189.12±0.03, after 60 days, 186.31±0.04,
191.43±0.02, 193.96±0.01 and 189.56±0.01,
after 90 days, 187.03±0.03, 187.03±0.03,
195.10±0.02, and 189.52±0.01, after 120 days,
187.03±0.03, 195.16±0.01, 195.32±0.01 and
189.52±0.01, after 150 days, 189.72±0.05,
195.46±0.04, 196.01±0.14 and 190.92±0.05
after 180 days, 184.24±0.01, 195.12±0.02,
196.44±0.01 and 191.24±0.02, after 210 days
and 190.74±0.01, 195.64±0.01, 196.72±0.02
and 191.25±0.02after 240 days of study,
respectively, for T0, T1, T2 and T3 groups.
There was a significant change (P<0.01) in
Glucose in treated groups as compared to
control group (Table 03 and Figure 07).
The present study revealed a highly significant
(p<0.01) increase in the level of serum total
protein in the entire period of the present study
but the levels of total cholesterol was
significant (p<0.05) decrease in all days of
treatment except 210 and 240 days, where the
decrease was highly significant (p<0.01).
Calcium and Phosphorus
There was a significant (p<0.01) increase in
the serum calcium level in all the treated
groups as compared to control groups for
germinated
maize.
The
phosphorus
concentration was significant (P<0.05) in days
30, 60, 90, 150 and 240 and highly significant
after 120, 180 and 210 days of study. This
indicated that germinated maize in feed may
1075
Int.J.Curr.Microbiol.App.Sci (2019) 8(9): 1072-1084
have increased activity of phytase enzyme,
which may be capable of releasing of calcium
and inorganic phosphorus by its action phytic
phosphorus (Bound form of phosphorus). So
this inorganic phosphorus readily available for
utilization by the body along with increased
availability of bivalent ions and trivalent ions
like calcium, magnesium, iron and zinc etc.
for the growth and other metabolic activities
of the body.
Table.1 Effect of germinated maize on biochemical parameters in Kadaknath after 30
to 240 days of study (Mean ± SE)
Calcium(mg/dl)
30
Days
60
Days
T0
10.06
±0.01
T1
11.36
±0.01
T2
12.36
±0.02
a
c
d
T3
11.03
±0.05
Phosphorus(mg/dl) **
T0
11.79
±0.01
T1
12.24
±0.02
T2
12.82
±0.01
T3
11.94
±0.02
*
b
a
c
c
b
90
Days
a
10.72
±0.05
c
11.63
±0.07
d
12.44
±0.05
b
11.31
±0.03
**
a
120
Days
10.97
±0.02
a
b
11.93
±0.01
d
12.74
±0.01
c
11.66
±0.01
**
a
11.82
11.87
±0.007 ±0.01
c
12.76
±0.02
d
12.91
±0.05
12.11
±0.04
*
b
c
12.87
±0.02
c
12.96
±0.02
12.33
±0.01
*
b
150
Days
a
10.33
±0.01
c
12.03
±0.04
c
12.96
±0.01
11.88
±0.02
**
b
a
11.94
±0.02
c
12.92
±0.02
d
12.99
±0.02
b
12.68
±0.01
**
a
10.32
±0.01
c
12.15
±0.10
c
13.09
±0.02
b
12.12
±0.01
**
a
12.00
±0.02
bc
12.94
±0.02
c
13.16
±0.04
b
12.82
±0.05
*
**Shows Significance at 1% level as compared to control group (P<0.01)
*Shows Significance at 5% level as compared to control group (P<0.05)
1076
180
Days
210
Days
a
10.63
±0.01
c
12.32
±0.05
d
13.34
±0.01
b
12.36
±0.03
**
a
12.06
±0.05
c
13.26
±0.01
d
13.43
±0.02
b
13.03
±0.01
**
240
Days
a
a
11 .06
±0.02
12.56
±0.04
d
13.74
±0.02
b
12.53
±0.02
**
a
12.18
±0.05
c
13.49
±0.01
d
13.74
±0.01
b
13.35
±0.05
**
11.01
±0.01
b
c
12.93
±0.05
d
13.98
±0.04
12.75
±0.02
**
a
12.29
±0.01
c
13.94
±0.02
d
14.12
±0.04
b
13.80
±0.01
*
b
Int.J.Curr.Microbiol.App.Sci (2019) 8(9): 1072-1084
Table.2 Effect of germinated maize on biochemical parameters in Kadaknath after 30
to 240 days of study (Mean ± SE)
Alkaline
phosphatase
(IU/l)
T0
30
Days
T1
151.20
±0.04
T2
150.65
±0.11
T3
151.80
±0.04
*
60
Days
a
153.15
±0.02
b
c
a
Acid
phosphatase
(IU/l)
T0
a
7.87
±0.03
a
T1
7.57
±0.12
T2
6.69
±0.01
T3
7.69
±0.13
*
b
a
90
Days
a
a
153.30
±0.07
153.64
±0.02
c
b
150.77
±0.04
150.56
±0.05
c
c
150.35
±0.03
151.69
±0.08
*
a
8.16
±0.04
b
7.29
±0.02
d
6.38
±0.03
c
7.16
±0.07
**
120
Days
149.96
±0.03
b
b
151.37
±0.04
*
a
8.14
±0.03
b
6.97
±0.02
d
6.09
±0.02
c
7.05
±0.03
**
153.79
±0.04
150.29
±0.04
149.54
±0.07
151.15
±0.06
**
a
8.06
±0.01
b
6.67
±0.03
d
5.83
±0.04
c
6.81
±0.04
**
150
Days
a
c
c
b
a
154.50
±0.07
a
150.01
±0.04
b
149.38
±0.07
a
150.78
±0.05
**
a
8.39
±0.02
b
6.30
±0.04
c
5.45
±0.03
c
6.64
±0.02
**
**Shows Significance at 1% level as compared to control group (P<0.01)
*Shows Significance at 5% level as compared to control group (P<0.05)
1077
180
Days
210
Days
a
153.77
±0.04
b
149.83
±0.04
c
149.04
±0.02
b
150.43
±0.13
**
a
8.40
±0.02
b
6.04
±0.04
d
5.31
±0.05
c
6.30
±0.02
**
240
Days
a
153.88
±0.03
b
149.43
±0.01
c
148.74
±0.05
b
150.02
±0.10
**
a
8.42
±0.01
b
5.67
±0.02
c
5.16
±0.02
c
6.19
±0.02
**
a
153.80
±0.07
b
149.28
±0.08
c
148.23
±0.05
b
149.88
±0.01
**
a
8.19
±0.02
c
5.46
±0.02
d
5.06
±0.03
c
6.06
±0.02
**
Int.J.Curr.Microbiol.App.Sci (2019) 8(9): 1072-1084
Table.3 Effect of germinated maize on biochemical parameters in Kadaknath after 30
to 240 days of study (Mean ± SE)
Total protein
(g/dl)
30
Days
T0
7.01
±0.03
8.42c
±0.01
T1
a
9.13
±0.03
T3
8.12
±0.01
**
a
b
a
b
a
T2
110.04
±0.58
113.72
b
b
±0.02
*
185.68
±0.04
T1
189.31
±0.05
T2
191.76
±0.02
T3
187.21
±0.01
**
a
c
d
b
a
b
113.98
±0.06
c
d
a
c
114.89
±0.11
b
114.99
±0.07
a
c
115.21
±0.08
b
112.16
±0.21
112.25
b
±0.05
112.63
±0.21
112.12
b
±0.05
113.73
±0.23
*
*
*
a
187.95
±0.01
a
189.93
±0.02
b
192.04
±0.01
a
189.12
±0.03
*
a
186.31
±0.04
c
191.43
±0.02
d
193.96
±0.01
b
189.56
±0.01
**
112.29
±0.04
a
a
187.03
±0.03
a
187.03
±0.03
195.10
±0.02
189.52
±0.01
**
d
b
**Shows Significance at 1% level as compared to control group (P<0.01)
*Shows Significance at 5% level as compared to control group (P<0.05)
1078
d
c
a
b
c
8.73
±0.05
b
9.52
±0.05
9.63
±0.02
b
8.69
±0.02
**
132.74
±0.29
c
c
d
c
a
8.32
±0.05
8.70
±0.04
9.46
±0.01
8.63
±0.01
**
122.64
±0.27
a
b
d
240
Days
8.21
±0.01
8.41
±0.05
9.42
±0.04
8.33
±0.01
**
131.59
±0.25
a
b
9.42
±0.04
210
Days
8.16
±0.02
8.38
±0.01
b
8.42
±0.01
**
129.86
±0.23
a
c
d
180
Days
8.09
±0.02
8.57
±0.02
9.30
±0.004
8.40
±0.05
**
125.54
±0.63
a
c
c
150
Days
7.93
±0.01
8.87
±0.03
9.35
±0.01
113.58
±0.81
Glucose (mg/dl)
T0
a
b
b
120
Days
7.90
±0.02
8.65
±0.16
T1
T3
90
Days
7.05
±0.02
d
T2
Total cholesterol
(mg/dl)
T0
60
Days
b
8.47
±0.14
**
133.79
±0.29
a
c
115.91
±0.08
b
8.51
±0.04
**
a
136.94
±0.19
113.11
±0.03
a
b
a
134.19
±0.29
b
116.71
±0.08
a
113.87
±0.23
112.89
a
±0.07
114.33
±0.23
113.12
a
±0.05
114.47
±0.13
114.01
b
±0.07
114.93
±0.23
114.12
a
±0.07
*
*
**
**
a
187.03
±0.03
c
195.16
±0.01
d
195.32
±0.01
b
189.52
±0.01
**
189.72
±0.05
195.46
±0.04
196.01
±0.14
190.92
±0.05
**
b
c
d
b
a
184.24
±0.01
c
195.12
±0.02
d
196.44
±0.01
b
191.24
±0.02
**
a
190.74
±0.01
c
195.64
±0.01
d
196.72
±0.02
b
191.25
±0.02
*
Int.J.Curr.Microbiol.App.Sci (2019) 8(9): 1072-1084
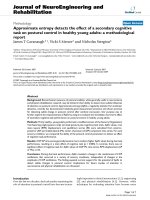
Fig.1 Graph showing effect of germinated maize on calcium (mg/dl) in kadaknath
The value with the different superscripts in a row are different significantly between groups. The
value with the no superscripts in a row are having no significant relationship
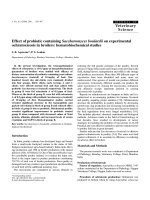
Fig.2 Graph showing effect of germinated maize on phosphrus (mg/dl) in kadaknath
The value with the different superscripts in a row are different significantly between groups. The
value with the no superscripts in a row are having no significant relationship.
1079
Int.J.Curr.Microbiol.App.Sci (2019) 8(9): 1072-1084
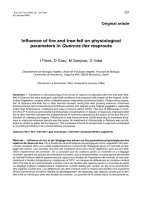
Fig.3 Graph showing effect of germinated maize on ALP (IU/L) in kadaknath
Fig.4 Graph showing effect of germinated maize on ACP (IU/L) in kadaknath
The value with the different superscripts in a row are different significantly between groups. The
value with the no superscripts in a row are having no significant relationship
1080
Int.J.Curr.Microbiol.App.Sci (2019) 8(9): 1072-1084
Fig.5 Graph showing effect of germinated maize on Total protein (g/dl) in kadaknath
Fig.6 Graph showing effect of germinated maize on Total protein (g/dl) in kadaknath
1081
Int.J.Curr.Microbiol.App.Sci (2019) 8(9): 1072-1084
Fig.7 Graph showing effect of germinated maize on glucose (mg/dl) in kadaknath
Similar observations were also reported by
Singh and Khatta (2003), Jain (2008), Osman
(2009), Prajapati (2010), Kwari et al., (2012),
Jamre (2015), Gautam et al., (2017), and Khan
et al., (2017).
Acid and Alkaline Phosphatase
The present study revealed that there was a
significant (p<0.05) decrease in plasma
alkaline phosphatase after 30, 60 and 90 days
and acid phosphatase after 30 days, and in
remaining days the activities of these enzymes
were highly significant (P<0.01) in all the
treated groups. This decrease in acid and
alkaline phosphatase enzymes may indicated
that sprouted grains given to Kadaknath chicks
may increase the activity of some enzymes
like phytase, resulted in increased plasma
concentration of phosphorus and calcium
through liberation of phosphorus, bivalent and
trivalent ions, which are readily available to
the chicks. All the results reported in the
present study were in accordance with the
observations reported by Viveros et al.,
(2002), Fanimo and Akinola (2006), Jain
(2008), Prajapati (2010), Jamre (2015),
Gautam et al., (2017) and Khan et al., (2017).
In contrast non significant effect was noted by
Onifade et al., (1999). Orban et al., (1999)
observed that the phosphorus excretion was
very much decreased and the phytate
phosphorus
utilization
was
increased
significantly.
Total proteins,
glucose
Total
cholesterol
and
The present study revealed a highly significant
(p<0.01) increase in the level of serum total
protein in the entire period of the present study
but the levels of total cholesterol was
significant (p<0.05) decrease in all days of
treatment except 210 and 240 days, where the
decrease was highly significant (p<0.01).
Certain workers (Lee et al., 2010, Demonty et
al., 2003) showed that the reduction of the
blood’s
total
and
LDL
cholesterol
concentrations with the consumption of
products that contain soy protein has been
shown repeatedly in humans and several
animal models The exact component that is
1082
Int.J.Curr.Microbiol.App.Sci (2019) 8(9): 1072-1084
responsible for this action has yet to be
identified. Isoflavone have been proposed to
be the active ingredient that is responsible for
the hypocholesterolemic effects of soy. One of
the study suggested that isoflavonerich soy
protein is considerably more effective than
isoflavone-depleted soy protein, though this
finding is controversial. The cholesterollowering effect is one of several proposed
mechanisms by which soy reduces the risk of
heart disease (Gardner et al., 2001). During
germination protease enzymes are activated
that convert the protein polymers into amino
acids and small peptides (Shewry et al., 1995).
These enzymes convert the complex
compounds of protein into albumin and
globulin thus, improve the quality protein.
They also improve the lysine content of grains
(Chavan and Kadam, 1989). Activation of
amylase and lipase during germination
increases the sugar and essential fatty acid
content of grains (Chavan and Kadam, 1989).
The glucose concentrations were highly
significant (p<0.01) of the entire study period
in germinated maize supplemented group
except on Days 60 and 240 where it was
significant at p<0.05. The observations for
total proteins, total cholesterol and glucose in
the present study were in accordance with the
findings of El-Deek et al., (2009), Osman
(2009), Lee et al., (2010), Gautam et al.,
(2017) and Khan et al., (2017). On the
contrary, Jain (2008), Manwar and mandal
(2009) and Prajapati (2010) found no
significant effect on the above parameters in
treated groups as compare to control.
From the present study, it is concluded that
supplementation of germinated maize in feed
of kadaknath layer birds had very good effect
on availability of protein, calcium, and
phosphorus, along with certain enzymes and
also there was a decreasing trend in total
cholesterol, specially at the level of 50% and
75% germinated maize as compared to the
non-germinated
maize
based
diets.
Germination of grains may cause activation of
different enzymes eg. protease, which convert
the protein polymers into amino acid and
small peptides. They may also improve the
lysine content of grains and make feed more
nutritive and palatable to Kadaknath. Phytase
made available the bi and tri- valant ions like
calcium and phosphorus and beta glucanase
affects the availability of energy by fiber
digestion.
References
Chavan, J. and Kadam, S.S. (1989). Nutritional
improvement of cereals by sprouting. Critical
Reviews in Food Science and Nutrition, 28(5):
401-437.
Demonty, I., Benoit L., and Peter JH Jones. (2003)
Role
of
Isoflavones
in
the
Hypocholesterolemic Effect of Soy. Nutrition
Reviews 61(6):189-203.
El-Deek, A.A., Osman, M., Yakout, H.M. and
Yahya, E. (2009). Response of broilers to
microbial phytase supplementation as
influenced by dietary corn gluten meal levels.
Egyptian Poultry Science, 29(1):77-97
Fanimo, A.O. and Akinola, O.S. (2006). Response of
broiler chicken to raw and processed malted
sorghum sprout Department of Animal
Production and Health, University of
Agriculture, P.M.B. 2240, Abeokuta, Nigeria.
Gardner, C. D., Newell, K.A., Cherin, R and Haskell,
W. (2001) The effect of soy protein with or
without isoflavones relative to milk protein on
plasma lipids in hypercholesterolemic
postmenopausal women. American Journal of
Clinical Nutrition, 73 (4): 728–735.
Gautam. M., Jain, A., Shakkarpude, J., Kushwah,
M.S., and Jamre, B. (2017). Effect of
germinated sorghum based diet at different
levels on biochemical parameters in broilers.
International Journal of Advance Biological
Research, 7(1): 116-118.
Jain, A. (2008). Biochemical and haematological
parameters in broilers. Indian Journal
Animal Nutrition, 25(3):285-287.
Jamre, B. (2015). Evalution of diet containing
germinated maize and multienzyme complex
on growth and production performance of
broilers. M.V.Sc & A.H.Thesis. (Veterinary
1083
Int.J.Curr.Microbiol.App.Sci (2019) 8(9): 1072-1084
Physiology), Nanaji Deshmukh Veterinary
Science University,Jabalpur (M.P).
Khan,M.A., Jain, Archana, Shakkarpude, J., Mehta,
M.K., Kushwah M.S. & Chouhan, Laxmi
(2017) Effect of germinated maize and
sorghum based diet at different levels on
biochemical parameters in kadaknath.
International Journal of Advance Biological
Research, 7 (3): 552-555.
Kwari, I.D., Diarra, S.S., Igwebuike, J.U., Nkama, I.,
Issa, S., Hamaker, B.R., Hancock, J.D., Jauro,
M., Seriki, O.A. and Murphy, T. (2012).
Replacement value of low tannin Sorghum
(Sorghum bicolor) for maize in Broiler
chickens diet in the semi arid zone of Nigeria.
International Journal Poultry Science, 11:
333-337.
Lee, D.W., Shin, J.H., Park, J.M., Song, J.C., Suh,
H.J., Un-Jae Chang, U.J., Kang, C.W., and
Kim, J.M., (2010). Growth Performance and
Meat Quality of Broiler Chicks Fed
Germinated and Fermented Soybeans. Korean
Journal of Food Science Animal Resources,
30 (6): 938-945.
Manwar, S.J. and Mandal, A. B. (2009). Effect of
reconstitution of sorghum with or without
enzymes on production performance and
immunocompetence in broiler chicken.
Journal of the Science of Food and
Agriculture, 89(6):998-1005.
Onifade, A. A., Obiyan, R. I., Onipede, E., Adejumo,
D. O., Abu, O. A. and Babatunde, G. M.
(1999). Assessment of the effect of
supplement rabbit diets with a culture of
Saccharomyces cerevisiae using performance,
blood composition and clinical enzymes
activities. Animal Feed Science Technology,
77:25-32.
Orban J. I., Adeola, O. and Stroshine, R.(1999)
Microbial phytase in finisher diets of White
Pekin ducks: Effects on growth performance,
plasma phosphorus concentration, and leg
bone characteristics. Poultry Science. 78 :
366- 377.
Osman, A.H.E. (2009). Effect of multi enzyme
supplementation and grain source on broiler
performance and carcass quality. Animal
Production Science and Technology, 70:2829.
Panda, B., and S. C. Mahapatra. (1989). Common
breeds of poultry. Pages 6–18 in Poultry
Production. ICAR, New Delhi, India.
Prajapati, R.S. (2010). Studies on phytase
supplementation on growth performance and
haemato-biochemical parameters in broilers.
M.V.Sc & A.H. Thesis (Veterinary
Physiology), Rajmata Vijayaraje Scindia
Krishi Vishwa Vidyalaya Gwalior.
Rao, G. V. and Thomas, P. C. (1984). The breed
characteristics of Kadaknath breed of
indigenous (Desi) chicken; Avian Research,
68: 55-57.
Shewry, Peter R., Johnathan A. Napier, and Arthur S.
Tatham (1995) Seed Storage Proteins:
Structures 'and Biosynthesis. The Plant Cell,
7: 945-956.
Singh, P.K. and Khatta, V.K. (2003). Effect of
phytase supplementation on the performance
of broiler chicken fed wheat based diets.
Indian Journal Animal Nutrition, 20:57-62.
Snedecor, G.W. and Cochran,W.G. (1994).
Statistical Methods, 8th Edn., lowa state
University press. Ames Iowa, 503 p.
Viveros, A., Brenes, A., Arija, I. and Centeno, C.
(2002). Effects of microbial phytase
supplementation on mineral utilization and
serum enzyme activities in broiler chicks fed
different levels of phosphorus. Poultry
Science, 81: 1172-1183.
How to cite this article:
Akhelesh Kumar Karoriya, Archana Jain, M. K. Mehta, Chouhan, Laxmi, Kumar, Rakesh and
Shakkarpude, J. 2019. Effect of Germinated Maize Based Diets on Biochemical Parameters in
Kadaknath. Int.J.Curr.Microbiol.App.Sci. 8(09): 1072-1084.
doi: />
1084