Sulphur fractionation studies in soils of long term fertilizer experiment under finger millet – Maize cropping sequence
Bạn đang xem bản rút gọn của tài liệu. Xem và tải ngay bản đầy đủ của tài liệu tại đây (503.01 KB, 12 trang )
Int.J.Curr.Microbiol.App.Sci (2019) 8(9): 1334-1345
International Journal of Current Microbiology and Applied Sciences
ISSN: 2319-7706 Volume 8 Number 09 (2019)
Journal homepage:
Original Research Article
/>
Sulphur Fractionation Studies in Soils of Long Term Fertilizer Experiment
under Finger Millet – Maize Cropping Sequence
K. R. Lavanya1*, G. G. Kadalli1, Siddaram Patil1, T. Jayanthi1,
D. V. Naveen2 and R. Channabasavegowda1
1
Department of Soil Science and Agril. Chemistry, College of Agriculture,
UAS, GKVK, Bengaluru, India
2
Department of Soil Science and Agril. Chemistry, College of Sericulture, UAS (B),
Chintamani, India
*Corresponding author
ABSTRACT
Keywords
Long term fertilizer,
manuring, Sulphur
Fractions,
Article Info
Accepted:
15 August 2019
Available Online:
10 September 2019
The long term field experiment has been in progress since 1986 at GKVK,
Bengaluru with finger millet – hybrid maize cropping sequence. Eleven treatments
were replicated four times in RCBD. The archived soil samples (1986 – 2016)
from this experiment were collected at five years interval and studied for different
fractions of sulphur. The fractions of sulphur were in the order of
organic>residual>inorganic>water soluble> available forms. All fractions of S
showed an increasing trend over 30 years of cropping cycles in all the treatments.
However, the treatments which did not receive any source of sulphur decreased
initially (1991) in all S fractions and then increased gradually over the years and
maintained slightly higher over the initial. All forms of S were maintained
significantly higher over other treatments and found on par with each other in the
treatments receiving 100 % NPK + FYM + lime, 100 % NPK + FYM and in 150
% NPK. They found lower in the treatments receiving sulphur free fertilizers
(DAP as P source) and imbalanced supply of nutrients. Hence, application of
recommended doses of fertilizers (SSP as P source) in combination with FYM is
essential in maintaining available sulphur nutrient status and soil health.
Introduction
Sulphur is one of the seventeen essential
elements and the fourth most important
nutrient for crop production after nitrogen,
phosphorus and potassium. The sulphur
deficiency is widespread in Indian soils and it
has been emerging as major limitation in
increasing crop production and productivity.
Intensive cultivation with high yielding
varieties of crops and application of high rates
of fertilizers devoid of secondary nutrients
resulted in depletion of secondary nutrients
especially sulphur reserve of soil at faster rate.
1334
Int.J.Curr.Microbiol.App.Sci (2019) 8(9): 1334-1345
Much of the soil sulphur is present in organic
forms in soil. Sulphur is found in several
oxidation states which readily undergo
transformation
by
chemical
and
microbiological processes (Trudinger et al.,
1975). Not surprisingly, sulphur in soils
occurs in many distinct forms such as water
soluble, available, inorganic, organic and total
sulphur. The nature and amount of various
forms of S depends on soil texture, pH,
calcium carbonate, organic matter and other
characteristics (Xiao et al., 2015). The
availability of sulphur in a soil is not only
influenced by management practices but also
depends upon various forms of sulphur present
as these different forms of sulphur exist in
dynamic equilibrium in soil (Azmi et al.,
2018). Hence, the present study was
undertaken to assess the status of different
forms of sulphur under long term manurial
and fertilization experiments.
The treatments include different levels of
NPK, FYM, lime and with and without
sulphur source. The treatment details with
NPK dosages and fertilizer sources are given
in Table 2. Urea, single super phosphate (SSP)
and muriate of potash (MOP) were used as
sources of N, P and K, respectively for all
treatments except S free treatment (T9)
wherein Di-ammonium phosphate (DAP) was
used as a source of P instead of SSP. The 50
% N and 100 % PK were applied as basal and
remaining 50 % N was top dressed in two
equal splits at 30 and 60 DAS for both finger
millet and maize crops. In lime treated plots,
the lime (CaCO3) was applied based on lime
requirement following the method given by
Shoemaker et al., (1961) during kharif season.
If the pH is more than 6.00 then lime was
applied @ 200 kg ha-1. Farmyard manure
(FYM) at the rate of 15 t ha-1 is incorporated
into the soil 10-15 days prior to sowing of the
kharif crop.
Materials and Methods
Estimation of sulphur fractions
The long term field experiment has been in
progress since 1986 at Zonal Agricultural
Research Station of University of Agricultural
Sciences, GKVK, Bengaluru located in
Eastern Dry Zone of Karnataka with finger
millet – hybrid maize cropping sequence. The
experiment consists of eleven treatments with
four replications in randomized complete
block design (RCBD) having individual plot
size of 16 m x 9 m. Out of four replications
only three replications were selected for this
study. Finger millet and hybrid maize crops
were grown in sequence during Kharif and
Rabi seasons, respectively. The soil of the
experimental site is classified as fine, mixed
Isothermic Kandic Paleustalfs of Vijayapura
series. It is slightly acid with sandy clay loam
in texture and sufficient in available sulphur
content (20.34 mg kg-1). The physicochemical properties of initial soil sample
(1986) of the experimental site are given in
table 1.
The soil samples have been collected from
LTFE plots every year after harvest of maize
crop since from 1986 to 2016 (30 years). For
the present study, these archived soil samples
were collected at five years interval (initial1986, 1991, 1996, 2001, 2006, 2011 and 2016)
and analysed for different fractions of sulphur
by sequential extraction as outlined by Azmi
et al., 2018.
Water soluble sulphur
Five grams of soil was extracted with 25 ml
of distilled water (1:5 soil : water ratio) and it
was shaken for about 10 minutes, centrifuged
and filtered.
Available sulphur
The soil residue obtained after extraction of
water soluble sulphur was treated with 25 ml
1335
Int.J.Curr.Microbiol.App.Sci (2019) 8(9): 1334-1345
of 1% NaCl solution and the content was
shaken for half an hour and then centrifuged
and filtered.
Inorganic sulphur
Inorganic sulphur was extracted by adding 25
ml of 1% HCl solution to the soil residue
obtained from previous extraction, shaking it
for 10 minutes, centrifuged and filtered. The
soil was then made chloride free by leaching it
with distilled water.
Organic sulphur
The residue from the HCl extraction (2 g oven
dried) was treated with H2O2 until the
effervescence stops, it was centrifuged and
filtered.
Total sulphur
Total sulphur content was determined
separately by acid digestion method as per the
procedure given by Tabatabai (1982). Five
gram of finely ground soil was mixed with 3
ml of 69 per cent HNO3 and heated on steam
bath. Then, 3 ml of 60 per cent HClO4 and 7
ml of H3PO4 were added and heated on sand
bath at 190-210ºC until white fumes were
visible. Two ml of 37 per cent HCl was added
after cooling and heated again until white
fumes visible. The digest was transferred
quantitatively and volume was adjusted to
100 ml using 1N HCl.
Residual sulphur
The residual fraction of soil S represents the
unaccounted S not extracted by any of the
previous sequential extractants, hence, this
fraction was calculated from the difference
between total S and sum of all fractions.
After extraction of different fractions, sulphur
in the different extracts was estimated
turbidometrically (Chesnin and Yien, 1951).
The data collected from experiment were
subjected to statistical analysis as described by
Gomez and Gomez (1984). The level of
significance used in “F” and “t” test was P =
0.05. Critical difference (CD) values were
calculated for the P = 0.05 whenever “F” test
was found significant.
Results and Discussion
Different fractions of sulphur in soil
significantly varied due to long term manuring
and fertilization over the years at five years
interval and the data are presented in tables 3
to 8 and fig. 1.
Water soluble sulphur (WS-S)
Water soluble sulphur content in soil showed
increasing trend over years in all the
treatments except in T9 and T7 (Table 3).
However, extent of increase was found
maximum in T10 (from 11.28 to 31.28 mg kg1
) followed by T8 (from 11.26 to 31.24 mg kg1
) which received FYM + lime in T10 and
FYM in T8 along with 100 % NPK fertilizer.
This indicate that continuous application of
FYM along with single super phosphate as P
source increased the WS- S content over years
and maintained higher compared to other
treatments. This might be due to the release of
sulphur from organic source and SSP which is
soluble in water. Similarly Scherer et al.,
(2012) investigated the effect of long-term
application of inorganic fertilizers, farmyard
manure, compost and sewage sludge and
reported that FYM and compost had positive
effect as compared to inorganic fertilizer alone
on different fractions of sulphur in soil.
Significantly lower water soluble sulphur
content in soil was observed over the years in
treatment T9 (11.28 to 8.32 mg kg-1) followed
by T7 (11.31 to 9.08 mg kg-1) and T11 (11.29
to 15.42 mg kg-1) treatments. All these three
1336
Int.J.Curr.Microbiol.App.Sci (2019) 8(9): 1334-1345
treatments did not receive any S source
indicating continuous cropping without supply
of sulphur nutrient decreases the soil sulphur
nutrient reserve over the years. Among these
three treatments, T11:Control treatment
maintained slightly higher content of water
soluble sulphur compared to T9 and T7. This
might be due to higher biomass production
which in turn resulted in higher uptake of S
over the years in T9 and T7 compared to
control T11 treatment.
Available sulphur (SO4 –S or NaCl-S)
Available sulphur content in soil showed
increasing trend over the years in all the
treatments except in T9, T7 and T11 (Table 4).
The extent of increase over years was found
maximum in T10 (from 9.06 to 29.24 mg kg-1)
followed by T3 (from 9.06 to 28.60 mg kg-1)
which received 100 % NPK + FYM + lime
and 150 % NPK, respectively. And these two
treatments recorded significantly higher
available sulphur content compared to other
treatments indicating continuous application
of higher dose of S through SSP or 100 %
RDF (SSP as P source) in combination with
FYM helped in buildup of SO4-S in the soil
over the years. The results of present study are
also in conformity with the findings of Setia
and Sharma (2005) who have recorded higher
available sulphur content in the long term
fertilized soils under maize-wheat cropping
system in treatment which received higher
amount of single superphosphate. Similar
results were also reported by Sharma and
Jaggi (2001), Bhatnagar et al., (2003) and
Mazur and Mazur (2015). Nguyen and Goh
(1990) reported that in the soils receiving long
term super phosphate, CaCl2- extractable soil
S increased over the years of pasture
development, but the rate of increase
decreased with time.
Like WS-S, the available sulphur content was
also recorded significantly lower in treatments
with continuous application sulphur free
phosphatic fertilizer (DAP) (T9) and treatment
with only 100 per cent N (T7) and in control
(T11). In these treatments, there was decrease
in available S content initially (1991) and then
increased gradually over the years and
maintained slightly higher over the initial soil
S content. Decrease in the available S content
initially was due to higher removal of native
sulphur by the crop as the biomass production
was reported to be higher initially (Anon,
1992). Later gradual build up was due to
lower biomass production and in turn lower
uptake of native S compared to the rate of S
mineralization from the soil (Anon, 2017).
Sahoo et al., (1998) reported that continuous
cultivation of crops without addition of plant
nutrients had decreased the available sulphur
in the soil due to crop removal of native
sulphur.
Inorganic sulphur (HCl-S)
The amount of inorganic sulphur in soil
showed increasing trend over the years in all
the treatments. However, in T9, T7 and T11
treatments, there was decrease in inorganic S
content initially (1991) and then increased
gradually over the years and maintained
slightly higher over the initial soil S content
(Table 5). The extent of increase over 30 years
was found maximum in T3 (from 15.72 to
35.42 mg kg-1) followed by T10 (from 15.76 to
34.82 mg kg-1) which received 150 % NPK
and 100 % NPK + FYM + lime, respectively.
This fraction also found significantly higher in
these treatments compared to other treatments
indicating continuous application of higher
dose of S through SSP or 100 % RDF (SSP as
P source) in combination with FYM helped in
buildup of HCl-S in the soil over the years.
1337
Int.J.Curr.Microbiol.App.Sci (2019) 8(9): 1334-1345
Table.1 Initial physico-chemical properties of initial soil sample of study site (1986)
Sl. No.
1
2
3
4
5
6
7
8
9
10
11
12
Soil property
Particle size analysis
a. Sand (%)
b. Silt (%)
c. Clay (%)
Soil textural class
Bulk Density (Mg kg-1)
pH (1:2.5 soil:water suspension)
Electrical conductivity (dS m-1)
Organic carbon (%)
Cation exchange capacity [c mol (p+) kg-1]
Available nitrogen (kg N ha-1)
Available phosphorus (kg P2O5 ha-1)
Available potassium (kg K2O ha-1)
Available sulphur (mg kg-1)
Exchangeable calcium [c mol (p+) kg-1]
Exchangeable magnesium [c mol (p+) kg-1]
Value
62.00
8.60
29.40
Sandy clay loam
1.51
6.17
0.059
0.60
12.20
256.70
34.30
123.10
20.34
3.25
1.55
Table.2 Treatments details of long term fertilizer experiment
NPK dosage (kg ha-1)
Finger millet Hybrid maize
50 – 11 – 21
50 – 16 – 41
T1: 50 % NPK
100 – 22 – 42 100 – 32 – 82
T2: 100 % NPK
150 – 33 – 63 150 – 48 – 123
T3: 150 % NPK
T4: 100 % NPK +Hand Weeding 100 – 22 – 42 100 – 32 – 82
100 – 22 – 42 100 – 32 – 82
T5: 100 % NPK + lime
100 – 22 – 00 100 – 32 – 00
T6: 100 % NP
100 – 00 – 00 100 – 00 – 00
T7: 100 % N
100 – 22 – 42 100 – 32 – 82
T8: 100 % NPK + FYM
100 – 22 – 42 100 – 32 – 82
T9: 100 % NPK (S-free)
100 – 22 – 42 100 – 32 – 82
T10: 100 % NPK + FYM + lime
Treatments
T11: Control
00 – 00 – 00
00 – 00 – 00
Fertilizer source
Urea, SSP, MOP
Urea, SSP, MOP
Urea, SSP, MOP
Urea, SSP, MOP
Urea, SSP, MOP, lime
Urea, SSP
Urea
Urea, SSP, MOP
Urea, DAP, MOP
Urea, SSP, MOP, lime
…………..
Note: Chemical weeding was followed in all treatments except T4
1338
Int.J.Curr.Microbiol.App.Sci (2019) 8(9): 1334-1345
Table.3 Effect of long term manuring on water soluble sulphur content in soil over the years
from 1986 to 2016 at five years interval.
Treatments
1986
1991
1996
T1: 50 % NPK
T2: 100 % NPK
T3: 150 % NPK
T4: 100 % NPK + HW
T5: 100 % NPK + lime
T6: 100 % NP
T7: 100 % N
T8: 100 % NPK + FYM
T9: 100 % NPK (S-free)
T10: 100 % NPK + FYM + lime
T11: Control
SEm±
CD @ 5 %
11.28
11.24
11.30
11.26
11.27
11.28
11.31
11.26
11.28
11.28
11.29
0.40
NS
13.82
21.34
24.86
21.67
23.35
19.81
7.73
25.20
6.86
25.38
11.68
0.67
1.98
15.12
23.62
25.32
23.16
24.54
21.18
8.02
26.68
7.24
26.87
12.62
0.71
2.10
2001
mg kg-1
16.84
25.12
27.84
25.62
27.42
23.06
8.48
30.52
7.68
28.92
13.78
0.78
2.31
2006
2011
2016
17.67
26.12
28.34
26.42
28.94
24.82
8.82
30.74
8.26
31.48
14.24
0.82
2.43
18.67
28.63
31.06
27.04
29.43
28.72
9.29
31.96
8.74
33.87
16.37
0.88
2.59
20.36
27.02
30.24
26.12
29.85
27.24
9.08
31.24
8.32
31.28
15.42
0.86
2.52
Table.4 Effect of long term manuring on available sulphur content in soil over the years from
1986 to 2016 at five years interval
Treatments
1986
1991
T1: 50 % NPK
T2: 100 % NPK
9.08
9.11
T3: 150 % NPK
T4: 100 % NPK + HW
2011
2016
11.26
15.24
2001
2006
-1
mg kg
13.34 15.14 16.25
17.42 21.31 20.31
17.85
22.46
20.29
22.50
9.06
9.05
20.82
16.78
22.86
18.21
26.78
22.33
25.53
23.25
31.92
24.57
28.60
22.21
T5: 100 % NPK + lime
T6: 100 % NP
9.12
9.08
18.24
20.68
20.84
21.78
24.83
25.89
24.86
28.46
21.04
22.14
25.31
23.92
T7: 100 % N
T8: 100 % NPK + FYM
9.15
9.06
6.12
16.82
6.86
18.54
7.58
22.72
7.63
25.44
13.16
24.32
10.13
27.88
T9: 100 % NPK (S-free)
T10: 100 % NPK + FYM + lime
9.11
9.06
5.98
19.72
6.12
22.12
6.34
26.39
7.32
28.83
9.92
29.14
9.83
29.24
T11: Control
9.08
0.007
NS
6.58
0.54
1.58
6.32
0.59
1.75
6.79
0.70
2.07
8.25
0.74
2.17
10.41
0.64
1.89
11.85
0.78
2.29
SEm±
CD @ 5 %
1339
1996
Int.J.Curr.Microbiol.App.Sci (2019) 8(9): 1334-1345
Table.5 Effect of long term manuring on inorganic sulphur content in soil over the years from
1986 to 2016 at five years interval
Treatments
1986
1991
1996
T1: 50 % NPK
T2: 100 % NPK
T3: 150 % NPK
T4: 100 % NPK + HW
T5: 100 % NPK + lime
T6: 100 % NP
T7: 100 % N
T8: 100 % NPK + FYM
T9: 100 % NPK (S-free)
T10: 100 % NPK + FYM + lime
T11: Control
SEm±
CD @ 5 %
15.71
15.76
15.72
15.69
15.74
15.73
15.72
15.77
15.75
15.76
15.76
0.55
NS
18.42
23.82
28.82
23.12
26.12
22.14
15.89
26.86
15.22
27.12
16.84
0.79
2.34
20.18
26.18
31.86
25.62
27.86
26.24
16.28
29.24
15.64
30.72
17.28
0.87
2.56
2001
mg kg-1
22.64
29.24
32.84
28.86
28.24
27.08
16.68
29.74
16.27
31.14
17.87
0.90
2.65
2006
2011
2016
24.82
29.86
33.12
29.12
30.46
27.74
17.02
31.54
16.34
32.86
18.34
0.94
2.78
25.16
30.92
33.86
30.52
31.68
28.12
17.83
32.68
16.88
33.08
18.76
0.97
2.85
25.86
31.84
35.42
31.76
34.72
32.78
18.28
33.49
17.32
34.82
19.68
1.02
3.02
Table.6 Effect of long term manuring on organic sulphur content in soil over the years from
1986 to 2016 at five years interval
Treatments
1986
1991
1996
T1: 50 % NPK
T2: 100 % NPK
T3: 150 % NPK
T4: 100 % NPK + HW
T5: 100 % NPK + lime
T6: 100 % NP
T7: 100 % N
T8: 100 % NPK + FYM
T9: 100 % NPK (S-free)
T10: 100 % NPK + FYM + lime
T11: Control
SEm±
CD @ 5 %
212.63
212.78
213.84
212.42
214.85
211.41
212.22
213.03
213.74
213.19
213.51
7.49
NS
216.07
218.09
220.52
219.00
220.22
216.88
214.04
220.93
211.01
221.33
214.93
7.64
NS
228.27
217.82
228.90
220.82
226.57
216.38
211.62
232.75
209.64
234.64
217.84
7.44
21.95
1340
2001
mg kg-1
220.00
224.17
225.18
224.37
225.38
222.55
219.31
239.07
215.16
239.82
219.41
6.82
20.13
2006
2011
2016
222.43
226.60
227.61
227.41
226.60
224.17
220.93
240.65
216.47
239.31
220.52
6.83
20.15
223.97
228.62
230.24
229.64
229.35
227.31
222.55
245.17
218.30
241.90
222.47
6.94
20.48
228.02
229.64
233.69
231.05
232.07
230.45
222.95
246.37
219.92
244.91
223.97
6.94
20.47
Int.J.Curr.Microbiol.App.Sci (2019) 8(9): 1334-1345
Table.7 Effect of long term manuring on residual sulphur content in soil over the years from
1986 to 2016 at five years interval
Treatments
1986
1991
1996
T1: 50 % NPK
T2: 100 % NPK
T3: 150 % NPK
T4: 100 % NPK + HW
T5: 100 % NPK + lime
T6: 100 % NP
T7: 100 % N
T8: 100 % NPK + FYM
T9: 100 % NPK (S-free)
T10: 100 % NPK + FYM + lime
T11: Control
SEm±
CD @ 5 %
33.95
33.92
33.88
33.96
34.02
33.95
33.98
33.94
33.96
33.98
33.98
1.192
NS
34.86
36.24
37.54
36.52
36.78
35.24
33.12
37.22
31.74
36.47
33.16
1.238
3.65
35.68
37.28
38.24
37.34
43.23
37.12
33.67
39.43
32.68
35.5
33.6
1.274
3.76
2001
mg kg-1
37.82
38.42
39.38
38.68
38.37
38.48
33.99
40.13
33.12
37.12
34.16
1.303
3.84
2006
2011
2016
39.78
39.06
41.28
39.72
39.87
39.11
34.77
39.27
33.64
39.39
34.74
1.344
3.96
42.37
40.24
43.74
40.62
41.28
39.48
35.12
41.4
34.28
42.54
35.62
1.402
4.14
43.18
42.78
45.68
42.53
43.78
42.16
35.68
43.84
34.72
43.79
36.38
1.455
4.29
Table.8 Effect of long term manuring on total sulphur content in soil over the years from 1986 to
2016 at five years interval
Treatments
1986
1991
1996
2001
2006
2011
2016
-1
T1: 50 % NPK
mg kg
273.69 294.43 312.59 312.44 320.95 328.02 337.71
T2: 100 % NPK
285.88 314.73 322.32 338.26 341.95 350.87 353.78
T3: 150 % NPK
277.11 332.56 347.18 352.02 355.88 370.82 373.63
T4: 100 % NPK + HW
282.10 317.09 325.15 339.86 345.92 352.39 353.67
T5: 100 % NPK + lime
271.05 324.71 343.04 344.24 350.73 352.78 365.73
T6: 100 % NP
286.01 314.75 322.70 337.06 344.30 345.77 356.55
T7: 100 % N
287.17 276.90 276.45 286.04 289.17 297.95 296.12
T8: 100 % NPK + FYM
275.30 327.03 346.64 362.18 367.64 375.53 382.82
T9: 100 % NPK (S-free)
286.33 270.81 271.32 278.67 282.03 288.12 290.11
T10: 100 % NPK + FYM + lime
289.40 330.02 334.85 363.39 371.89 375.53 384.04
T11: Control
273.78 283.19 296.66 292.01 296.09 303.63 307.30
SEm±
9.81
10.80
11.20
10.81
9.82
12.66
11.67
CD @ 5 %
NS
31.85
33.04
31.90
28.96
37.36
34.42
1341
Int.J.Curr.Microbiol.App.Sci (2019) 8(9): 1334-1345
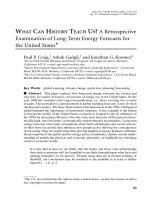
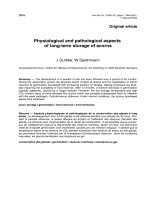
Fig.1 Effect of long term manuring on different sulphur fractions content in soil over the years
from 1986 to 2016 at five years interval.
1342
Int.J.Curr.Microbiol.App.Sci (2019) 8(9): 1334-1345
Increase in inorganic sulphur content was
found to be minimum in treatment T9 (15.75 to
17.32 mg kg-1) which received S free
phosphatic fertilizer (DAP) followed by T7
(15.72 to 18.28 mg kg-1) which received only
100 % N and control (15.76 to 19.68 mg kg-1).
Addition of only nitrogenous fertilizer to soil
favoured solubilisation of the sulphate that
was co-precipitated with CaCO3 and the
solubilized sulphate was partly transformed
into soluble organic form (Hu et al.,
2005).The results were in conformity with the
observations recorded by Sharma et al.,
(2014), who showed that zero fertilization led
to decline in the levels of all S forms, while
application of sulphur containing fertilizer and
organics increased it over control. This might
be due to release of sulphur from inorganic
and organic S sources applied to different
treatments and the treatments which recorded
lower inorganic sulphur was due to continuous
crop removal without addition of any S source
and conversion of inorganic form of sulphur to
sulphate sulphur.
Organic sulphur in soil
The data in table 6 indicates that organic S
was the major fraction of S in soil whose
extent and distribution was further increased
with continuous use of S through SSP and
FYM organic manure. Organic sulphur
content in soil showed increasing trend over
30 years in all the treatments. The extent of
increase over the years was found maximum
in T8 (from 213.03 to 246.37mg kg-1) followed
by T10 (from 213.19 to 244.91 mg kg-1) which
received both FYM and 100 % NPK
indicating the distribution of organic sulphur
in these soils is mainly influenced by the
organic matter treatment. The results were in
conformity with the observations recorded by
Jat and Yadav (2006).
Organic sulphur content was significantly
lower and increase was minimum over the
years in the treatment T9 (213.74 to 219.92 mg
kg-1) which received S free P fertilizer (DAP)
followed by T7 (212.22 to 222.95 mg kg-1)
which received only 100 % N and in control
(213.51 to 223.97). Organic sulphur content
recorded lower values in the treatments which
received sulphur free and imbalance nutrient
supply. The extent of increase was minimum
in the treatments received imbalanced
fertilizer application might be due to the
conversion of sulphur from organic form of
sulphur to available sulphur through
mineralization of S from soil organic matter,
less plant root biomass addition (McLaren and
Cameron, 2004). Similarly, declining pattern
of organic S with the decrease in organic
matter application to soil reported by Kumar
et al., (2002).
Residual sulphur
The data in table 7 indicated the residual
fraction of soil S i.e., the unaccounted S not
extracted by any of the previous sequential
extractants. The content and behavior of Res-S
with respect to treatment imposition was very
similar to that of inorganic sulphur except that
the amount of Res-S was higher than HCl-S.
This suggests that a portion of HCl-S is still
retained in the soil.
Total sulphur (T-S)
The total sulphur content in soil over the years
as influenced by long term fertilizer and
manure application varied significantly (Table
8). As expected, like other fractions the total
sulphur content in soil showed increasing
trend over years in all the treatments.
However, in T9, T7 and T11 treatments, there
was decrease in T-S content initially (1991)
and then increased gradually over the years
and maintained slightly higher over the initial
soil T-S content. The extent of increase over
30 years was found maximum in T10 (from
289.40 to 384.04 mg kg-1) followed by T8
1343
Int.J.Curr.Microbiol.App.Sci (2019) 8(9): 1334-1345
(from 275.30 to 382.82 mg kg-1). Continuous
use of FYM organic manure and sulphur
through SSP helped in buildup of T-S in these
treatments. The results were in conformity
with the findings of Das et al., (2012), Mazur
and Mazur (2015) and Gourav et al., (2018).
Increase in total sulphur content was found to
be minimum in treatment T9 (286.33 to 290.11
mg kg-1) which received S free phosphatic
fertilizer (DAP) followed by T7 (287.17 to
296.12 mg kg-1) which received only 100 % N
and control (273.78 to 307.30 mg kg-1). This
might be due to continuous cropping without
replenishing sulphur in soil results in release
of sulphur from other sources to available pool
for crop uptake as there is an equilibrium
exists between different fractions of sulphur in
soil (Nguyen and Goh, 1990).
The different fractions of sulphur were present
in the order of organic> residual> inorganic>
water soluble> available form and major form
is in organic form. Continuous cropping
without replenishment of sulphur and
imbalanced fertilizer nutrients leads to
depletion of sulphur reserve at faster rate
under finger millet and maize cropping
system. Integration of inorganic fertilizers
with sulphur source and organic manures is
essential in maintaining and sustaining the soil
fertility with respect to sulphur status.
References
Anonymous., 1992. Quinquennial Report, 1986
– 1991. All India Coordinated Research
Project on Long Term Fertilizer
Experiments, Department of Soil Science
and Agricultural Chemistry, University of
Agricultural Sciences, GKVK, Bengaluru.
Anonymous., 2017. Quinquennial Report, 2011–
2016. All India Coordinated Research
Project on Long Term Fertilizer
Experiments, Department of Soil Science
and Agricultural Chemistry, University of
Agricultural Sciences, GKVK, Bengaluru.
Azmi, N. Y., Seema and Manish, K., 2018. New
technique for sequential fractionation of
soil sulphur. Int. J. Curr. Microbiol. App.
Sci., pp. 3397-3405.
Bhatnagar, R. K., Bansal, K. N. and Trivedi, S.
K., 2003. Distribution of sulphur in some
profiles of Shivpuri district of Madhya
Pradesh. J. Indian Soc. Soil Sci., 51(1):
74-76.
Chesnin, L. and Yien, C. H., 1951.
Turbidimetric determination of available
sulphur. J. Soil Sci. Soc. Am. Proc.,
15:149-151.
Das, K. N., Basumatari, A. and Borkotoki, B.,
2012. Forms of sulphur in some rapeseedgrowing soils of Assam. J. Indian Soc.
Soil Sci.,60(1): 13-19.
Gomez, K.A. and Gomez, A. A., 1984.
Statistical procedures for agric. Res. 2nd
Ed. Jhonwilley and sons, New York.
Gourav, Sankhyan, N. K., Sharma, R. P. and
Sharma, G. D., 2018. Vertical distribution
of sulfur fractions in a continuously
fertilized acid Alfisol under Maize–Wheat
Cropping System. Comm. soil sci. plant
analysis., 49(8): 923-933.
Hu, Z. Y., Zhao, F. J. and McGath, S. P., 2005.
Sulphur fractionation in calcareous soils
and bioavailability to plants. Plant Soil,
268(1): 103-109.
Jat, J. R. and Yadav, B. L., 2006. Different
forms of sulphur and their relationship
with properties of Entisols of Jaipur
district (Rajasthan) under mustard
cultivation. J. Indian Soc. Soil Sci., 54(2):
208-212.
Kumar, R., Singh, K. P. and Singh. S., 2002.
Vertical distribution of sulfur fractions
and their relationships among carbon,
nitrogen and sulfur in acidic soils of
Jharkhand. J. Indian Soc. Soil Sci., 50(3):
502–505.
Mazur, Z. and Mazur, T., 2015. Influence of
long-term fertilization on phosphorus,
potassium, magnesium, and sulfur content
in soil. Polish J. Environ. Studies, 24(1).
McLaren, R. G. and Cameron, K. C., 2004. Soil
Sci. 2nd edn., Oxford University Press,
Victoria, Australia.
1344
Int.J.Curr.Microbiol.App.Sci (2019) 8(9): 1334-1345
Nguyen, M. L. and Goh, K. M., 1990.
Accumulation of soil sulphur fractions in
grazed pastures receiving long-term
superphosphate
applications.
New
Zealand Agri. Res., 33(1): 111-128.
Sahoo, A. K., Sah, K. D. and Gupta. S. K. 1998.
Sulfur distribution in some mangrove
soils of Sunderbans. J. Indian Soc. Soil
Sci., 46(1): 138–140.
Scherer, H. W., Welp, G. and Forster, S., 2012.
Sulfur fractions in particle-size separates
as influenced by long-term application of
mineral and organic fertilizers. Plant, Soil
Environ., 58(5): 242-248.
Setia, R. K. and Sharma, K. N., 2005. Effect of
long-term differential fertilization on
depth distribution of forms of sulphur and
their relationship with sulphur nutrition of
wheat under maize-wheat sequence.J.
Indian Soc. Soil Sci., 53(1):91-96.
Sharma, R. K. and Jaggi, R. C., 2001.
Relationships of forms and availability
indices of sulphur with properties of soils
of Kangra, Himachal Pradesh. J. Indian
Soc. Soil Sci., 49(4): 698-702.
Sharma, U., Subehia, S. K., Rana, S. S., Sharma,
S. K. and Negi, S. C., 2014. Soil sulphur
fractions and their relationship with soil
properties and rice (Oryza sativa L.) yield
under long-term integrated nutrient
management in an acid Alfisol. Research
on Crops, 15(4).
Shoemaker, H. E., McLean, E. O. and Pratt, P.
F., 1961. Buffer methods for determining
lime requirement of soils with appreciable
amounts of extractable aluminum. Soil
Sci. Soc. America J., 25(4): 274-277.
Speir, T. W., Lee, R., Pansier, E. A. and Cairns,
A., 1980. A comparison of sulphatase,
urease and protease activities on planted
and fallow soils. Soil Bio. Biochem.12:
281-291.
Tabatabai, M. A., 1982. Sulfur, In methods of
soil analysis Ed. Page, A. L., ASA,
Madison, Wisconsin, USA.
Trudinger, P. A., Smith, J. W. and Burns, M. S.,
1975. Fractionation of sulfur isotopes by
continuous cultures of Desulfovibrio
desulfuricans. Canadian. J. Micro.,
21(10): 1602-1607.
Williams, C.H. and Steinberg, A., 1959. Soil
sulphur fractions as chemical indices of
available sulphur in some Australian soils.
Australian J. Agric. Res., 10: 340-352.
Xiao H, Li N, Liu C., 2015. Source
identification of sulfur in uncultivated
surface soils from four Chinese provinces.
Pedosphere, 25: 140-149.
How to cite this article:
Lavanya, K. R., G. G. Kadalli, Siddaram Patil, T. Jayanthi, D. V. Naveen and
Channabasavegowda, R. 2019. Sulphur Fractionation Studies in Soils of Long Term Fertilizer
Experiment under Finger Millet – Maize Cropping Sequence. Int.J.Curr.Microbiol.App.Sci.
8(09): 1334-1345. doi: />
1345