Genic microsatellite markers for genetic diversity in wheat genotypes
Bạn đang xem bản rút gọn của tài liệu. Xem và tải ngay bản đầy đủ của tài liệu tại đây (621.7 KB, 12 trang )
Int.J.Curr.Microbiol.App.Sci (2019) 8(9): 1220-1231
International Journal of Current Microbiology and Applied Sciences
ISSN: 2319-7706 Volume 8 Number 09 (2019)
Journal homepage:
Original Research Article
/>
Genic Microsatellite Markers for Genetic Diversity in Wheat Genotypes
Manisha Kumari, Mukesh Kumar, Vikram Singh,
S. Vijay Kumar* and Lakshmi Chaudhary
Department of Genetics and Plant Breeding, Chaudhary Charan Singh Haryana Agricultural
University, Hisar, 125004, India
*Corresponding author
ABSTRACT
Keywords
Diversity,
polymorphism,
Simple Sequence
Repeats, Yellow
rust, Wheat
Article Info
Accepted:
12 August 2019
Available Online:
10 September 2019
Genetic diversity assessment is necessary to help tackle the threats of
environmental fluctuations and for the effective exploitation of genetic resources
in breeding program. Recent advancement in the field of molecular markers has
made the genetic characterization of genotypes rapid, reliable and reproducible. In
the present investigation, we have characterized 49 wheat genotypes at molecular
level using 52 SSR primers (including Yr specific primers). 27 polymorphic SSR
markers were dispersed over the AABBDD wheat genome, a total of 102 alleles
were detected with allele range of 1 to 6. Polymorphism information content (PIC)
values calculated to assess the informativeness of each marker ranged from 0.11 to
0.95 and there is significant that 5 out of 27 SSR loci, namely Xpsp 3000,
Xwgp249, Wmc198, csLV34, Xgwm301 revealed PIC values above 0.70, can be
considered highly useful for differentiation of wheat genotypes. The UPGMA
cluster tree analysis led to the grouping of 49 wheat genotypes in two major
clusters and nine sub clusters. Cluster pattern revealed that, sub-cluster six was the
largest consisting maximum number of twelve genotypes. Our results suggested
that the classification based on genotypic markers of these wheat genotypes would
be useful for selection of varieties for wheat improvement program.
Introduction
Common wheat (Triticum aestivum) (2n = 6x
= 42) is a versatile cereal crop belongs to
family Poaceae, the most diverse and
important family of the plant kingdom. It
produces large edible grains and provides
about one-half of human’s food calories and a
large part of their nutrient requirements. The
substantial increase in world’s population
demands a consistent increase in the
production of wheat. In India, Wheat is the
second most important food crop after rice
both in terms of area, production and
consuming country in the world. Over the last
50 years, Indian agriculture has witnessed
spectacular advances in both production and
productivity after the introduction of dwarf
1220
Int.J.Curr.Microbiol.App.Sci (2019) 8(9): 1220-1231
wheat during the mid-sixties. The major states
involved in wheat production are Uttar
Pradesh, Punjab and Haryana. They account
for nearly 70 per cent of the total wheat
produced in the country. Punjab and Haryana
yield the highest amount of wheat because of
the availability of better irrigation facilities
and congenial weather condition. Haryana
state on the whole has achieved a productivity
level of 4.55 tons/ha on 2.5 million hectares
(Anonymous, 2018).
Genetic diversity is basis for genetic
improvement of crop plant and launching an
efficient breeding programme that aimed for
the improvement of wheat productivity.
Therefore, it is necessary to investigate the
genetic diversity in wheat germplasm in order
to broaden the genetic variation in future
breeding work. The use of molecular marker
for evaluation genetic diversity is receiving a
much attention (Kumari et al., 2017). Simple
sequence repeats (SSRs) (Tautz, 1989) have
been widely exploited in wheat due to their
high level of polymorphisms, co-dominant
inheritance and equal distribution in the wheat
genome (Khaled et al., 2015). SSRs are more
abundant, ubiquitous in presence, hypervariable in nature and have high polymorphic
information content (PIC) (Gupta et al., 2010).
SSR have been used to study genetic diversity
of wheat cultivars by (Eujay et al., 2001;
Grewal et al., 2007; Hai et al., 2007; Ijaz and
Khan, 2009; Khaled et al., 2015)
The current research was conducted to
estimate the genetic diversity of 49 different
wheat genotypes by using 52 microsatellite
markers. All the wheat genotypes could be
distinguish from each other at molecular level.
The phylogenetic relationships, genetic
diversity and molecular characteristics
concluded in current study will facilitate in
breeding programs for the selection of parents
and to derive a high yielding yellow rest
resistance variety.
Materials and Methods
Plant materials
Isolation of genomic DNA
Genomic DNA was isolated from the young
leaves of wheat plants by using CTAB (Cetyl
Trimethyl Ammonium Bromide) extraction
method given by Murray and Thompson
(1980) modified by (Saghai et al., 1984). The
concentration and purity of DNA was
determined at 260 nm and 280 nm by using
UV-Vis spectrophotometer. The band quality
of genomic DNA was observed with the help
of electrophoresis on 0.8% agarose gel. The
DNA samples were diluted to a concentration
of 2.0 ng/μl with TE buffer for SSR analysis.
Selection of markers
A total of 52 molecular markers were used for
studying molecular polymorphism in 49
genotypes based on different research paper
used in analysis of genetic diversity of wheat.
All these primers were custom synthesized
from Sigma Chemicals Co. USA. The
chromosome locations, base sequences of
forward and reverse primers of SSR markers
and their annealing temperature are given in
(Table 2.)
Microsatellite marker analysis
PCR amplification reaction was carried out in
applied
biosystem
thermocycler.
The
optimized PCR reaction contained DNA
template 50 ng, 10X PCR buffer 2.0 μl, MgCl2
50mM 0.6 μl, dNTPs mix (10μM) 0.5 μl,
Forward primer (10 μM) 0.4 μl, Reverse
primer (10 μM)m 0.4 μl, Taq DNA
Polymerase (5 U/µl) 0.3 μl in total volume of
20 μl. The PCR reaction (20 μl) was set up in
thin walled 0.2 ml PCR tubes in applied
biosystems thermocycler under following
reaction conditions:
1221
Int.J.Curr.Microbiol.App.Sci (2019) 8(9): 1220-1231
94 °C for 4 minutes (initial denaturation)
94 °C for 1 minute (denaturation)
48.5-73 °C for 1 minute (primer annealing)
72 °C for 2 minutes (primer extension)
72 °C for 10 minutes (final primer extension)
Results and Discussion
The amplification reaction was set to repeat
the step (ii) to (iv) for 35 times and the
amplified products were stored at -20 C till
further use. The PCR products were
electrophoresed on 2.5% agarose gels
containing at 100 V for 2 h and observed
under a UV transilluminator.
Allele scoring and data analysis
The size of amplified band of each
microsatellite marker was determined based
on electrophoretic mobility relative to
molecular weight of ladder (100 bp) used.
In the present investigation, a total of 52 SSR
primers (including Yr specific primers) were
used for amplification in different wheat
genotypes as shown in (Table 3). Out of these
52 primers only 49 primers gave amplification
and remaining 3 were not amplified. Out of
these amplified primers, 22 primers were
found to be monomorphic and 27 gave
polymorphic bands with a total of 102 alleles
amplified with a range of 1-6 per primer.
Maximum number of allele was observed in 6
in case of marker Xgwm408 whereas the
minimum number of allele is 2 (Barc8,
Wmc31, Xgwm341, Gwm11, csLV34,
Psp2999, Wmc170, Xgwm95, Xgwm140,
Wmc25, Barc76, Xgwm261). PIC values of
various SSR loci across all the 49 genotypes
ranged from 0.11 (Wmc31) to 0.95 (csLV34).
Anderson et al., (1993) formula is used for
calculating the polymorphic information
content (PIC) value of marker which is used in
amplification
.
It is significant to note that 5 out of 27 SSR
loci, namely Xpsp 3000, Xwgp249, Wmc 198,
csLV34, Xgwm301 revealed PIC values above
0.70. The detail of PIC values of all 23
markers used in study is presented in (Table
4).
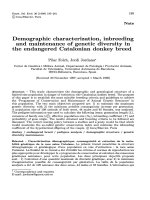
Agarose
gel
displaying
allelic
polymorphism among wheat genotypes for
some of the SSR markers have been shown in
(Plates 1.) The size of amplified DNA
fragments varied from approx. 100 bp to
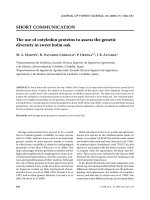
500bp. The UPGMA cluster tree analysis led
to the grouping of forty nine wheat genotypes
in 2 major clusters and 9 sub clusters (Table 5)
(Fig 1). Cluster pattern revealed that, subcluster 6 was the largest consisting maximum
number of 12 genotypes. This way followed
by sub-cluster 4 (8 genotypes), sub-cluster 3
and 8 (6 genotypes), sub-cluster 9 (5), subcluster 1 (4 genotypes), sub-cluster 2 and 7 (3
genotypes) and sub-cluster 5 (2 genotypes).
Where, Pij is the frequency of the j th allele
for I th marker and summation extends over
the alleles.
The development of molecular marker
technologies during the last twenty years has
revolutionized the genetic analysis of crop
plants.
Amplified products from microsatellite
analysis were scored qualitatively for presence
and absence of each marker allele genotype
combination. Binary matrix is used for data
analysis 1 for present of band and 0 for
absence of band.
The binary data was used to calculate
similarity genetic distance using JMP 8.0
software, SAS Institute Inc., Carry, NC, 19892007. Dendrogram was constructed by using
distance matrix by the unweighted pair group
method using arithmetic averages (UPGMA)
of JMP 8.0 Software.
1222
Int.J.Curr.Microbiol.App.Sci (2019) 8(9): 1220-1231
Today, molecular markers are the best tools
used to determine the level of genetic diversity
among plants and can provide detailed
characterization
of
genetic
resources
(Manifesto et al., 2001; Mir et al., 2012). SSR
have been used extensively for designing
primer sets which are not only highly
polymorphic but also species specific (Pestova
et al., 2000). Genetic diversity plays an
important role in crop improvement and was
demonstrated through SSR markers (Gupta et
al., 2009; Plaschke et al., 1995) has used
wheat microsatellite for the first time for
studying the genetic diversity in closely
related European bread wheat varieties.
The present study addressed the utility of SSR
markers in revealing assessment of genetic
variability and diversity at the molecular level
among 49 wheat genotypes wherein 52 SSR
primers were used, which were earlier
identified in the genomic regions of A, B, and
D genomes of wheat. The SSR marker loci
generated by the 49 primer pairs were used to
assess the genetic diversity among 49 wheat
genotypes. The microsatellite or SSR primers
generated 102 alleles with the number of
alleles per locus varying from 0 to 6.
Maximum number of allele was observed in 6
in case of marker Xgwm408 whereas the
minimum number of allele is 2 (Barc8,
Wmc31, Xgwm341, Gwm11, csLV34,
Psp2999, Wmc170, Xgwm95, Xgwm140,
Wmc25, Barc76, Xgwm261). A similar
pattern of allelic variation was also observed
earlier (Schuster et al., 2009; Emon et al.,
2010; Zhang et al., 2011). Contrarily the
number of alleles detected in the present study
was significantly higher than the average
number of alleles in previous reports (Schuster
et al., 2009) which has reported 3.2. The
presence of unique alleles in the set of
cultivars may indicate that these materials are
useful for plant breeders and geneticists as a
rich source of genetic diversity for wheat.
The PIC value is a reflection of allele diversity
and frequency among the wheat cultivars and
also varied from one locus to another locus.
The level of polymorphism determined by PIC
values was quite high and varied range 0.11
(Wmc31) to 0.95 (csLV34).
It is note that 5 out of 27 SSR loci, namely
Xpsp 3000, Xwgp249, Wmc 198, csLV34,
Xgwm301 revealed PIC values above 0.70,
can be considered highly useful for
differentiation of wheat genotypes. Similarly,
(Ijaz and Khan 2009) reported high level of
polymorphism ranging from 10.52% to
98.42%. (Manifesto et al., 2001) reported PIC
values ranged from 0.40 to 0.84 with an
average value of 0.72.
The DNA fragments varied from approx. 100
bp to 500bp. Similarly, (Abbas et al., 2008)
obtained amplified DNA fragments that varied
in size ranging from 250bp to 1000bp and
(Manifesto et al., 2001) obtained amplified
DNA fragments that varied in size from 115bp
to 285bp.
Cluster analysis using UPGMA method
delineated the 49cultivars into 2 main clusters
and 9 sub clusters. Cluster pattern revealed
that, sub-cluster 6 was the largest consisting
maximum number of 12 genotypes. 9 subclusters showing the effectiveness of
microsatellite markers in genetic diversity
assays.
Several studies using SSR have resulted in
successful clustering of wheat cultivars (Amer
et al., 2001; Zhang et al., 2005; Hao et al.,
2008; Ijaz and Khan et al., 2009; Schuster et
al., 2009). This type of markers is very
effective in delineating diversity based on
parental source by grouping cultivars with
similar pedigree information as well as
grouping based on agronomic characteristics
and geographical origin.
1223
Int.J.Curr.Microbiol.App.Sci (2019) 8(9): 1220-1231
Fig.1 Dendrogram showing the clustering pattern of forty nine genotypes of wheat on the basis
of SSR marker
Plate.1 Polymorphism in different forty nine genotypes of wheat by using primer Xgwm349
1224
Int.J.Curr.Microbiol.App.Sci (2019) 8(9): 1220-1231
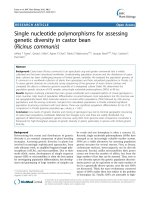
Plate.2 Polymorphism in different forty nine genotypes of wheat by using primer csLV34
Plate.3 Polymorphism in different forty nine genotypes of wheat by using primer GWM11
Table.1 List of all the 49 wheat genotypes under experiment
SR.NO.
1
2
3
4
5
6
7
8
9
10
11
12
13
14
15
16
17
GENOTYPE
C -306
WH-542
WH 711
WH 730
WH 1021
WH 1025
WH 1080
WH 1097
WH 1105
WH 1124
WH 1181
WH 1180
WH 1173
WH 1172
WH 1171
WH 1169
WH 1167
SR.NO.
18
19
20
21
22
23
24
25
26
27
28
29
30
31
32
33
34
GENOTYPE
WH 1166
WH 1164
WH 1157
WH 1156
WH 1154
WH 1142
WH 1182
WH 1183
WH 1184
WH 1185
WH 1186
WH 1187
WH 1188
WH 1189
WH 1190
WH 1191
WH 1192
1225
SR.NO.
35
36
37
38
39
40
41
42
43
44
45
46
47
48
49
GENOTYPE
WH 1193
WH 1194
WH 1197
RAJ 3765
PBW 698
PBW 550
PBW 373
PBW 343
PBW 175
HD 3086
HD 2967
DPW 621-50
DBW 88
DBW 17
WH 1195
Int.J.Curr.Microbiol.App.Sci (2019) 8(9): 1220-1231
Table .2 List of 52 SSR markers (including Yr specific markers) used for studying polymorphism in 49 genotypes
S.
No
1
2
4
5
6
7
8
9
10
11
12
13
14
15
16
17
18
19
20
21
22
23
24
25
26
27
28
29
30
SSR Marker
Xbarc7-2B
Xbarc8
Xbarc101
Xbarc181
Xbarc167
Xbarc187
IAG95-STS
Xbarc59
Xbarc76
Xbarc137
Xbarc352
Xgwm261
Xgwm273
Xgwm297
Xgwm408
Xgwm437
Xgwm186
Xgwm413
Xgwm18
Xgwm359
Barc72
Barc353
Xwmc120
wmc364
Xwmc44
Xwgp8
Xgwm16
Xgwm249
csLV34
Linkage group
Forward Primer sequence
2B
1B (Yr15)
3B (Yr36)
1B (Yr26)
GCGAAGTACCACAAATTTGAAGGA
GCGGGAATCATGCATAGGAAAACAGAA
GCTCCTCTCACGATCACGCAAAG
CGCTGGAGGGGGTAAGTCATCAC
AAAGGCCCATCAACATGCAAGTACC
1BYr24
GTGGTATTTCAGGTGGAGTTGTTTTA
Yr9/Lr26/Sr34 CGAATAGCCGCTGCACAAG
GCGTTGGCTAATCATCGTTCCTTC
ATTCGTTGCTGCCACTTGCTG
1B
GGCCCATTTCCCACTTTCCA
CCCTTTCTCGCTCGCCTATCCC
2D
CTCCCTGTACGCCTAAGGC
1B(YrH52)
ATTGGACGGACAGATGCTTT
2D
GCGTAGGAGAGATGCCCCAAAGGTT
5B
TCGATTTATTTGGGCCACTG
7D
GATCAAGACTTTTGTATCTCTC
5A
GCAGAGCCTGGTTCAAAAAG
1B (Yr15)
TGCTTGTCTAGATTGCTTGGG
1B (Yr26)
TGGCGCCATGATTGCATTATCTTC
2A
CTAATTGCAACAGGTCATGGG
CGTCCTCCCCCTCTCAATCTACTCTC
GAAGTTCCCAAAATGCCTCTGTC
GGAGATGAGAAGGGGGTCAGGA
Yr2
ATCACAATGCTGGCCCTAAAAC
Yr29
GGTCTTCTGGGCTTTGATCCTG
1B (Yr9)
CTCTGTATACGAGTTGTC
2B/5D/7B
GCTTGGACTAGCTAGAGTATCATAC
2A (Yr16)
CAAATGGATCGAGAAAGGGA
Yr18/Lr26/Sr39 CTTGGTTAAGACTGGTGATGG3
1226
Reverse Primer sequence
CGCCATCTTACCCTATTTGATAACTA
GCGGGGGCGAAACATACACATAAAAAA
GCGAGTCGATCACACTATGAGCCAATG
CGCAAATCAAGAACACGGGAGAAAGAA
CGCAGTATTCTTAGTCCCTCAT
CGGAGGAGCAGTAAGGAAGG
TATGCATGCCTTTCTTTACAAT
AGCACCCTACCCAGCGTCAGTCAAT
GCGCGACACGGAGTAAGGACACC
CCAGCCCCTCTACACATTTT
CTGTTTCGCCCAATCTCGGTGTG
CTCGCGCTACTAGCCATTG
AGCAGTGAGGAAGGGGATC
GCGTGCGGACTCGTGAATCATTAC
GTATAATTCGTTCACAGCACGC
GATGTCCAACAGTTAGCTTA
CGCCTCTAGCGAGAGCTATG
GATCGTCTCGTCCTTGGCA
GGTTGCTGAAGAACCTTATTTAGG
TACTTGTGTTCTGGGACAATGG
CGTCCCTCCATCGTCTCATCA
GCGGATCGAAGACCTAAGAAAAG
CCAGGAGACCAGGTTGCAGAAG
CAGTGCCAAAATGTCGAAAGTC
TGTTGCTAGGGACCCGTAGTGG
GAGGAAGCACAGGTTGCC
CAATCTTCAATTCTGTCGCACGG
CTGCCATTTTTCTGGATCTACC
TGCTTGCTATTGCTGAATAGT3
Ta
(°C)
51.5
58
54
60
65.2
62
51
69
69.5
61
64
62
52.5
54.5
63.9
54.2
58.5
52.5
50
58
68
71
67.5
52
60
62
62
48
62
Int.J.Curr.Microbiol.App.Sci (2019) 8(9): 1220-1231
31
32
33
34
35
36
37
38
39
40
41
42
43
44
45
46
47
48
49
50
51
52
GWM11
Xgwm 6
Xgwm 37
Xgwm 120
Xgwm 140
Xgwm 192
Xgwm 210
Xgwm 301
Xgwm 319
Xgwm 349
Xgwm146
Xgwm268
Xgwm537
Xgwm569
Xgwm577
Xgwm247
Xgwm341
Xwmc25
Xwmc31
Xwmc170
Xwmc89
Xwmc198
Yr15/Yr24
4B
7D
Yr5
Yr29
5D
2B/5D/7B
2D
2B
2D
7B
1B
7B
7B
7B
2B
3D
2D
2A
6A
Yr32
GGATAGTCAGACAATTCTTGT
CGTATCACCTCCTAGCTAAACTAG
ACTTCATTGTTGATCTTGCATG
GATCCACCTTCCTCTCTCTC
ATGGAGATATTTGGCCTACAAC
GGTTTTCTTTCAGATTGCGC
TGCATCAAGAATAGTGTGGAAG
GAGGAGTAAGACACATGCCC
GGTTGCTGTACAAGTGTTCACG
GGCTTCCAGAAAACAACAGG
CCAAAAAAACTGCCTGCATG
AGGGGATATGTTGTCACTCCA
ACATAATGCTTCCTGTGCACC
GGAAACTTATTGATTGAAAT
ATGGCATAATTTGGTGAAATTG
GCAATCTTTTTTCTGACCACG
TTCAGTGGTAGCGGTCGAG
TCTGGCCAGGATCAATATTACT
CTGTTGCTTGCTCTGCACCCTT
ACATCCACGTTTATGTTGTTGC
ATGTCCACGTGCTAGGGAGGTA
CACGCTGCCATCACTTTTAC
Ta (0c) - annealing temperature
1227
GTGAATTGTGTCTTGTATGCTTCC
AGCCTTATCATGACCCTACCTT
CGACGAATTCCCAGCTAAAC
GATTATACTGGTGCCGAAAC
CTTGACTTCAAGGCGTGACA
CGTTGTCTAATCTTGCCTTGC
TGAGAGGAAGGCTCACACCT
GTGGCTGGAGATTCAGGTTC
CGGGTGCTGTGTGTAATGAC
ATCGGTGCGTACCATCCTAC
CTCTGGCATTGCTCCTTGG
TTATGTGATTGCGTACGTACCC
GCCACTTTTGTGTCGTTCCT
TCAATTTTGACAGAAGAATT
TGTTTCAAGCCCAACTTCTATT
ATGTGCATGTCGGACGC
CCGACATCTCATGGATCCAC
TAAGATACATAGATCCAACACC
GTTCAAGTGGTCATTGTTGCT
TTGGTTGCTCAACGTTTACTTC
TTGCCTCCCAAGACGAAATAAC
TTGAAGTGGTCATTGTTGCT
58
51.5
56
54
60
61
60.5
58
57
61
48.5
60.2
62
54
57.5
64
51.5
55.8
54
53.5
52
51
Int.J.Curr.Microbiol.App.Sci (2019) 8(9): 1220-1231
Table.3 List of SSR marker primers showing amplification in different wheat genotypes
S.No.
SSR Marker
Amplification Result
S.No. SSR Marker
1
Xbarc7-2B
M
27
Xwgp8
M
2
Xbarc8
P
28
Xgwm16
M
3.
Xbarc101
M
29
Xgwm249
P
4.
Xbarc181
M
30
csLV34
P
5.
Xbarc167
M
31
GWM11
P
6.
Xbarc187
M
32
Xgwm 6
M
7.
IAG95-STS
P
33
Xbarc137
P
8.
Xbarc59
NA
34
Xgwm 120
M
9.
Xbarc76
P
35
Xgwm 140
P
10.
Xbarc137
P
36
Xgwm 192
M
11.
Xbarc352
M
37
Xpsp3000
P
12
Xgwm261
M
38
Xgwm 301
P
13
Xgwm273
P
39
Xgwm 319
P
14
Xgwm297
M
40
Xgwm 349
P
15
Xgwm408
P
41
Xgwm146
P
16
Xgwm437
M
42
Xgwm268
P
17
Xgwm186
M
43
Xgwm537
M
18
Xgwm413
M
44
Xgwm569
NA
19
Xgwm18
M
45
Xgwm577
P
20
Xgwm210
M
46
Xgwm247
M
21
Barc72
M
47
Xgwm341
P
22
Barc353
M
48
Xwmc25
P
23
Xwmc120
M
49
Xwmc31
P
24
wmc364
M
50
Xwmc170
P
25
Xwmc44
P
51
Psp2999
P
26
Xgwm95
P
52
Xwmc198
P
1228
Amplification Result
Int.J.Curr.Microbiol.App.Sci (2019) 8(9): 1220-1231
Table.4 Range and PIC value of polymorphic SSR primers
1
2
3
4
5
6
7
8
9
10
11
12
13
14
15
16
17
18
19
20
21
22
23
24
25
26
27
Primer name
Xpsp 3000
Barc8
Xwgp249
Xgwm273
Wmc31
Wmc 198
IAG95-STS
Xgwm341
Gwm11
csLV34
Xgwm349
Psp2999
Wmc170
Xgwm95
Xgwm140
Xgwm268
Wmc25
Xgwm577
Xgwm319
Barc76
Barc137
Xgwm44
Xgwm146
Xgwm674
Xgwm261
Xgwm301
Xgwm408
No. Of Alleles
5
2
4
3
2
4
3
2
2
2
3
2
2
2
2
3
2
4
3
2
3
3
3
5
2
6
3
1229
Range (bp)
180-300
280-500
100-500
200-400
100-170
160-500
100-210
140-180
200-210
180-280
100-210
180-190
220-230
110-120
210-210
200-300
180-210
100-200
120-210
210-220
200-500
200-500
160-400
150-500
180-200
160-160
180-200
PIC values
0.75
0.49
0.75
0.66
0.11
0.72
0.58
0.50
0.19
0.95
0.53
0.23
0.21
0.48
0.30
0.29
0.36
0.53
0.66
0.40
0.61
0.40
0.47
0.60
0.50
0.77
0.32
Int.J.Curr.Microbiol.App.Sci (2019) 8(9): 1220-1231
Table.5 Distribution of forty nine wheat genotypes in different clusters based on SSR markers
Major cluster
Sub- clusters
Cluster A
Cluster1
C306, WH542,WH711,WH1021
4
Cluster2
WH1025,WH1181,WH1173
3
Cluster3
WH1080,WH1124,WH1171,WH1156,WH1142,WH1182,
6
Cluster4
WH730, WH1154, WH1180, WH1172, WH1169, WH1167,
WH1166, WH1164
8
Cluster5
WH1097,WH1105
2
Cluster6
WH1183,WH1184,WH1185,WH1190,WH1197,WH1193,
WH1194,WH1187,WH1188,WH1189,RAJ3765,HD2967
12
Cluster7
WH1186, DBW621-50, PBW373
3
Cluster8
WH1191, PBW698, HD3086, PBW343, PBW175, WH1192
6
Cluster9
PBW550, WH1195, DBW88, DBW17, WH1157
5
Cluster B
Genotypes
Genetic diversity evaluation serves as a crucial
platform in plant improvement. In the present
study 52 Simple Sequence Repeat (SSR)
primer sets were used to characterize 49 wheat
varieties to know about the diverse varieties
for future breeding programs to enhance wheat
production. Microsatellites displayed a high
level of polymorphism in the present study.
The information about the genetic diversity of
these wheat cultivars will be much useful for
proper identification and selection of
appropriate parents for use in the breeding
programs, including gene mapping for wheat
improvement, enhance the breeding efficiency
and will add the strength of marker assisted
selection (MAS).
References
Abbas, S.J., Rehmat, S., Shah, U., Rasool, G.
and A. Iqbal: Analysis of genetic diversity
in Pakistani wheat varieties by using
Simple Sequence Repeat (SSR) primer
sets. J. Sust. Agri., 2 (1), 34-37 (2008).
Amer, I.M.B., Borner, A. and M.S. Roder:
Detection of genetic diversity in Labyan
wheat
genotypes
using
wheat
No of
genotypes
microsatellite marker. Genet. Res. Crop
Evol., 48, 179-585 (2001).
Anonymous: Progress report of all India
coordinated
wheat
and
barley
improvement project 2014-15. Crop
improvement, Directorate of Wheat
Research, Karnal, India (2015).
Emonn, R., Gustafson, J., Nguyen, H.,
Musket, T., Jahiruddin, M., Islam, M.,
Haque, M. S., Islam, M. M., Begum, S. N.
and M. M. Hassan: Molecular markerbased characterization and genetic
diversity of wheat genotypes in relation to
Boron use efficiency. Ind. J. Genet.,
70(4), 339-348 (2010).
Eujay, I., Sorrells, M., Baum, M., Woltersand,
P. and W. Powell: Assessment of
genotypic variation among cultivated
durum wheat based on EST-SSRs and
genomic SSRs. Euphytica, 119, 39-43
(2001).
Grewal, S., Kharb, P., Malik, R., Jain, S and
R. Jain: Assessment of genetic diversity
among some Indian wheat cultivars using
random amplified polymorphic DNA
(RAPD) markers. Ind. J. Biotech., 6, 1823 (2007).
1230
Int.J.Curr.Microbiol.App.Sci (2019) 8(9): 1220-1231
Gupta, P., Langridge, P. and R. Mir: Markerassisted wheat breeding: present status
and future possibilities. Mole. Breed., 26
(10), 145-161 (2010).
Gupta, S.K., Cherpe, A., Prabhu, K. V. and
Q.M.R. Haque: Identification and
validation of molecular marker linked to
leaf rust resistance gene Lrl9 in wheat.
Theor. Appl. Genet., 13, 1027-1036
(2006).
Hai, L., Wagner, C. and W. Friedt:
Quantitative structure analysis of genetic
diversity among spring bread wheats
(Triticum aestivum L.) from different
geographical regions. Genetica, 130, 213–
225 (2007).
Hao, Y.F., Liu, A.F., Wang, Y.H., Feng, D.S.,
Gao, J.R., Li, X.F., Liu, S.B. and H.G.
Wang: Pm23: a new allele of Pm4 located
on chromosome 2AL in wheat. Theor.
Appl. Genet., 117, 1205–1212 (2008).
Ijaz, S. and I.A. Khan: Molecular
characterization of wheat germplasm
using microsatellite markers. Genet. Mole.
Res., 8 (3), 809-815 (2009).
Khaled, F., Salem, M., Röder, M. S. and A.
Börner: Assessing genetic diversity of
Egyptian hexaploid wheat (Triticum
aestivum L.) using microsatellite markers.
Genet. Res. Crop Evol., 62(3), 377-385
(2015).
Kumari, M., Kumar, M., Singh, V., Kumar S,
V. and M. Rathi: Trait association and
morphological
diversity in
wheat
(Triticum aestivum L.) genotypes. Elect.
J. Pl. Breed., 8(2), 534-540 (2017).
Manifesto, M.M., Schlatter, A.R., Hopp, H.E.,
Suarez, E.Y. and J. Dubcovsky:
Quantitative evaluation of genetic
diversity in wheat germplasm using
molecular markers. Crop Sci., 41, 682690 (2011).
Mir, R.R., Kumar, J., Balyan. H.S. and P. K.
Gupta: A study of genetic diversity
among Indian bread wheat (Triticum
aestivum L.) cultivars released during last
100 years. Genet. Res. Crop Evol., 59 (5),
717-726 (2012).
Murphy, L. R., Santra, D., Kidwell, K., Yan,
G., Chen, X. and K. G. Campbell:
Linkage maps of wheat stripe rust
resistance genes Yr5 and Yr15 for use in
marker-assisted selection. Crop Sci., 49,
1786–1790 (2009).
Saghai-Maroof, M.A., Soliman, K. M.,
Jorgensen, R.A. and R.W. Allard:
Ribosomal
DNA
spacer-length
polymorphism in Barley: Mendelian
inheritance, Chromosomal-location and
population dynamics. Proc. Nat. Acad.
Sci., 81, 8014-8019 (1984).
Schuster, I., Vieira, E.S.N., Silva G.J., Franco,
F.A. and V.S. Marchioro: Genetic
variability in Brazilian wheat cultivars
assessed by microsatellite markers. Genet.
Mol. Biol., 32 (3), 557-563 (2009).
Tautz, D.: Hypervariability of simple
sequences as a general source of
polymorphic DNA markers. Nucl. Acids
Res., 17, 6463–6471 (1989).
Zhang, P., Li, J., Li, X., Liu, X., Zhao, X. and
Y. Lu: Population structure and genetic
diversity in a rice core collection (Oryza
sativa) investigated with SSR markers.
Plos One. 6(12), e27565 (2011)
How to cite this article:
Manisha Kumari, Mukesh Kumar, Vikram Singh, Vijay Kumar S and Lakshmi Chaudhary
2019. Genic Microsatellite Markers for Genetic Diversity in Wheat Genotypes.
Int.J.Curr.Microbiol.App.Sci. 8(09): 1220-1231. doi: />
1231