ISSR analysis of genetic diversity in Acrocarpus fraxinifolius from three landscape elements of transition forest belt of Kodagu district, Karnataka, India
Bạn đang xem bản rút gọn của tài liệu. Xem và tải ngay bản đầy đủ của tài liệu tại đây (490.37 KB, 14 trang )
Int.J.Curr.Microbiol.App.Sci (2019) 8(9): 1611-1624
International Journal of Current Microbiology and Applied Sciences
ISSN: 2319-7706 Volume 8 Number 09 (2019)
Journal homepage:
Original Research Article
/>
ISSR Analysis of genetic diversity in Acrocarpus fraxinifolius
from three landscape elements of transition forest belt
of Kodagu district, Karnataka, India
V. Maheswarappa1*, R. Vasudeva2, Ramakrishna Hegde3 and G. Ravikanth4
1
2
College of Forestry, Ponnampet, Kodagu- 571216, Karnataka, India
Department of Forest Biology and Tree Improvement, College of Forestry,
Sirsi-581401, India
3
College of Forestry, Ponnampet-571216, India
4
ATREE, Bengaluru, India
*Corresponding author
ABSTRACT
Keywords
Acrocarpus
fraxinifolius,
genetic diversity,
ISSR, landscapes
Article Info
Accepted:
18 August 2019
Available Online:
10 September 2019
Acrocarpus fraxinifolius is an important tropical timber species mainly found in Asia
and is a fast growing tree species found naturally in India, Chaina, Burma and
Sumatra. In Karnataka, the species is extensively cultivated in coffee plantations due
to its desirability in the rainy season that favours coffee growth. The species is also to
the smaller extent noticed in natural forests and sacred groves of Kodagu district,
Karnataka, India. However there was no much studies were taken in assessing the
genetic diversity of the species exists in natural forests, sacred groves and coffee
plantations. Hence the study was undertaken to know the extent of genetic diversity in
the species as comparing to natural forests, sacred groves and coffee plantations was
analyzed using ISSR markers. The leaf samples were collected from each of
landscape. DNA was extracted from leaf material using Cetyl Trimethyl Ammonium
Bromide (CTAB) technique. A total of 24 ISSR markers were used for this study, but
only 14 ISSR primers were successfully amplified for 8 samples. Sampled populations
from all the three landscapes showed relatively higher diversity. While the sacred
grove and coffee plantations populations recorded higher diversity (0.3779 and
0.5601: 0.3661 and 0.5403, respectively) than natural forest population (0.2982 and
0.4567). This data clearly suggests that the farmers have conserved a higher level of
diversity.
Introduction
Acrocarpus fraxinifolius Wight & Arn
possessing a botanical synonym Acrocarpus
combreliflorus Teysm & Binn emanates from
the tropical regions of Asia and native of
Asian tropics. Its natural and biological
distribution covers India, Chaina, Burma,
Borneo, Sumatra, Indonesia, Vietnam, and
Bangladesh. In India is known as Mundani
1611
Int.J.Curr.Microbiol.App.Sci (2019) 8(9): 1611-1624
(Balangi in Karnataka), tropical Africa (Pink
Cedar), in Latin America (Cedro Rosado,
Mundani, Lazcar). Other vernacular names of
the tree include Australian ash, Indian ash,
Shingle tree (Onyango et al., 2010). Pink
cedar wood act as a source for fodder,
firewood for charcoal production, apiculture,
timber, furniture, gum and resin. The wood is
used to produce pulp for paper and has also
been recommended for reinforcing river
banks, stabilize terraces and used in coffee
agro forestry systems (Orwa et al., 2009).
information of the species in conservation and
management. The genetic diversity analysis of
the species is of the first time report and hence
the genetic diversity studies in Acrocarpus
fraxinifolius helps in identifying the variation
exists among and within the populations of
natural forests, sacred groves and coffee
plantations of transition forest belt of Kodagu,
Karnataka, India.
Materials and Methods
Description of the study site
The most widely used parameter to measure
diversity within populations is the expected
heterozygosity or gene diversity defined by
Nei (1973) as the probability that two alleles
chosen at random from the population are
different. Allelic diversity is an alternative
criterion to measure genetic diversity and most
relevant in conservation programmes as a high
number of alleles imply a source of singlelocus variation for important traits (Barker,
2001).
Inter Simple Sequence Repeats (ISSR) were
reported by Zietkiewicz et al., (1994)
containing 100-3000 bp fragments. They are
dominant markers and highly sensitive,
reproducible and cost effective compared to
other PCR-based markers (Reddy et al.,
2002). These are either anchored at 3' or 5' end
or unanchored. ISSRs do not require prior
DNA sequence information and can work with
small quantity (5–50 ng per reaction) template
DNA detecting very low level of genetic
variation effectively. ISSRs have been
successfully employed in genetic diversity
studies in many forest plants such as Primula
obconica (Nan et al., 2003) and Gmelina
arborea (Naik et al., 2009).
The study was conducted in forest-coffee
agroforest landscape mosaics of Kodagu
district which lies in the Central Western
Ghats region, Southern India, geographically
stretched between 11º 56’ to12º 52’ N and 75º
22’ to76º 12’ E, covering an area of 4106 km2
of which about 38 per cent of area is under
natural forests and tree plantations. Three
landscape elements such as natural forests
(NF), sacred groves (SG) and coffee
plantations (CFP) were selected in transition
forest belt of Kodagu, Karnataka, India.
Sampling
Leaf material was collected from adult
individuals (>10 cm dbh) in 24 accessions of
Acrocarpus fraxinifolius in adjoining natural
forests, sacred groves and coffee plantations.
Collection of leaf material in continuous forest
was restricted to plots of approximately 1 ha
and to individuals at least 500 m apart. All the
leaves were stored in individual zip lock
plastic covers with labelling and shade dried
in the laboratory before the DNA was
extracted.
DNA extraction and PCR amplifications
Lee et al., (2006) opined that to understand the
variation within and among populations of
plant species, understanding genetic process is
very important in addition to ecological
DNA was extracted from leaf material (100
mg) using cetyl trimethyl ammonium bromide
(CTAB) technique (Doyle and Doyle, 1987)
1612
Int.J.Curr.Microbiol.App.Sci (2019) 8(9): 1611-1624
and was purified using DNA easy Plant Mini
kit (Qiagen,USA). The quantity and quality of
the genomic DNA were assessed using
Nanodrop2000 (Thermo Fisher Scientific,
USA), Qubit (Thermo Fisher Scientific, USA)
and agarose gel electrophoresis. Eighteen 100200 bp primers were tested for the process and
only those primers that produced high
intensity and reproducible bands were used for
the remainder of the analyses.
Effective number of alleles (ne)
Amplification was conducted in an eppendorf
master cycler with a heated lid. Amplification
was initiated for 3min at 94.0 ºC, a total of 35
cycles of the following: denaturation at 94ºC
for 30 sec, annealing at 45ºC for 1 min, and
elongation at 72ºC for 30 sec. An additional
extension at 72ºC for 7 min was used to ensure
that all amplified products completed their
elongation. Amplification products were
resolved electrophoretically on a 2 % agarose
gel at a constant voltage of 75 V for 3 h with a
19 TAE buffer stained with ethidium-bromide.
Polymorphism Information Content (PIC)
The bands were visualized with ethidium
bromide fluorescence. Samples were assigned
randomly to lanes and all gels included lanes
containing DNA ladders to facilitate
standardization.
Gels
were
digitally
photographed and the images of multiple gels
were standardized using Alpha imager, J.H.
Bio software.
Nei’s Gene Diversity (h)
The effective number of alleles was calculated
by using the equation as given by Kimura and
Crow (1963).
Where, K is the mean number of loci, V
variation in number of loci/allele,
N
Number of Loci/bands
The level of within population genetic
diversity was assed using the percentage of
polymorphic loci (threshold level at 95%) of
each locus was determined using the formula
as described by Weir (1990)
PIC=1-∑Pij2
Where, Pi is the frequency of the ith allele in
the genotype
The average expected gene diversity was
calculated using the formula given by Nei
(1973) as
Data scoring and analysis
The ISSR band profiles were treated as
dominant markers and each locus was
considered as a bi-allelic locus with one
amplifiable and one null allele. Data were
scored as 1 for the presence and 0 for the
absence of a DNA band for each locus across
the 24 individuals in Acrocarpus fraxinifolius.
Using population genetics computer programs,
genetic diversity within population was
analyzed.
Where, h1, h2 represents intralocus gene
diversity (i.e., hj=(1-p2-q2)
Shannon’s Information Index (I)
The genetic variation was assessed by using
Shannon’s Information Index (Lewontin,
1972)
1613
Int.J.Curr.Microbiol.App.Sci (2019) 8(9): 1611-1624
Where, pi the frequency of the allele ith in the
population.
Clustering
analysis
and
Principal
HT is heterozygosity in the total population
HS is the average heterozygosity in
subpopulation
coordinates
More than one level of population
Unweighted Pair Group Method with
Arithmetic mean dendrogram or phenogram
was constructed using set of variable data
using distance based method as suggested by
(Sneath and Sokal, 1973) and neighbor joining
(NJ) (Saitou and Nei, 1987). The clustering
and principal coordinate analysis (PCoA) of
24 populations was performed using DARwin
version 6 software and PCoA relates the
relationship between distance matrix elements
based on their first two principal coordinates.
Coefficient of gene differentiation for more
than one level of structure for the total
population (FSR and FST) was measured by
using the formulae as given by Weir and
Cockerham (1984)
Partition the variation into the diversity among
subpopulation within a evergreen forest belt
Genetic differentiation
At the one level of population
Coefficient of gene differentiation for one
level of structure for the total population
(GST) was measured by using the formula as
given by Nei (1973)
GST
Where, GST is measure of the relative
differentiation among subpopulation
Where, HR is the Mean allelic frequency
within each group
Fixation index (FST) is a measures or values
that could help to understand the degree of
population differentiation within species. It is
developed as a special case of Wright‘s Fstatistics as the most commonly used statistics
in population genetics studies.
Details of the leaf material used for genetic diversity in selected tree species
Sl
No.
1.
2.
3.
4.
Landscape
element
Natural forests,
sacred grove
sand coffee
plantations
Sample code
ONT
NANG
HUD
SHAN
Name of the
place
Ontiyangadi
Nangala
Hudikeri
Shantalli
Latitude (N)
12º 11’55.21”
12º 9’0.14”
12º 1’38.03”l
12º 28’52.91”
Longitude (E)
75º 48’3.55”
75º 47’54.56”l
75º 52’42.10”
75º 47’36.53”
ISSR Primers used for PCR amplification
ISSR Primer
UBC873
Sequence
(GACA)4
Annealing Temperature (ºC)
50
ISSR3
ISSR4
ISSR6
DBDA(CA) 7
HVH(CA)7
(CA)8RY
45
45
55
1614
Altitude
(m)
906
899
833
1130
Int.J.Curr.Microbiol.App.Sci (2019) 8(9): 1611-1624
Analysis of Molecular Variance
Analysis of Molecular Variance (AMOVA) is
a method to detect population differentiation
utilizing molecular markers and calculated
using the software GenAIEx (Peakall and
Smouse, 2006).
landscapes showed relatively higher diversity.
While the sacred grove and coffee plantations
populations recorded higher diversity (0.3779
and 0.5601: 0.3661 and 0.5403, respectively)
than natural forest population (0.2982 and
0.4567). This data clearly suggests that the
farmers have conserved a higher level of
diversity.
Results and Discussion
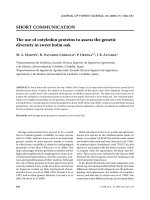
A total of 24 ISSR markers were used for this
study, but only 14 ISSR primers were
successfully amplified for 8 samples (Table 1
and Fig.1). Only bands that were consistently
reproduced across amplifications were
considered for the analysis. Bands with the
same mobility were considered as identical
fragments, receiving equal values, regardless
of their staining intensity (Fig.1). When
multiple bands in a region were difficult to
resolve, data for that region of the gel was not
included in the analysis. Fourteen primers
produced a total of 83 bands among the
Acrocarpus fraxinifolius populations. The size
of the amplified products ranged from 100 bp
to 200 bp. The number of scorable bands
produced per primer ranged from 1 to 39. Of
the 83 amplified fragments, 41 were
polymorphic with average number of bands
per primer and average polymorphic bands per
primer to be 5.92 and 2.92 respectively. The
total number of polymorphic bands and the
percentage of polymorphism ranged from 13
to 14 and 92.86 % to 100 % respectively. The
observed number of alleles and effective
number of alleles per locus was highest and
comparable among individuals sampled from
sacred groves and coffee plantations (2.0000
each: 1.6511 and 1.6456, respectively), while
those from the natural forests found to be
lowest (1.9286 and 1.4873, respectively). The
diversity computed based Nei's formulae and
Shannon's
information
index
showed
consistent results.
Sampled populations from all the three
The highest percentage of polymorphic loci
was found among sacred groves and coffee
plantations (100%). The level of genetic
diversity based on Nei's formulae and
Shannon's
information
index
showed
relatively higher in sacred groves and coffee
plantations (0.3779 and 0.5601: 0.3661 and
0.5403, respectively) than natural forests
(0.2982 and 0.4567). Sezen et al., (2006) who
found that the levels of Miconia affinis genetic
diversity within the coffee farms and forest
populations were similar and agricultural
colonization is a strong spatial genetic
structure. The colonization pattern and high
genetic diversity of M. affinis also points to
the role of shade coffee farms as potential foci
of native forest regeneration. The results also
strongly confirm with findings of Gafar et al.,
(2014) who assessed genetic diversity using
inter-simple sequence repeat (ISSR) markers
for Breonadia salicina and found higher
percentage of polymorphic loci (PPL) at the
population level ranging from 17.1 to 23.7%,
with an average of 21.3%. Nei’s gene
diversity (h) and Shannon’s information index
(I) values were (0.086 and 0.125 respectively)
lower than our findings.
The coefficient for gene differentiation for one
level of structure (GST) i.e., relative
differentiation among sub populations of
Acrocarpus fraxinifolius was more (0.6440)
where as at the two structure (FST) i.e.,
partition of the variation for the total
population was less (0.1722) and within the
population in the landscape elements was
high.
1615
Int.J.Curr.Microbiol.App.Sci (2019) 8(9): 1611-1624
Table.1 Genetic diversity of Acrocarpus fraxinifolius populations within different landscape elements of transition forest belt based
on ISSR markers (Sample size: 8 in each landscape element).
Number of
Polymorphic loci
(NPL)
Percentage of
polymorphic loci
(PPL)
Observed number
of alleles
(na)
Effective number
of alleles
(ne)
Nei’s genetic
diversity
(h)
Shannon’s
Information
Index (I)
Natural forest
13
92.86
1.9286 (±0.2673)*
1.4873 (±0.3122)*
0.2982 (±0.1530)*
0.4567 (±0.2004)*
Sacred grove
14
100
2.0000 (±0.0000)
1.6511 (±0.2724)
0.3779 (±0.1081)
0.5601 (±0.1217)
Coffee plantations
14
100
2.0000 (±0.0000)
1.6456 (±0.3180)
0.3661 (±0.1470)
0.5403 (0.1777)
Mean
13.667
97.62
1.9762
1.5947
0.3474
0.5190
t-value
41.000
41.017
83.034
29.692
13.988
16.380
p-value
0.0005
0.000
0.0001
0.0011
0.0050
0.0037
Population
t- value is based on one sample analysis , P- values < 0.05 is significant at 95% confident interval, *values in parentheses indicate standard
deviation from mean value
1616
Int.J.Curr.Microbiol.App.Sci (2019) 8(9): 1611-1624
Table.2 Details of genetic diversity of selected tree species using ISSR primers
Sl No.
Parameters
Acrocarpus fraxinifolius
1
Numbers of primer used
14
2
Amplified product range (bp)
3
Total number of polymorphic bands
41
4
Total number of monomorphic bands
42
5
Total number of bands
83
6
Average percentage of polymorphic (%)
97.62
7
Average number of bands/primer
5.92
8
Average number of polymorphic bands/primer
2.78
100-200
Table.3 Analysis of molecular variance (AMOVA) for 24 individuals sampled from natural forests,
sacred groves and coffee plantations in transition forest belt using ISSR markers
Source
df
SS
MS
Estimated
Variance
% Variation
FST
P value
Among populations
2
7.333
3.667
0.164
6.00
0.065
0.112
Within populations
21
49.500
2.357
2.357
94.00
0.935
Total
23
56.833
2.521
100.00
Table.4 Coefficient of gene differentiation for one level and more than one level of structure for
the total population in three landscape elements of transition forest belt studied based on
Nei’s genetic diversity using ISSR markers.
Tree species
Acrocarpus
fraxinifolius
hS
hT
hS/hT
GST
FST
FSR
0.3474
0.9761
0.3559
0.6440
0.1722
0.6963
Where hS: Average heterozygosity in sub populations, h T: Heterozygosity in the total population, G ST: Relative
differentiation among sub population, FST: Partition of the variation for the total population and F SR: Partition of
the variation into the diversity among subpopulation within a zone
1617
Int.J.Curr.Microbiol.App.Sci (2019) 8(9): 1611-1624
ISSR3 (DBDA(CA) 7)
ISSR4 (HVH(CA)7
UBC873 ((GACA)4
Fig.1 Bands obtained using ISSR primers for Acrocarpus fraxinifolius populations
1618
Int.J.Curr.Microbiol.App.Sci (2019) 8(9): 1611-1624
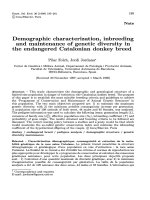
Fig.2 Hirerachial clustering of Acrocarpus fraxinifolius populations in different landscape elements of transition forest belt
Natural forests
Sacred groves
Coffee plantations
1619
Int.J.Curr.Microbiol.App.Sci (2019) 8(9): 1611-1624
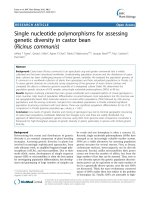
Fig.3 Principal co-ordinate analysis (PCoA) for Acrocarpus fraxinifolius populations in transition forest belt
1620
Int.J.Curr.Microbiol.App.Sci (2019) 8(9): 1611-1624
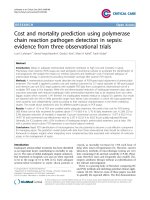
Fig.4 UPGMA phenogram based on Jaccard’s dissimilarity coefficient for 24 populations of
Acrocarpus fraxinifolius based on Nei’s minimum genetic distance (Hierarchical
joining)
1621
Int.J.Curr.Microbiol.App.Sci (2019) 8(9): 1611-1624
Fig.5 Neighbour joining tree for 24 populations of
Acrocarpus fraxinifolius based on Nei’s
standard genetic distance.
1622
Natural forests
Sacred groves
Coffee plantations
Int.J.Curr.Microbiol.App.Sci (2019) 8(9): 1611-1624
The higher and lower coefficients of gene
differentiation may be due to higher wind
pollination within the populations. Most of the
trees were planted in coffee plantations of the
zone resulted in more gene differentiation
within the sub populations (Table 3).
Analysis of molecular variance (AMOVA)
assigns a higher variation within populations
(94.00%) (Table 4). The higher variation
could be attributed to outcrosses by wind and
higher gene flow within the populations as
described by Nybom (2004).
The populations of Acrocarpus fraxinifolius
growing in natural forests of VRJP ONTI
formed a separate cluster and SMVRPT,
BIRU HUDKERI population growing in
coffee plantation formed separate cluster.
However, the species was ubiquitous over
sacred groves and more linked to coffee
plantation as farmers of the region intensively
cultivate the species for its known use and leaf
shedding character in rainy season, favouring
for light penetration to coffee plantations
(Fig.2 and 3).
Based on UPGMA phenogram based on
Jaccard’s dissimilarity coefficient for 24
populations of Acrocarpus fraxinifolius based
on Nei’s minimum genetic distance indicated
that natural forests populations of NANG,
HUD, sacred groves of HUD and coffee
plantations of SHAN, HUD and ONT had
lower dissimilarity and higher dissimilarity in
their genetic differentiation than the others
(Fig.4 and 5).
The maintenance of genetic variation is
essential for long-term survival of a species
since genetic diversity provides a species’
evolutionary potential. In the present study
ISSR marker was employed to assess the
levels of genetic diversity of Acrocarpus
fraxinifolius. Genetic diversity in Acrocarpus
fraxinifolius populations in the three landscape
elements of transitional forest belt indicated
that the observed number of alleles and
effective number of alleles per locus was
highest and comparable among the individuals
sampled from sacred groves and coffee.
Sacred groves and coffee plantations
population recorded higher diversity aims at
planning for future conservation areas.
References
Barker, J. S. F., 2001: Conservation and
management of genetic diversity: a
domestic animal perspective. Canadian
Journal of Forestry Research, 31: 588–
595.
Doyle, J.J., Doyle, J., 1987: A rapid DNA
isolation procedure for small quantities
of fresh leaf tissue. Phytochem. Bull.
19: 11–15.
Gafar, Z., Fahad Al-Qurainy., Salim Khan.,
2014: Assessment of genetic diversity
in the endangered populations of
Breonadia
salicina
(Rubiaceae)
growing in the Kingdom of Saudi
Arabia using inter-simple sequence
repeat markers. Genetics, 15:1-10.
Kimura, M., Crow, J. F., 1963: The
measurement of effective population
number. Evolution, 17: 279-288.
Lee, S. L., Ng, K. K. S., Saw, L. G., Lee, C.
T., Muhammad, N., Tani, N., Tsumura,
Y., Koskela, J., 2006: Linking the gaps
between conservation research and
conservation management of rare
dipterocarps: A case study of Shorea
lumutensis. Biological Conservation,
131:72-92.
Lewontin, R.C., 1972: The apportionment of
human
diversity.
Evolutionary
Biology, 6: 381–398.
Naik, D., Singh, D., Vartak, V., Paranjpe, S.,
Bhargava, S., 2009: Assessment of
morphological and genetic diversity in
Gmelina arborea Roxb. New Forest,
38 (1):99-115.
1623
Int.J.Curr.Microbiol.App.Sci (2019) 8(9): 1611-1624
Nan, P., Shi, S., Peng, S.L., Tian, C.J., Zhong,
Y., 2003: Genetic diversity in Primula
obconica (Primulaceae) from central
and south-west China as revealed by
ISSR markers. Annals of Botany, 91
(3):329-333.
Nei, M., 1973: Analysis of gene diversity in
subdivided populations. Academia
Science, 70: 3321–3323.
Nybom, H., 2004: Comparison of different
nuclear DNA markers for estimating
intraspecific genetic diversity in plants.
Molecular Ecology, 13: 1143-1155.
Onyango, G., Ekakoro, E., Sang J., 2010:
Emiti Nibwo Bulora wood lot
technical
specication.
SCC-Vi
Agroforestry.
Orwa, C.A., Mutua Kindt, R., Jamnadass, R.,
Anthony, S., 2009: Agroforest tree
Database : a tree reference and
selection guide version 4.0.
Peakall, R., Smouse, P. E., 2006: GenALEx 6:
Genetic analysis in Excel. Population
genetic software for teaching and
research. Mol. Ecol. Notes, 6: 288-295.
Reddy, M.P., Sarla, N., Siddiq, E.A., 2002:
Inter simple sequence repeat (ISSR)
polymorphism and its application in
plant breeding. Euphytica, 128 (1):9-
17.
Saitou, N., Nei, M., 1987: The neighborjoining method: a new method for
reconstructing phylogenetic trees.
Molecular Biology and Evolution, 4:
406-425.
Sezen, U.U., Chazdon, R.L., Holsinger, K.E.,
2006: Genetic consequences of tropical
second-growth forest regeneration.
Science, 307: 891.
Sneath, P. H. A., Sokal, R. R., 1973:
Numerical taxonomy. W. H. Freeman
and Company, San Francisco.
Weir, B. S., 1990: Genetic data analysis Methods for discrete genetic data.
Sinauer Associates Inc Sunderland.
Weir, B.S., Cockerham, C., 1984: Estimating
F statistics for the analysis of
population structure. Evolution, 38(6):
1358-1370.
Zietkiewicz, E., Rafalski, A., Labuda, D.,
1994: Genome fingerprinting by
simple sequence repeat (SSR)anchored polymerase chain reaction
amplification. Genomics, 20 (2):176183.
How to cite this article:
Maheswarappa, V., R. Vasudeva, Ramakrishna Hegde and Ravikanth, G. 2019. ISSR Analysis
of genetic diversity in Acrocarpus fraxinifolius from three landscape elements of transition
forest belt of Kodagu district, Karnataka, India. Int.J.Curr.Microbiol.App.Sci. 8(09): 16111624. doi: />
1624