Differential response of QPM, hybrid and composite maize cultivars to INM schedules
Bạn đang xem bản rút gọn của tài liệu. Xem và tải ngay bản đầy đủ của tài liệu tại đây (452.29 KB, 13 trang )
Int.J.Curr.Microbiol.App.Sci (2019) 8(9): 2142-2154
International Journal of Current Microbiology and Applied Sciences
ISSN: 2319-7706 Volume 8 Number 09 (2019)
Journal homepage:
Original Research Article
/>
Differential Response of QPM, Hybrid and
Composite Maize Cultivars to INM Schedules
Ananya Chakraborty*, Sritama Biswas, Rajarshi Banerjee,
Pintoo Bandopadhyay and Srijani Maji
Department of Agronomy, Bidhan Chandra Krishi Viswavidyalaya,
Mohanpur-741252, Nadia, West Bengal, India
*Corresponding author
ABSTRACT
Keywords
Maize, cultivars,
INM, growth, yield,
harvest index,
economics.
Article Info
Accepted:
20 August 2019
Available Online:
10 September 2019
To understand the performance of QPM, hybrid and composite maize to rationalized
Nitrogen nutrition, a two year experiment was conducted in the rabi season of 2017-2018
and 2018-2019 at Mondouri experimental farm, Bidhan Chandra Krishi Viswavidyalaya,
Nadia, West Bengal, situated at 22°56’ N latitude, 88°32’ E longitude. It was laid in split
plot design with three cultivars in the main plot – HQPM4 (Quality Protein Maize),
Shresta (single cross hybrid) and NAC 6004 (composite variety); the sub plots had 6
nutrient schedules in i) T1: control, ii) T2: RDF, iii) T3: RDN75 + Vermicompost @ 2 t/ha,
iv) T4: T3+ Azotobactor @ 2kg/ha, v) T 5: T4+ Zn, vi) T6: RDN50 + Vermicompost @ 2 t/ha
+ Azotobactor @ 2kg/ha + Zn. A recommended fertilizer dose of 180:80:80 kg NPK ha -1of
which P, K and 20% N were applied as basal dose and remaining dose of N was applied as
top dressing splits 25% at 1st top dressing at 4 leaf stage, 30% as 2nd top dressing at 8 leaf
stage, 20% as 3rd top dressing at tasselling stage and 5% was top dressed at the grain filling
stage. Vermicompost @ 2 tonnes/ha as per treatment were applied and ZnSO 4 @ 20 kg/ha
was applied in the soil 3days before sowing. Among three maize cultivars hybrid Shresta
may be recommended for the eastern plains and HQPM 4 also enjoyed good production
potential. It is also concluded that inorganic fertilizer N can be discounted to the extent of
25% and RDN75 + Vermicompost @ 2 t/ha + Azotobactor@ 2 kg/ha + Zn with respective
economics of 1.86. The economics favoured hybrid maize, Shresta with a value of 2.1
BCR.
Introduction
Consumed by billions of people through the
millennium, cereals cater the key sustenance
in most of the diets. Cereals are grown in over
73% of the total world harvested area and
contribute over 60% of the world food
production providing dietary fibre, protein,
energy, minerals, and vitamins required for
human health (Das et al., 2012). Of the
approximately 2.3 billion tonnes of cereals
currently produced, roughly 1 billion tonnes is
destined for food use, 750 million tonnes is
employed as animal feed, and the remaining
500 million tonnes is processed for industrial
use, used as seed or wasted (FAO 2013). With
the rice posing itself as a water guzzler with
reported lower water productivity of 0.25
2142
Int.J.Curr.Microbiol.App.Sci (2019) 8(9): 2142-2154
kg/M3 in summer, wheat having a value of
0.417 kg/M3 and Maize (summer) having a
value of 0.363 kg/M3 (Kumari et al., 2017).
But weather variability induced increment of
average winter temperature, reported decline
in wheat productivity (Mukherjee et al.,
2019). This leaves maize gaining prominence
in Indian subcontinent. Maize, a C4 plant,
enjoys more efficient photosynthates and also
offers more value addition for nutriment
making it the champion of industries, more
gender compatible and serving as human and
animal food as compared to wheat and rice.
Maize also finds application in industry in a
host of non-food applications (Murdia et al.,
2016).
Since independence, the researchers are in the
process of breeding composites, hybrids and
reported quality protein maize cultivars in the
recent past. Incapability of desirable
characteristics fixation and yield gap posed
difficulty in mass cultivation of composite
maize which afterwards became restricted
within some tribal pockets and sporadic
groups of people where animal feed from
maize also prevails. This made hybrid maize
more popular. To address the protein
malnutrition among children in the developing
countries, breeding for enhanced protein
content in maize resulted in advent of Quality
Protein Maize (Prasanna et al., 2001) while
also improving its agronomic and consumer
characteristics (Gunaratna et al., 2019).
Maize being a heavy feeder of nutrients,
nitrogen in particular and affordable farmers
having propensity to practise indiscriminate
fertilizer use, which add to pollution through
losses in soil and water, create a potential
health hazard. Poor framers using suboptimal
fertilizer level also harm the environment
through soil mining. Use of renewable and
non- renewable nutrient not only improves the
physico-chemical characteristics and fertility
of soil but also increase the crop yields by
enhancing the efficiency of applied nonrenewable sources (Lal and Shing, 1998)
which emerged with the integrated plant
nutrient management concept. The use of
renewable resources and inputs is one the
fundamental
principles
of
sustainable
agriculture that enables maximum crop
productivity and minimal environmental risk
incorporating biological fertilizer (Kizilkaya,
2008). The information on growth and yield of
maize cultivars across composite, hybrid and
QPM and their comparison becomes important
to understand the issues of allocation of
nutrients, through both sustainable and
inorganic formats. This work has been tried to
present, comprehensively, the nitrogen
nutrient issue of different types of maize
growers in the country towards more
rationalised nutrient schedules and lower
wastage of nitrogen to reduce costs.
Materials and Methods
The experiment was framed during rabi
season of 2017-2018 and 2018-2019 at
Mondouri experimental farm, Bidhan Chandra
Krishi Viswavidyalaya, Nadia, West Bengal,
situated at 22°56’ N latitude, 88°32’ E
longitude falling under New Alluvial Zone of
West Bengal enjoying sub-tropical humid
climate with short and mild winter. The
location underwent mean annual rainfall of
1457 mm skewed between June to September,
the mean monthly temperature ranges from
10°C-37°C. The experimental soil comes
under the order of Entisol in the USDA
modern taxonomical classification with sandy
loam in texture consisting of 35.5% clay,
39.7% silt, and 24.8% sand with a bulk
density of 1.40 g/cc (0-15cm depth of soil),
almost neutral pH, good drainage capacity and
low available N and P, and medium organic
carbon as well as K status. Standard analytical
procedures were followed for carrying out the
chemical analysis of soil samples (Jackson,
1973).
2143
Int.J.Curr.Microbiol.App.Sci (2019) 8(9): 2142-2154
The experiment was conducted in split plot
design and replicated thrice, where the main
plot treatments comprised maize cultivars in i)
V1: HQPM4 (QPM hybrid maize), ii) V2:
Shresta (Single cross hybrid) and (iii)V3: NAC
6004 (Composite variety); in the sub plot there
was 6 nutrient schedules in i) T1: control, ii)
T2: RDF, iii) T3: RDN75 + Vermicompost @ 2
t/ha, iv) T4: T3+ Azotobactor @ 2kg/ha, v) T5:
T4+ Zn, vi) T6: RDN50 + Vermicompost @ 2
t/ha + Azotobactor @ 2kg/ha + Zn.
A recommended fertilizer dose of 180:80:80
kg NPK ha-1of which P, K, 20% N were
applied as basal dose and remaining dose of N
was administered in the following manner as
top dressing viz. 25% N applied as 1st top
dressing at 4 leaf stage, 30% as 2nd top
dressing at 8 leaf stage, 20% as 3rd top
dressing at tasselling stage and 5% was top
dressed at the grain filling stage.
The required quantity of vermicompost @ 2
tonnes/ha as per treatment were applied for
each respective plots a day before sowing, on
the soil surface and mixed into the soil. Soil
application of ZnSO4 @ 20 kg/ha was done
3days before sowing. The growth attributes
involved final plant height, dry matter
accumulation and LAI (Watson, 1947) taken
during peak growth stage.
Associated characters recorded included
length and girth of cobs. Yield and yield
attributing characters included data on no. of
cobs per plant, grains per cob, test weight,
shelling % and harvest index. Quality
attributes analyzed were crude protein content
as reported in FAO, 2003 and carbohydrate
content.
The statistical analysis of the data generated
during investigation was carried out on
computerized system i.e OP Stat Statistical
Software Package for Agricultural Research
(Sheoran et al., 1998).
Results and Discussion
Growth attributes
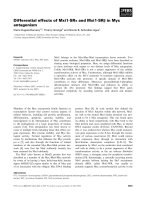
Table1. shows that plant height in 100 DAS
for varietal means were significant in both the
years (2017-18 and 2018-19) with hybrid
maize type scoring the best with 225.72 cm in
1st year and 241.29 cm in 2nd year both being
at par with the HQPM4 and significantly
superior over the NAC 6004 maize cultivar.
The 100 DAS data for shoot weight, along
with values for dry cobs, at that stage, had
Shresta scoring the maximum in both years
with 1008.35 g/m2 in 1st year and 1083.97
g/m2 in 2nd year. HQPM4 also had a
pronounce growth comparative to the NAC
6004 with the value of 998.11 g/m2(2017-18)
and 1079.96 g/m2 (2018-19) and both of the
hybrid varieties were significant over the NAC
6004 maize type (880.00 g/m2) in 1st year as
well as in 2nd year (943.36 g/m2).
Among the N management schedules RDN75+
Vermicompost+ Azotobactor and ZnSO4
application resulted in maximum and
significant plant height (235.27 cm in 2017-18
and 255.03 cm in 2018-19), dry matter
accumulation (1092.18 g/m2 in 2017-18 and
1192.67 g/m2 in 2018-19) and LAI of 3.27 in
the 1st season and 3.41 in the 2nd season.
Similar increasing dry matter in maize with N
nutrition has been reported by Ram et al.,
2009, in conjunction with biofertilizers and
organics by Savalgi and Savalgi, 1992 and by
zinc supplementation by Arya and Singh,
2000. The improvement in LAI values as a
response to organic sources in N management
has been previously reported by Kumar et al.,
2008.
Yield associated characters
Length of cob data revealed the maximum cob
length of hybrid maize was 16.11 cm keeping
at par values with QPM (15.85 cm) and higher
2144
Int.J.Curr.Microbiol.App.Sci (2019) 8(9): 2142-2154
than NAC 6004 (14.84 cm) in the 1st year. In
the 2nd year, hybrid Shresta also emerged
significantly higher with 16.92 cm than NAC
6004 (15.14 cm) cob length. Among the
various nitrogen management schedules
RDN75 + Vermicompost+ Azotobactor and
ZnSO4 application registered significantly
higher mean cob length of 16.61 cm and 17.18
cm in the successive years. Among the three
varietal means of cob girth, hybrid Shresta
proved best with a value of 13.04 cm (2017-
18) and 13.46 cm 2018-19) which were
statistically at par with HQPM4. In both the
seasons, means for nitrogen schedules were
not significant and highest cob girth was
recorded with T5. Increase of such associated
characters such as girth of cobs as a response
to incremental N was previously reported by
Gzazia et al., 2003, biofertilizer addition by
Suke et al., 2010 and by application of Zn by
Mohsin et al., 2014.
Table.1 Effect of nitrogen management schedules on vegetative and yield associated characters
of maize cultivars.
Plant
Height
(cm)
DMA (g/m2)
(100 DAS)
20172018
20182019
Main Plot factor : Variety
210.62 225.78
V1
225.72 241.29
V2
183.59 196.99
V3
6.69
6.94
Sem
26.96
28.02
CD
(0.05)
20172018
20182019
2017
2018
20182019
Associated characters
Ave length of
Average girth
cobs (cm)
of
cobs (cm)
2017- 2018- 201720182018
2019
2018
2019
998.12
1008.35
880.00
24.34
98.26
1079.96
1083.97
943.36
27.31
110.26
3.03
3.02
2.40
0.08
0.34
3.15
3.15
2.48
0.09
0.38
15.85
16.11
14.84
0.48
1.93
16.32
16.92
15.14
0.49
1.99
12.88
13.04
12.55
0.12
0.49
13.24
13.46
12.75
0.11
0.46
678.41
1040.31
1033.20
1129.56
1192.67
1026.05
30.60
2.11
3.17
2.71
3.00
3.27
2.62
0.10
2.05
3.11
2.81
3.11
3.41
2.73
0.09
14.07
16.09
15.87
15.78
16.61
15.19
0.33
14.54
16.63
16.40
16.30
17.18
15.70
0.34
12.86
12.89
12.56
13.03
13.75
11.84
0.44
13.03
13.12
12.84
13.40
14.11
12.40
0.46
88.74
0.30
0.28
0.95
0.98
NS
NS
Sub Plot : N management schedules
176.99 189.38 699.39
T1
228.16 243.90 1050.82
T2
212.38 226.18 957.86
T3
224.51 240.67 1038.20
T4
235.27 255.03 1092.19
T5
203.22 219.48 934.47
T6
4.492
4.98
27.04
Sem
CD
(0.05)
13.03
14.46
78.44
LAI
V1:QPM (HQPM4); V2 : Shresta (hybrid) V3: NAC 6004 (composite), T 1: Control ; T2 RDF;T3 RDN75 + Vermi; T4:
T3+ Azo; T5: T4+ Zn; T6 : RDN50+ Vermi + Azo + Zn
2145
Int.J.Curr.Microbiol.App.Sci (2019) 8(9): 2142-2154
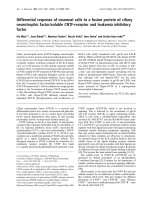
Table.2 Effect of nitrogen management schedules on yield parameters of maize cultivars.
No. of
plant
cobs/
No. of grains/ cob
Average
1000
grain weight of
cobs (g)
Mean weight of
grains/ cob (g)
Mean
dry
weight of cob/
plant (g)
Average
Shelling
percentage (%)
Main Plot factor : Variety
20172018
20182019
20172018
20182019
20172018
20182019
20172018
20182019
20172018
20182019
20172018
20182019
V1
1.51
1.59
401.01
419.55
169.59
169.44
61.63
65.75
92.59
102.70
66.20
63.55
V2
1.52
1.60
374.35
389.79
175.78
176.72
65.96
70.34
96.38
106.07
68.22
66.11
V3
1.25
1.32
345.23
359.22
157.21
156.64
58.46
61.18
87.96
91.32
66.38
66.74
Sem
0.02
0.02
6.50
6.24
0.96
0.97
1.14
1.16
0.70
0.69
1.36
1.39
3.88
3.92
4.58
4.70
2.81
2.79
NS
NS
0.06
0.07
26.21
25.09
CD
(0.05
)
Sub Plot: N management schedules
T1
1.05
1.11
350.61
349.33
147.91
141.41
47.49
44.29
73.13
74.77
61.73
59.32
T2
1.49
1.57
394.16
399.64
176.46
176.64
69.39
71.66
98.94
102.76
70.25
69.74
T3
1.45
1.52
365.9
381.07
169.41
170.51
62.02
65.79
94.16
101.19
65.86
64.97
T4
1.49
1.57
386.93
409.87
178.33
179.03
68.82
72.90
100.39
106.77
68.16
68.24
T5
1.72
1.81
392.99
417.16
179.24
181.36
70.24
77.61
99.93
113.3
70.73
68.72
T6
1.37
1.45
350.60
380.04
153.81
156.64
54.14
62.28
87.32
101.37
64.86
61.79
Sem
0.03
0.032
7.37
7.95
2.27
2.34
1.58
1.73
0.99
1.00
1.70
1.73
CD
(0.05
)
0.09
0.011
21.40
22.83
6.60
6.73
4.59
4.98
2.85
2.89
4.93
4.99
V1:QPM (HQPM4); V2 : Shresta (hybrid) V3: NAC 6004 (composite), T 1: Control ; T2 RDF;T3 RDN75 + Vermi; T4:
T3+ Azo; T5: T4+ Zn; T6 : RDN50+ Vermi + Azo + Zn
2146
Int.J.Curr.Microbiol.App.Sci (2019) 8(9): 2142-2154
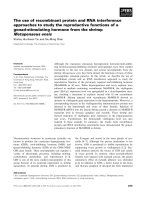
Table.2(a) Interaction of nitrogen management schedules and varieties on yield parameters of
maize cultivars.
No. of
plant
cobs/
No. of grains/
cob
Average
1000
grain weight of
cobs (g)
Mean weight of
grains/ cob (g)
Mean
dry
weight of cob/
plant (g)
Average
Shelling
percentage (%)
20172018
20182019
20172018
20182019
20172018
20182019
20172018
20182019
20172018
20182019
20172018
20182019
V1T1
1.20
1.26
379.14
384.31
146.54
138.86
40.39
37.86
68.24
67.56
59.41
56.05
V1T2
1.63
1.72
411.34
417.79
187.72
188.06
68.09
70.95
98.15
103.23
69.42
68.71
V1T3
1.51
1.57
376.11
391.15
163.81
164.1
59.56
65.54
92.62
105.10
64.46
62.39
V1T4
1.56
1.65
422.50
449.40
175.67
175.99
70.06
74.78
101.67
109.79
69.00
68.13
V1T5
1.77
1.84
429.90
452.10
186.11
186.44
70.58
79.21
100.55
117.59
70.25
67.39
V1T6
1.42
1.51
387.09
422.57
157.67
163.16
61.11
66.17
94.34
112.94
64.64
58.60
V2T1
1.06
1.12
354.82
346.24
153.81
149.73
54.63
50.76
84.67
87.61
64.60
57.91
V2T2
1.58
1.68
398.71
404.66
175.98
176.68
70.12
71.42
100.01
104.44
70.11
68.36
V2T3
1.56
1.64
373.89
389.98
186.06
187.8
69.63
72.79
99.60
104.62
69.83
69.60
V2T4
1.56
1.65
373.92
397.01
193.52
195.69
72.38
77.48
101.03
108.10
70.27
71.70
V2T5
1.91
2.03
384.24
407.69
187.79
190.14
72.12
81.02
102.98
121.19
71.41
66.88
V2T6
1.42
1.51
360.52
393.14
157.53
160.26
56.91
68.58
90.00
110.45
63.09
62.19
V3T1
0.88
0.93
317.86
317.44
143.37
135.64
47.46
44.26
66.50
69.16
61.18
64.01
V3T2
1.27
1.32
372.42
376.48
165.68
165.18
69.95
72.61
98.67
100.62
71.22
72.14
V3T3
1.27
1.34
347.70
362.09
158.35
159.63
56.88
59.04
90.25
93.86
63.3
62.91
V3T4
1.34
1.41
364.37
383.21
165.81
165.42
64.02
66.45
98.49
102.43
65.21
64.90
V3T5
1.48
1.57
364.84
391.69
163.81
167.50
68.03
72.62
96.27
101.12
70.53
71.88
V3T6
1.27
1.34
304.19
324.40
146.23
146.49
44.40
52.09
77.61
80.71
66.87
64.58
VXT
VXT
VXT
VXT
VXT
VXT
Sem
0.05
0.06
13.35
14.01
3.72
4.38
2.75
2.74
2.52
2.67
3.01
3.05
CD
(0.05)
NS
NS
NS
NS
11.09
13.11
8.50
8.20
7.54
8.01
NS
NS
TXV
TXV
TXV
TXV
TXV
TXV
Sem
0.04
0.04
12.17
13.62
2.36
2.77
2.78
2.81
1.71
1.70
3.32
3.38
CD
(0.05)
NS
NS
60.54
63.24
11.73
12.89
NS
NS
7.94
7.89
NS
NS
V1:QPM (HQPM4); V2 : Shresta (hybrid) V3: NAC 6004 (composite), T1: Control ; T2 RDF;T3 RDN75 + Vermi; T4:
T3+ Azo; T5: T4+ Zn; T6 : RDN50+ Vermi + Azo + Zn
2147
Int.J.Curr.Microbiol.App.Sci (2019) 8(9): 2142-2154
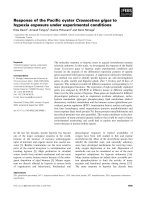
Table.3 Effect of nitrogen management schedules on yield and quality attributes of maize
cultivars
Grain yield (t/ha)
Stover
(t/ha)
yield
Harvest
(%)
Index
Protein
(%)
content
Carbohydrate
content (%)
Main Plot factor : Variety
20172018
20182019
20172018
20182019
20172018
20182019
20172018
20182019
20172018
20182019
V1
6.77
7.66
8.72
9.04
42.98
44.97
10.60
10.75
64.90
57.11
V2
7.19
8.26
8.88
9.20
44.09
46.60
7.77
7.81
66.12
66.82
V3
5.26
5.82
7.68
8.11
40.08
41.24
7.13
7.05
62.47
62.61
Sem
0.12
0.13
0.15
0.16
0.70
0.72
0.121
0.13
0.93
0.94
0.66
2.84
2.91
0.49
0.51
3.75
3.81
0.48
0.55
0.59
CD
(0.05)
Sub Plot: N management schedules
T1
3.52
3.43
6.16
5.77
36.35
37.25
6.48
6.07
60.90
56.42
T2
7.35
7.61
8.87
9.28
45.22
44.99
8.89
8.86
65.82
63.02
T3
6.37
7.04
8.43
9.21
42.79
43.11
8.71
8.82
64.44
61.94
T4
7.29
8.10
9.25
9.85
43.93
45.04
9.18
9.39
65.71
63.84
T5
8.61
9.74
9.61
10.10
47.05
48.89
9.38
9.60
66.51
64.38
T6
5.31
7.56
8.22
8.50
38.97
46.33
8.35
8.45
63.60
63.48
Sem
0.21
0.22
0.17
0.20
0.96
1.02
0.11
0.12
1.27
1.30
CD
0.59
0.66
0.49
0.58
2.80
2.94
0.337
0.35
N/S
N/S
(0.05)
V1:QPM (HQPM4); V2 : Shresta (hybrid) V3: NAC 6004 (composite), T 1: Control ; T2 RDF;T3 RDN75 + Vermi;
T4: T3+ Azo; T5: T4+ Zn; T6 : RDN50+ Vermi + Azo + Zn
2148
Int.J.Curr.Microbiol.App.Sci (2019) 8(9): 2142-2154
Table.3(a) Interaction of nitrogen management schedules and varieties on yield and quality
attributes of maize cultivars
Grain
(t/ha)
20172018
V1T1
yield
20182019
Stover
(t/ha)
20172018
3.48
3.36
V1T2
7.93
V1T3
20182019
Harvest
(%)
20172018
20182019
Protein
(%)
20172018
20182019
Carbohydrate
content (%)
201720182018
2019
6.53
5.99
34.77
35.91
7.00
6.72
62.23
50.88
8.06
9.18
9.53
46.35
45.8
11.34
11.45
65.56
56.46
6.30
6.92
9.04
9.78
41.07
41.42
11.19
11.39
64.86
56.08
V1T4
7.81
8.43
9.64
10.22
44.76
45.25
11.83
12.10
66.14
59.23
V1T5
8.94
10.41
9.89
10.54
47.48
49.7
12.07
12.36
66.66
59.10
V1T6
6.18
8.74
8.03
8.15
43.49
51.72
10.19
10.44
63.97
60.94
V2T1
4.11
4.02
6.81
6.27
37.67
39.09
7.19
6.61
61.74
60.81
V2T2
7.84
8.18
9.31
9.65
45.71
45.88
7.84
7.92
67.45
68.80
V2T3
7.69
8.43
8.55
9.55
47.35
46.91
7.56
7.70
65.89
66.55
V2T4
7.99
9.00
9.47
10.12
45.76
47.09
8.15
8.34
67.77
68.45
V2T5
9.76
10.92
9.92
10.16
49.59
51.79
8.44
8.64
68.98
70.01
V2T6
5.75
9.02
9.20
9.43
38.46
48.86
7.44
7.63
64.86
66.29
V3T1
2.97
2.92
5.14
5.03
36.62
36.75
5.25
4.88
58.74
57.57
V3T2
6.28
6.59
8.12
8.65
43.61
43.29
7.50
7.20
64.44
63.80
V3T3
5.12
5.76
7.70
8.29
39.94
41.00
7.38
7.38
62.57
63.20
V3T4
6.07
6.87
8.64
9.20
41.26
42.78
7.56
7.74
63.21
63.84
V3T5
7.12
7.89
9.03
9.59
44.09
45.19
7.63
7.81
63.89
64.02
V3T6
4.00
4.92
7.44
7.90
34.97
38.40
7.44
7.29
61.98
63.22
VXT
yield
VXT
Index
VXT
content
VXT
VXT
Sem
0.35
0.39
0.30
0.33
1.68
1.68
0.220
0.23
2.21
2.43
CD
(0.05)
NS
1.16
NS
0.98
NS
NS
0.713
0.73
NS
NS
TXV
Sem
0.39
TXV
0.43
0.36
TXV
0.39
1.72
TXV
1.72
0.29
TXV
0.31
2.27
2.36
CD
1.92
2.01
NS
NS
NS
NS
0.653
0.68
NS
NS
(0.05)
V1:QPM (HQPM4); V2 : Shresta (hybrid) V3: NAC 6004 (composite), T 1: Control ; T2 RDF;T3 RDN75 + Vermi; T4:
T3+ Azo; T5: T4+ Zn; T6 : RDN50+ Vermi + Azo + Zn
2149
Int.J.Curr.Microbiol.App.Sci (2019) 8(9): 2142-2154
Table.4 Mean Economics of different maize cultivars of 2017-18 and 2018-19 influenced by
Nutrient management schedules
V1
V2
V3
Net
Return
(Rs.)
BCR
Net
Return
(Rs.)
BCR
Net
Return
(Rs.)
BCR
Net
Mean Return
(Rs.)
T1
T2
T3
T4
T5
T6
Mean
30764.0
0
1.92
88109.0
0
2.99
53492.0
0
1.27
72548.0
0
1.67
86630.0
0
1.91
49214.0
0
1.15
63459.5
0
1.82
46612.0
0
2.91
87712.0
0
2.98
72516.0
0
1.72
76106.0
0
1.76
99577.0
0
2.20
44708.0
0
1.05
71205.1
7
2.10
31296.0
0
2.23
67126.0
0
2.45
37401.0
0
0.93
50321.0
0
1.22
63504.0
0
1.47
20704.0
0
0.51
45058.6
7
1.47
36224.0
0
2.35
80982.3
3
2.81
54469.6
7
1.31
66325.0
0
1.55
83237.0
0
1.86
38208.6
7
0.90
BCR
V1:QPM (HQPM4); V2 : Shresta (hybrid) V3: NAC 6004 (composite), T 1: Control ; T2 RDF;T3 RDN75 + Vermi; T4:
T3+ Azo; T5: T4+ Zn; T6 : RDN50+ Vermi + Azo + Zn
Yield attributes
Among the yield parameters shown in Table
no.2, no. of cobs per plant is most contributory
parameter for final yield. Shresta had 1.52
mean numbers of cobs and HQPM4 had 1.51
in 2017-18 and the corresponding values were
1.60 and 1.59 in 2018-19. Test weight varies
little among varieties and the table reveals that
Shresta enjoyed the highest mean test weight.
The mean weight of grains per cob were
highest for Shresta in both the seasons (65.96
g and 70.34 g respectively) with quite close
performance of HQPM4 (61.63 g and 65.75 g
respectively) having at par values.
The mean dry weight of cob was highest for
Shresta (96.38 g and 106.07 g in respective
seasons) which was significantly superior over
HQPM4 (92.59 g and 102.70 g in respective
years) and the improvement in cob weight in
the 2nd year implies the compounding effect of
organic sources, such findings were also made
by Zhang et al., 2016. Mean number of
grains per cobs in HQPM4 were
significantly higher 401.01 and 419.55 in the
successive years. Varying performance of
maize varieties in grain yield was reported by
Assaduzzaman et al., 2014.
Among the nutrient schedules T5 had the
highest mean number of cobs (1.72 in 201718 and 1.81 in 2018-19). Also highest number
of grains per cob at par with T5 (392.99) and
T4 (386.93) in 2017-18, highest number of
grains per cob, test weight in the successive
years, grain weight per cob (70.24 g in 201718 and 77.61 g in 2018-19) and mean dry
2150
Int.J.Curr.Microbiol.App.Sci (2019) 8(9): 2142-2154
weight of cobs along with implied shelling %
(70.73% in 17-18 and 69.74% in 18-19) were
significantly higher in N management
schedules of 75 % N along with
vermicompost,
Azotobactor
and
Zn
conjunction. Effect of INM coupled
biofertilizer sources and Zn was also reported
to be better in maize by Khan et al., 2008,
Ram et al., 2009 on INM –N sources by
Shinde et al., 2011 and numerous other
workers.
Yield
Shresta had the highest significant yield of
7.19 t/ha in 2017-18 and was at par with
Improvement of stover yield by N
administration through compost was reported
by Shinde et al., 2011 and Khan et al., 2008.
Biofertilizer
application
significantly
improved stover yield in experiments
conducted by Balyan et al., 2006.
In both the seasons, among the varieties,
Shresta performed the best with the harvest
index of 44.09% and 46.60% respectively
which were at par with HQPM4 (42.98% and
44.97%) with HI of both were superior and
significant over NAC 6004 maize type in both
the seasons. The management schedule which
proved to be the best was T5, enjoying a mean
HI of 47.05% and 48.89% in the respective
years. The interaction values for HI were not
significant. Mohsin et al., 2014 also reported
highest harvest index by application of zinc.
HQPM4 (6.77 t/ha) while in the 2nd year it was
significantly higher than HQPM4 (7.66 t/ha).
RDN75 + Vermicompost @ 2 t/ha +
Azotobactor @ 2kg/ha+ Zn was the best
nutrient schedule and it performed best with
Shresta, hybrid maize (9.76 t/ha in 2017-18
and 10.92 t/ha in 2018-19), integrated sources
using compost was reported with greater grain
yield by Rajasingh et al., 2014. The stover
yield of both the hybrid cultivars (HQPM4
and Shresta) were at par in both the seasons.
In both the seasons among the management
schedules T5 performed the best with 9.61 t/ha
and 10.10 t/ha of stover yield respectively.
and 9.60% in respective years. Findings of
Ram et al., 2009 corroborates that organic
sources result in greater grain protein content
and Karki et al., 2005, observed similar
findings. Balai et al., 2011 observed improved
carbohydrate in maize with application of
compost sources. Comparable mean protein
content of QPM has been supported by
literature (Alamerew, 2008).
The mean maximum net return was obtained
by variety Shresta (Rs. 71205.17/-) and mean
BCR was 2.10 which was followed closely by
HQPM4 (Table No. 4). Among the nutrient
schedules the maximum net return was
registered by RDN75 + Vermicompost @ 2
t/ha + Azotobactor@ 2kg/ha+ Zn amounting
to Rs. 83237.67/- with a corresponding mean
BCR of 1.86. The combination of the above
treatments (V2T5) achieved a BCR of 2.20 and
net revenue of (Rs. 99577/-) per hectare.
Quality Attributes
HQPM4 had the significantly higher protein
content of 10.60% and 10.75% in 2017- 18
and 2018-19 respectively while Shresta had
significantly higher carbohydrate content of in
the respective years, keeping two other
cultivars far behind. N management schedules
75 % N along with vermicompost, azotobactor
and zinc had higher protein content of 9.38%
Among three maize cultivars hybrid Shresta
may be recommended for the eastern plains
and HQPM4 also enjoys good production
potential. It is also concluded that inorganic
fertilizer N can be discounted to the extent of
25% and RDN75 + Vermicompost @ 2 t/ha +
Azotobactor@ 2kg/ha+ Zn with respective
economics of 1.86. The economics was
2151
Int.J.Curr.Microbiol.App.Sci (2019) 8(9): 2142-2154
favoured for the single hybrid maize, Shresta
with a value of 2.10 BCR.
Acknowledgement
Authors are very thankful to the Department
of Agronomy, Faculty of Agriculture, Bidhan
Chandra Krishi Viswavidyalaya, Nadia, West
Bengal for catering all the necessary facilities
and
support
for
the
successful
experimentation.
References
Alamerew, S. 2008. Protein, tryptophan and
lysine content in Quality Protein
Maize, North India.
2008. Ethiop J Health Sci., 18(2): 9-14.
Allah, W., Tahir, Muhammad., Manaf, Abdul.,
Ahmed, M., Kaleem, S., Ahmad, I.
2011. Improving maize productivity
through
tillage
and
nitrogen
management. African Journal of
Biotechnology, 10 (82): 19025-19034.
Anjorin, F. B. 2013. Comparative Growth and
Grain Yield Response of Five Maize
Varieties to Nitrogen Fertilizer
Application. Greener Journal of
Agricultural Sciences, ISSN: 22767770, ICV: 6.15, 3 (12), pp. 801-808.
Arya, K.C., Singh, S.N. 2000. Effect of
different levels of P and Zn on yield
and nutrient uptake of maize (Zea
mays L.) with and without irrigations.
Indian J. Agron., 45(4): 717-721.
Asaduzzaman, M., Biswas, M., Islam, N.,
Rahman, M. M., Begum, R., Rahman,
M. A. 2014. Variety and N-Fertilizer
Rate Influence the Growth, Yield and
Yield Parameters of Baby Corn (Zea
mays L.). Journal of Agricultural
Science, 6(3), ISSN 1916-9752 EISSN 1916-9760.
Balai, M. L., Arvind, V., Nepalia, V.,
Kanthaliya. 2011. Productivity and
quality of maize (Zea mays L.) as
influenced by integrated nutrient
management
under
continuous
cropping and fertilization. Indian J.
Agric. Sci., 81: 374-376.
Balyan, J. K., Singh, P., Jain, L. K., Jat, M. L.
2006. Maize (Zea mays
L.)
productivity in response to integrated
nutrient management in southern
Rajasthan. Curr.Agric.Curr. Sci., 13:
129-132.
Dadhich, S. K., Somani, L. L., Shilpkar, D.
2011. Effect of integrated use of
fertilizer P, FYM and biofertilizers on
soil properties and productivity of
soybean-wheat crop sequence. Adv.
Dev. Res., 2: 42-46.
Das, A., Raychaudhuri, U., Chakraborty, R.
2012. Cereal based functional food of
Indian subcontinent: a review. J. Food
Sci Technol., 49(6):665-72. doi:
10.1007/s13197-011-0474-1.
Dhoke, N. R., Dahatonde, B. N., Thakur, M.
R., Ulemale, R. B. 2007. Soil nutrient
balance,
its
physico-chemical
properties and yield of maize as
influenced by integrated nutrient
management. Crop Prot. Prod. J., 4(1):
21-23.
FAO statistical yearbook. 2013. Feeding the
world. Pp 130.
FAO FOOD AND NUTRITION PAPER 77.
2003. Report of a Technical
Workshop, Rome, In Food energy methods of analysis and conversion
factors.
Food and Agriculture organization Of United
Nations,
Rome,
Italy,
1995.
Dimensions of need, An atlas of food
and agriculture.
Gunaratna, N. S., Moges, D., Groote, H. D.
2019. Biofortified maize can improve
quality protein intakes among young
children
in
Southern
Ethiopia.
Nutrients,
11(1):
192.
doi:
10.3390/nu11010192.
Gzazia, J. D., Tittonell, P.A., Germinara, D.,
2152
Int.J.Curr.Microbiol.App.Sci (2019) 8(9): 2142-2154
Chiesa, A. 2003. Phosphorus and
nitrogen fertilization in sweet corn
(Zea mays L. saccharata). Spanish J.
Agric. Res., 1(2): 103-107.
Jackson, M. L. 1973. Soil Chemical Analysis,
Prentice Hall of India Private Limited,
New Delhi, pp.498.
Karki, T. B., Kumar, A., Gautam, R. C. 2005.
Influence of integrated nutrient
management on growth, yield, content
and uptake of nutrients and soil
fertility status in maize (Zea mays L.).
Indian J. Agric. Sci., 75(10): 682-685.
Khan, H. Z., Malik, M. A., Saleem, M. F.
2008. Effect of rate and source of
organic material on the production
potential of spring maize (Zea mays
L.). Pakistan J.Agric. Sci., 45(1): 4043.
Kizilkaya, R. 2008. Yield response and
nitrogen concentration of spring wheat
inoculated with
Azotobacter chroococcum strains. Ecol. Engg.,
33: 150-156.
Kumar, A., Rajgopal, D. S., Kumar, L. 2008.
Effect of vermicompost, poultry
manure and azotobactor inoculation on
growth, yield and nutrient uptake of
sweet corn. Indian J. Agron., 34(4):
342- 347.
Kumari, M., Singh, O.P., Meena, D. C. 2017.
Crop Water Requirement, Water
Productivity
and
Comparative
Advantage of Crop Production in
Different Regions of Uttar Pradesh,
India, International Journal of Current
Microbiology and Applied Sciences,
ISSN: 2319-7706, 6 (7) 2043-2052.
/>.603.242.
Lal, B., Singh, D. 1998. Crop yield and uptake
of potassium by maize, wheat and
cowpea fodder in relation to various
potassium forms in soil under intensive
cropping and continuous fertilizer use.
Indian J. Agric. Sci., 68(1): 754-755.
Mohsin, A. U., Ahmad, A. U. H., Farooq, M.,
Ullah, S. 2014. Influence of zinc
application through seed treatment and
foliar spray on growth, productivity
and grain quality of hybrid maize.
Journal of Animal and Plant Sciences,
24(5): 1494-1503
Mukherjee, A., Wang, S. Y. S., Promchote, P.
2019. Examination of the climate
factors that reduced wheat yield in
Northwest India during the 2000s.
Water,
11(2):
343.
/>Murdia, L. K., Wadhwani, R., Wadhawan, N.,
Bajpai, P., Shekhawat, S. 2016. Maize
Utilization in India: An Overview.
American Journal of Food and
Nutrition,
4(6)
169-176.
/>©Science
and
Education
Publishing.doi:10.12691/ajfn-465,2016.
Prasanna, B. M., Vasal, S. K., Kassahun, B.,
Singh, N. N. 2001. Quality protein
maize. Current Science, 81(10): 13081319.
Rajasingh, R. S., Lourduraj, A. C. 2014.
Effect
of
integrated
nutrient
management on yield attributes and
yield of maize hybrid. International
Journal of Agricultural Sciences.
10(2): 761-765
Ram, P., Solanki, N. S., Singh, D., Dadheech,
R. C. 2009. Growth, yield and
economics of quality protein maize
(Zea mays L.) as influenced by fertility
levels and foliar spray of thiourea.
Haryana Journal of Agronomy,
25(1/2): 73-75.
Savalgi, V. P., Savalgi, V. 1992. Effects of
Azospirillum brasilense and earth
warm cast as seed treatment on
sorghum. J. Maharashtra Agric. Univ.,
16: 107-108.
Sheoran, O.P., Tonk, D.S., Kaushik, L.S.,
Hasija, R.C., Pannu, R. S. 1998.
2153
Int.J.Curr.Microbiol.App.Sci (2019) 8(9): 2142-2154
Statistical Software Package for
Agricultural Research.
Shinde,P. D., Jadhav, A. S., Shaikh, A. A.
2011. Effect of integrated nutrient
management and row spacings on
growth and yield of composite maize
(Zea mays L.). Journal of Maharashtra
Agricultural Universities, 36(1): 134137.
Suke, S. N., Deotale, R. D., Hiradeve, P.,
Deogirkar, M., Sorte, N. V. 2010.
Effect of nutrients and biofertilizer on
yield and yield contributing parameters
of maize (Zea mays L.). J. Soils and
Crops, 20 (2): 278-283.
Watson, D.J. 1947. Comparative physiological
studies in the growth of field crops. I.
Variation in net assimilation rate and
leaf area between species and varieties,
and within and between years. Annals
of Botany, 11: 41–76.
Zhang, Y., Li, T., Wu, H., Bei, S., Zhang, J.,
Li, X. 2019. Effect of different
fertilization practices on soil microbial
community in a wheat–maize rotation
System. Sustainability, 11, 4088,
doi:10.3390/su11154088.
How to cite this article:
Ananya Chakraborty, Sritama Biswas, Rajarshi Banerjee, Pintoo Bandopadhyay and Srijani
Maji 2019. Differential Response of QPM, Hybrid and Composite Maize Cultivars to INM
Schedules. Int.J.Curr.Microbiol.App.Sci. 8(09): 2142-2154.
doi: />
2154