Variability and frequency distribution studies in F2 segregating population of rice with phosphorous starvation tolerance gene (OsPSTOL 1) introgressed
Bạn đang xem bản rút gọn của tài liệu. Xem và tải ngay bản đầy đủ của tài liệu tại đây (624.52 KB, 9 trang )
Int.J.Curr.Microbiol.App.Sci (2019) 8(9): 2620- 2628
International Journal of Current Microbiology and Applied Sciences
ISSN: 2319-7706 Volume 8 Number 09 (2019)
Journal homepage:
Original Research Article
/>
Variability and Frequency Distribution Studies in F2
Segregating Population of Rice with Phosphorous Starvation
Tolerance Gene (OsPSTOL 1) Introgressed
V. Nirubana1, C. Vanniarajan1*, N. Aananthi2, S. Banumathy1,
S. Thiyageshwari3 and J. Ramalingam4
1
Department of Plant Breeding and Genetics, Agricultural College and Research Institute,
Madurai, Tamil Nadu, India
2
Department of Plant Breeding and Genetics, Agricultural College and Research Institute,
Killikulam, Tamil Nadu, India
3
Department of Soil Science and Agricultural Chemistry, Tamil Nadu Agricultural University,
Coimbatore, Tamil Nadu, India
4
Department of Biotechnology, Agricultural College and Research Institute,
Madurai, Tamil Nadu, India
*Corresponding author
ABSTRACT
Keywords
Rice, F2, variability,
phosphorous
content, grain yield
Article Info
Accepted:
24 August 2019
Available Online:
10 September 2019
The F2 segregating generation of two crosses viz., Anna (R) 4 x IR 64 Pup
1 and Anna (R) 4 x Samba mahsuri Pup 1 were evaluated for variability
parameters and frequency distribution. The results revealed that both the
crosses exhibited high PCV and GCV for the traits viz., number of tillers
per plant, number of productive tillers per plant, number of filled grains per
panicle, shoot P content and single plant yield. The traits viz., plant height,
number of tillers per plant, number of productive tillers per plant, number
of filled grains per panicle, hundred grain weight, shoot P content, grain P
content and single plant yield showed high heritability coupled with high
genetic advance as per cent of mean indicating the presence of additive
gene effect and selection for these traits may be effective. The trait panicle
length and grain P content had negative skewness and selection may be
effected to evolve high yielding phosphorous deficient tolerant variety in
rice.
2620
Int.J.Curr.Microbiol.App.Sci (2019) 8(9): 2620- 2628
Introduction
Materials and Methods
Rice is one of the most important stable food
for more than half of the world’s population
and an important model for cereal crops. Rice
production is seriously threatened by various
factors out of which nutrient deficiencies are
critical in many parts of the world
(Dobermann
and
Fairhurst,
2000).
Phosphorous (P) is one of the important key
nutrients required for plant growth and
development.
The study was carried out at Agricultural
College and Research Institute, Madurai
during Kharif 2018 in two F2 population of
rice viz., Anna (R) 4 x IR 64 Pup 1 (Cross 1)
and Anna (R) 4 x Samba mahsuri Pup 1
(Cross 2). Anna (R) 4 is a drought tolerant
variety but susceptible to phosphorous
starvation tolerance. IR 64 Pup 1 and Samba
mahsuri Pup 1 are the lines tolerant to
phosphorous deficiency carrying OsPSTOL1
gene. Recommended agronomic practices
were followed to raise the crop. Observations
were recorded in all the individual F2
segregants for days to first flowering (days),
plant height (cm), number of tillers per plant,
number of productive tillers per plant, panicle
length (cm), number of filled grains per
panicle, hundred grain weight (g), shoot
phosphorous
content
(mg/g),
grain
phosphorous content (mg/g) and single plant
yield (g). Phosphorous content in shoot and
grains
were
estimated
using
the
Vanadomolybdate yellow colour method using
spectrophotometer (Piper, 1966). Statistical
method suggested by Burton (1952) for
variability, Lush (1940) for heritability,
Johnson et al., (1955) for genetic advance as
percent of mean (GAM) were adopted.
Skewness, the third degree statistics and
kurtosis, the fourth degree statistics were
estimated by adopting the procedure given by
Kapur (1981) to understand the nature of
distribution of quantitative traits in F2
segregating population.
It is most problematic macronutrient in rice
farming because it forms complexes with Fe3+
under submerged conditions and Al3+ ions
under dry conditions present in the soils and
becoming limitedly available to the plants
(Shen et al., 2011). Phosphorous deficiency
constitutes a major intricacy and leads to
reduced tillering, rate of assimilate production
per leaf area and rate of leaf expansion (Radin
and Eidenbock, 1984). Application of
fertilizers may solve the problem but it is very
expensive and can cause environmental and
health
problems
and
therefore,
the
development of phosphorous deficient tolerant
cultivars is one of the most effective and ecofriendly solutions. Crop improvement for
particular trait has been achieved through
effective use of segregating population and
fixing desirable combinations (Khandappagol
et al., 2019).
Estimates of genetic variability parameters for
yield and related traits provide immense value
in the selection of superior segregants.
Information on skewness and kurtosis reflects
the nature of variability existing in a genetic
population. Therefore, the investigation was
undertaken to assess the variability and pattern
of frequency distribution for yield and its
component traits of phosphorous deficiency
tolerance in the two crosses involving two
tolerance and one susceptible parents for
phosphorous starvation.
Results and Discussion
The mean, range, variability parameters and
frequency distribution for various characters
in two crosses are presented in Table 1 and 2.
The results indicated that the estimates of
phenotypic coefficient of variation (PCV)
were higher than the genotypic coefficient of
variation (GCV) for all the traits studied in
2621
Int.J.Curr.Microbiol.App.Sci (2019) 8(9): 2620- 2628
both the crosses indicating the magnitude of
environmental influence. Number of tillers per
plant, number of productive tillers per plant,
number of filled grains per panicle, shoot P
content and single plant yield showed high
PCV and GCV in both the crosses which were
in accordance with Sheshaiah et al., (2018) for
number of tillers per plant, number of
productive tillers per plant and single plant
yield; Nezam Ali et al., (2018) for number of
filled grains per panicle and single plant yield
and Abhilash et al., (2018) for number of
productive tillers per plant and single plant
yield. Low estimates of PCV and GCV were
recorded by days to first flowering in both the
crosses and plant height and panicle length in
cross 2. Similar finding was also observed by
Balat et al., (2018) for plant height and
Lingaiah et al., (2018) for panicle length. The
trait hundred grain weight showed moderate
PCV and GCV in both the crosses and grain P
content in cross 2. These results were in
parallel with the findings of Mohana
Sundaram et al., (2019) for 100 grain weight.
Plant height, panicle length and grain P
content had moderate PCV and low GCV in
cross 1. Similar results were observed by
Nezam Ali et al., (2018) and Khandappagol et
al., (2019) for panicle length. Selection based
on these characters with high PCV and GCV
will be effective for improvement of these
traits.
High heritability and genetic advance as per
cent of mean (GAM) was observed for all the
traits in both crosses except days to first
flowering, panicle length and grain P content
in cross 1 and days to first flowering and
panicle length in cross 2 exhibited high
heritability with moderate GAM.
The present findings were in agreement with
the finding of Khandappagol et al., (2019) for
plant height, number of productive tillers per
plant, filled grains per panicle, grain yield per
plant, days to first flowering and panicle
length and Mohana Sundaram et al., (2019)
for number of productive tillers per plant and
hundred grain weight. High heritability and
genetic advance as per cent of mean indicated
that prevalence of additive gene action in their
inheritance. Hence early generation selection
may be effective to improve these traits due to
the presence of additive gene action.
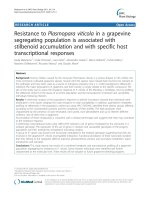
Significant and positive skewness was
observed for days to first flowering, number of
tillers per plant, number of productive tillers
per plant, number of filled grains per panicle,
shoot P content and single plant yield in both
the crosses. Traits observed with positive
skewness indicate that more proportion of
individuals present in low end of distribution.
Days to first flowering and shoot P content
were positively skewed, which implies that
more number of early flowering and low shoot
P segregants were obtained from both the
crosses and selection can be done for earliness
and low shoot phosphorous content.
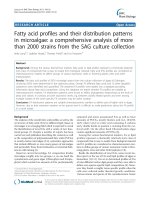
Plant height, panicle length and grain P
content had significant and negative skewness
in cross 1 and only grain P content in cross 2
indicating that more proportion of segregants
with higher panicle length in Anna (R) 4 × IR
64 Pup 1 cross and grain P content in both the
crosses. Isolation superior segregants with low
shoot and high grain P content with high yield
could be useful for developing phosphorous
deficient tolerant genotypes. Frequency
distributions of various traits for two crosess
were represented in Figure 1 and 2. Regarding
kurtosis, even though significant leptokurtic
nature of distribution was observed for plant
height, panicle length, number of filled grains
per panicle, hundred grain weight, shoot P
content, grain P content and single plant yield
in cross 1 and number of tillers per plant,
number of productive tillers per plant, number
of filled grains per panicle and hundred grain
weight in cross 2, wide range of distribution
was recorded for these traits.
2622
Int.J.Curr.Microbiol.App.Sci (2019) 8(9): 2620- 2628
Table.1 Variability parameters for different characters in F2 population of Anna (R) 4 x IR 64 Pup1
GCV
(%)
h2
(%)
GAM
%
Skewness Kurtosis
Max
116.00 4.99
4.92
97.20
10.53
0.64**
0.72
48.00
97.40
10.15
9.94
95.74
21.10
-0.61**
1.48**
22.83 14.22
3.00
32.00
37.92
35.93
89.82
73.90
0.56**
0.46
19.17 8.20
2.00
21.00
45.83
44.13
92.71
92.21
0.65**
0.27
23.06 22.80
13.10
29.20
10.80
9.15
71.69
16.80
-0.38**
1.01**
Number of filled grains 113.06 88.08 86.98
per panicle
30.00
199.00 32.30
32.13
98.97
69.36
0.93**
1.55**
Hundred grain weight 2.33
(g)
1.20
3.20
11.94
10.98
84.60
21.92
-0.14
2.45**
Character
Mean
Range
Days to first flowering
P1
81.13
P2
F2
95.33 98.01
Min
89.00
Plant height (cm)
93.88
93.26 80.18
Number of tillers per 17.19
plant
Number of productive 14.75
tillers per plant
25.42
Panicle length (cm)
2.39
2.35
PCV
(%)
Shoot P content (mg/g)
0.115
0.189 0.100
0.047
0.189
27.30
26.12
91.58
54.25
1.01**
1.39**
Grain P content (mg/g)
0.312
0.330 0.302
0.209
0.348
10.31
8.45
67.10
15.01
-1.11**
0.96*
Single plant yield (g)
26.02
22.62 12.36
5.10
34.40
44.08
43.23
96.17
92.00
1.41**
2.44**
*, ** significant at 5 % and 1 % levels, respectively
P1=Anna (R) 4; P2= IR 64 Pup 1; Min = Minimum; Max = Maximum; PCV = Phenotypic coefficient of variation; GCV = Genotypic coefficient of variation; h 2 =
Heritability (%); GAM = Genetic advance as per cent of mean.
2623
Int.J.Curr.Microbiol.App.Sci (2019) 8(9): 2620- 2628
Table.2 Variability parameters for different characters in F2 population of Anna (R) 4 x Samba mahsuri Pup1
Character
Mean
Range
PCV
(%)
GCV
(%)
h2 (%)
GAM
%
Skewness
Kurtosis
P1
P2
F2
Min
Max
Days to first flowering
81.13
105.53
97.22
85.00
118.00
6.65
6.49
95.17
13.73
0.64**
0.10
Plant height (cm)
93.88
79.25
78.52
55.90
96.00
9.75
9.58
96.62
20.43
-0.29
0.07
Number of tillers per plant
17.19
13.73
13.91
2.00
30.00
35.51
33.32
88.05
67.86
0.70**
0.81*
Number of productive tillers
per plant
14.75
11.53
9.42
1.00
29.00
47.31
45.23
91.41
93.83
0.91**
1.42**
Panicle length (cm)
25.42
22.55
22.90
17.30
28.70
9.82
8.28
71.03
15.14
0.30
-0.07
Number of filled grains per
panicle
113.06
176.47
108.34
43.00
249.00
36.58
36.45
99.30
78.82
0.86**
0.78*
Hundred grain weight (g)
2.33
1.36
1.83
1.20
3.00
13.41
12.25
83.39
24.27
0.30
2.73**
Shoot P content (mg/g)
0.115
0.141
0.085
0.041
0.181
39.62
37.95
91.75
78.89
1.18**
0.63
Grain P content (mg/g)
0.312
0.340
0.249
0.125
0.309
17.30
15.76
82.99
31.15
-1.08**
0.51
Single plant yield (g)
26.02
20.93
14.57
5.50
38.90
50.63
50.27
98.57
108.30
1.07**
0.62
*, ** significant at 5 % and 1 % levels, respectively
P1=Anna (R) 4; P2= Samba mahsuri Pup 1; Min = Minimum; Max = Maximum; PCV = Phenotypic coefficient of variation; GCV = Genotypic coefficient of
variation; h2 = Heritability (%); GAM = Genetic advance as per cent of mean.
2624
Int.J.Curr.Microbiol.App.Sci (2019) 8(9): 2620- 2628
Fig.1 Frequency distributions for biometrical traits in F2 population of cross Anna (R) 4 x IR 64 Pup 1
2625
Int.J.Curr.Microbiol.App.Sci (2019) 8(9): 2620- 2628
Fig.2 Frequency distributions for biometrical traits in F2 population of cross Anna (R) 4 x Samba mahsuri Pup 1
2626
Int.J.Curr.Microbiol.App.Sci (2019) 8(9): 2620- 2628
The study revealed high heritability coupled
with high genetic advance as per cent of mean
recorded for plant height, number of tillers per
plant, number of productive tillers per plant,
number of filled grains per panicle, hundred
grain weight, shoot P content, grain P content
and single plant yield in F2 populations.
Considering the skewness, the trait panicle
length and grain P content had negative
skewness in Anna (R) 4 × IR 64 Pup 1 cross
and grain P content in Anna (R) 4 × Samba
mahsuri Pup 1 cross indicated that the
individuals are clustered towards higher mean
values.
The characters days to first flowering and
shoot P content in both the crosses recorded
positive skewness which indicated that the
individuals are clustered towards lower mean
values. Therefore, these traits should be taken
into account while selecting superior and
desirable plants that would offer scope for
developing high yielding and P deficient
tolerance in rice breeding programme.
References
Abhilash, R., T. Thirumurugan, D. Sassikumar
and Chitra, S. 2018. Genetic studies in
F2 for biometrical traits in rice (Oryza
sativa L.). Electronic Journal of Plant
Breeding. 9(3): 1067 – 1076.
Balat, J.R., V.P. Patil., M.L. Visat and
Bhagora, R.N. 2018. International
Journal of Pure and Applied
Bioscience. 6(1): 1021-1027.
Burton, G.W. 1952. Quantitative inheritance
in grasses. Proc. 6th Int. Grassland
Cong., 1: 277 - 283.
Dobermann, A. and Fairhurst, T.H. 2000.
Rice: Nutrient Disorders and Nutrient
Management.
International
Rice
Research Institute, Philippines.
Johnson, H.W., H.F. Robinson and Comstock,
R.E. 1955. Estimation of genetic
variability
and
environmental
variability in soybean. Agronomy
Journal. 47: 314-318.
Kapur, S. K. 1981. Elements of practical
statistics. Oxford and IBH Publishing
Co, New Delhi, pp, 148-154.
Khandappagol, M., M.P. Rajanna and Savita,
S.K. 2019. Variability and frequency
distribution studies in F2 population of
two crosses involving traditional
varieties of rice (Oryza sativa L.).
Journal of Pharmacognosy and
Phytochemistry. 8(1): 1630-1634.
Lingaiah N., N. Sarla, K. Radhika, V.
Venkanna, D. Vishnu Vardhan Reddy
and Surender Raju. 2018. International
Journal of Agriculture Sciences. 10(9):
5956-5957.
Lush, J.L. 1940. Intra-sire correlation and
regression of offspring on dams as a
method of estimating heritability of
characters. In: Proc. of “American
Society of Animal Production” 33:
293-301.
Mohana Sundaram, K., S. Rajeswari, R.
Saraswathi and Jayaprakash, P. 2019.
Genetic variability studies for yield
and its components and quality traits
with high iron and zinc content in
segregating population of rice (Oryza
sativa L.). International Journal of
Chemical Studies. 7(3): 800-805.
Nezam Ali, E., S. Rajeswari, R. Saraswathi
and Jeyaprakash, P. 2018. Genetic
variability and character association
for earlines, yield and its contributing
traits in F2 population of rice (Oryza
sativa L.). Electronic Journal of Plant
Breeding. 9(3): 1163-1169.
Piper, C. S. 1966. Soil and Plant Analysis.
Hans publisher, Bombay
Radin, J.W. and Eidenbock, M.P. 1984.
Hydraulic conductance as a factor
limiting leaf expansion of phosphorusdeficient
cotton
plants.
Plant
Physiology. 75: 372-377.
2627
Int.J.Curr.Microbiol.App.Sci (2019) 8(9): 2620- 2628
Shen, J., L.Yuan, J. Zhang, H. Li, Z. Bai, X.
Chen, W. Zhang and Zhang, F. 2011.
Phosphorus dynamics: from soil to
plant. Plant Physiology. 156: 9971005.
Sheshaiah, B.M., Dushyantha Kumar, S.
Gangaprasad, T.H. Gowda, G.N.
Hosagoudar and Shashidhar, H.E.
2018. Studies on Variability and
Frequency Distribution of Yield and
Yield Related Traits in F2 Population
of Rice (Oryza sativa L.). International
Journal of Current Microbiology and
Applied Biosciences. 7(9): 2048-2052.
How to cite this article:
Nirubana, V., C. Vanniarajan, N. Aananthi, S. Banumathy, S. Thiyageshwari and Ramalingam,
J. 2019. Variability and Frequency Distribution Studies in F2 Segregating Population of Rice
with
Phosphorous
Starvation
Tolerance
Gene
(OsPSTOL
1)
Introgressed.
Int.J.Curr.Microbiol.App.Sci. 8(09): 2620- 2628.doi: />
2628