Performance of hybrid rice cultivar (Oryza sativa L.) on growth and yield attributes under agro-climatic conditions of Allahabad Uttar pradesh in Aman season of planting
Bạn đang xem bản rút gọn của tài liệu. Xem và tải ngay bản đầy đủ của tài liệu tại đây (407.78 KB, 13 trang )
Int.J.Curr.Microbiol.App.Sci (2019) 8(9): 2970-2982
International Journal of Current Microbiology and Applied Sciences
ISSN: 2319-7706 Volume 8 Number 09 (2019)
Journal homepage:
Original Research Article
/>
Performance of Hybrid Rice Cultivar (Oryza sativa L.) on Growth and Yield
Attributes under Agro-Climatic Conditions of Allahabad Uttar Pradesh in
Aman Season of Planting
Vikram Singh, Rachana, Prasad Mithare*, Sujit Kumar, J. P. Mishra,
Sachchida Nand Singh, Dhananjay Tiwari and Lalit Kumar Sanodiya
Department of Agronomy, Allahabad School of Agriculture, Sam Higginbottom University of
Agriculture Technology & Sciences, Allahabad- 211007, (Uttar Pradesh), India
*Corresponding author
ABSTRACT
Keywords
CGR, Days after
Transplanting
(DAT), Green
Revolution, Panicle
Initiation and RGR.
Article Info
Accepted:
25 August 2019
Available Online:
10 September 2019
The field experiment was conducted during Kharif season of 2016 at Crop
Research Farm SHUATS, Allahabad (UP). The experiment was carried out to
find the performance of 40 hybrids, which laid out in Randomized Block
Design (RBD) & replicated thrice. The experiment finding revealed that the
treatment T38 (KR 38) has performed significantly better than all other hybrids
viz; Germination (96%), Plant height (115.14 cm), Number of tillers per m2
(381.00), Panicle length (30.70 cm), Number of filled grains plant–1 (307.66),
Number of un-filled grains plant–1 (22.56),Test weight (29.89 g), Grain yield
plant-1 (0.041 kg), Grain yield (13.96 t ha-1), Straw yield (19.98 t ha–1),
Biological Yield (33.94 t ha–1). While the same treatment T38 (KR 38) recorded
highest gross return, net return and B: C ratio However treatment T35 (KR 35),
T25 (KR 25), T36 (KR 36) and T16 (KR 16) were statistically at par with
treatment T38 (KR 38) respectively.
Introduction
Cereals are the member of grasses, which
belong to family Gramineae (Poaceae) and
cultivated for edible components of their grain
which is composed of the endosperm, germ
and bran. Rice Oryza sativa L. (2n=24)
belongs to the family Gramineae (Poaceae).
The genus Oryza contains 24 recognized
species, of which 22 are wild species and two
cultivated (O. sativa and O. glaberrima). Rice
is one of the three most important cereal food
grain crop of the world and forms the staple
diet of 2.7 billion people. Except Antarctica, it
is grown in all the continents, occupying 159
million hectare area and producing 683
million tonnes FAO, 2011. India’s share in the
world rice production is 21.6%. India holds
second and China holds the first position in
rice production in the world FAO, 2011. Our
2970
Int.J.Curr.Microbiol.App.Sci (2019) 8(9): 2970-2982
rice requirement by the year 2020 is estimated
to be around 122 million tons as against the
present production of about 100 million tons,
thus leaving a gap of about 22 million tons
rice. Present production level needs to be
increased up to 140 million tons by 2025
which can be achieved only by increasing the
rice production by over 2 million tons per year
incoming decade Anonymous 2005. The rice
accounts for about 43% of total food grain
production and 46% of total cereal production
in the country Anonymous 2006. Rice is the
only crop which providing major source of the
food energy for more than half of the human
population. More than 90 per cent of the
world’s rice is produced and consumed in
Asia, where it is an integral part of culture and
tradition. Rice occupies a pivotal place in
Indian agriculture and it is contributes to 15
per cent of annual GDP and provides 43 per
cent calorie requirement for more than 70 per
cent of Indians. Around 65% of the total
population in India depends on rice and it
accounts for 40% of their food production
Anonymous 2005. India has 365.69 lakh
hectare area is under rice cultivation in kharif
2019. Highest area under rice cultivation is
reported from the state of Madhya Pradesh
(3.50 lakh ha-1) followed by Telangana (3.49
lakh ha-1), while lowest area under rice
cultivation was reported in Uttarakhand (0.01
lakh ha-1). The second estimate rice
production (115.60) million tonnes in the year
2018-19 GOI 2019. Whereas highest average
productivity of rice was 2550 kg ha-1 during
2016-17 respectively GOI 2017. Rice is the
staple food for 50–60 % of the global
population and its demand continues to grow
Carriger and Vallee 2007, Mohanty et al.,
2013 and Stoop et al., 2009. Rice is rich
source of carbohydrates (calories) which
contain less protein compared to wheat. The
protein content of milled rice is usually (67%). However, rice contains favorable amino
acid which is higher as compared with other
cereals in amino acids content. The biological
value of its protein is high and fat content of
rice is low (2.0 to 2.5 %) and much of the fat
is lost during milling. It is estimated that 5000
liters of water is needed to produce 1 kg of
Rice Bouman et al., 2009. Rice production
and productivity was significantly enhanced
with the introduction and cultivation of semidwarf, fertilizer responsive and non-lodging
high yielding varieties in the early seventies
leading to the “Green Revolution”. Hybrid
rice technology has provided farmers with
high yields, saved land for agricultural
diversification and created rural employment
opportunities. The demand of quality hybrid
rice seeds is increasing day by day. This can
be achieved only through identification of
high yielding rice hybrids and participatory
programme of researchers, farmers, NGO’s,
seed growers and farmers should be involved
in it for increased production and productivity
of hybrid rice.
Materials and Methods
A field experiment was conducted during
kharif season of 2016 at the Crop Research
farm, Department of Agronomy, Allahabad
School of Agricultural, Sam Higginbottom
University of Agriculture Technology and
Sciences, Allahabad. The experiment site lies
between 25-27° N latitude, 8.5°E Longitude
and 98 meters altitude. The climate is
characterized by the alternate hot rainy season
from late June to early September with mean
temperature of 38°C. The soil was sandy loam
in texture having a pH (7.2), EC (0.14 dSm-1),
organic carbon (0.38%), available N (225 kg
ha–1), P (19.5 kg ha–1), K (340 kg ha–1), S
(16.8.00 ppm), and Zn (0.51 ppm) during the
experimental year. The experiment was laid
down in randomized block design (RBD) with
40 treatments and 3 replications. Twenty five
days old seedlings were transplanted to main
field conventionally at a spacing of 20 x 10
cm. The crop was fertilized with
recommended dose of NPK 160:80:60 kg ha–1
2971
Int.J.Curr.Microbiol.App.Sci (2019) 8(9): 2970-2982
was applied. The (100%) full dose phosphorus
and potassium whereas (50%) of Nitrogen was
applied at the time of planting as basal dose
and the remaining Nitrogen was applied in
two equal split doses as top dressing at active
(Tillering & Panicle Initiation stage)
respectively. Similarly ZnSo4 was applied as
basal dose at the rate of 25 kg ha-1 for
correction of zinc and sulphur deficiency.
Irrigation was scheduled at 10-12 days interval
as flooding; however other normal cultural
practices were followed timely as; weeding at
30 DAT & 45 DAT. One quadrate (1 m2) was
harvested in every plot for the determination
of results and data was subjected to statistical
analysis separately by using analysis of
variance technique. The difference among
treatment means was compared by using least
significant difference test at 5% probability
levels. The treatment consisted of Hybrids T1:
(KR 01), T2: (KR 02), T3: (KR 03), T4: (KR
04), T5: (KR 05), T6: (KR 06), T7: (KR 07),
T8: (KR 08), T9: (KR 09), T10: (KR 10), T11:
(KR 11), T12: (KR 12), T13: (KR 13), T14: (KR
14), T15: (KR 15), T16: (KR 16), T17: (KR 17),
T18: (KR 18), T19: (KR 19), T20: (KR 20), T21:
(KR 21), T22: (KR 22), T23: (KR 23), T24: (KR
24), T25: (KR 25), T26: (KR 26), T27: (KR 27),
T28: (KR 28), T29: (KR 29), T30: (KR 30), T31:
(KR 31), T32: (KR 32), T33: (KR 33), T34: (KR
34), T35: (KR 35), T36: (KR 36), T37: (KR 37),
T38: (KR 38), T39: (KR 39), T40: (KR 40).
germination percentage (64%) was recorded in
treatment T26 (KR-26) as shown in (Table 1
and Fig 1) respectively.
Plant height (cm)
Plant height is not a yield component
especially in grain crops but it indicates the
influence of various essential plant nutrients
on plant metabolism. Significantly maximum
plant height (115.14 cm) was recorded in
treatment T38 (KR 38) followed by (114.08
cm) in treatment T23 (KR-23) and minimum
plant height (88.22 cm) was recorded in
treatment T10 (KR 10) at 80 DAT. However
treatment T8, T21, T37, T20, T30 and T26 were
statistically at par with treatment T38 (KR 38)
as shown in (Table 1 and Fig 1) respectively.
The increased plant height might be due to
genetic makeup like genetic character and
genetic disparity of the cultivar. This may be
due to first generation hybrid vigor of the
plant compared to other cultivars Paramasivan
et al., 1988. Increase in plant height may also
be due to synchronized availability of all the
essential plants nutrients to the crop especially
nitrogen for a longer period during its growth
stages Deshpande & Devasenpathy 2011 and
Haque et al., 2015. Similar finding are also
confirmed by Parihar et al., 2005, Kalyani et
al., 2012 and Kumar et al., 2015.
Plant dry weight (g)
Results and Discussion
Growth Attributes
Germination (%)
The germination percentage is not a yield
component in field crops but it indicates the
influence of various enzymatic changes in the
seed and its embryo. Germination percentage
in laboratory was done with various hybrids,
the highest germination percentage (96%) was
recorded in T38 (KR-38) and lowest
The observations regarding plant dry weight
were recorded at different intervals 20, 40, 60
and 80 DAT was found non-significant
difference among the treatments. However
maximum plant dry weight (41.87 g) was
observed in treatment T38 (KR 38) and
minimum plant dry weight (31.60 g) was
recorded in treatment T10 (KR 10) at 80 DAT.
The increase in plant dry weight (g) in various
hybrids might be due to more assimilatory
surface leading to higher dry matter
production
coupled
with
effective
2972
Int.J.Curr.Microbiol.App.Sci (2019) 8(9): 2970-2982
translocation
and
distribution
of
photosynthates from source to sink. Dry
matter accumulation depends upon the
photosynthesis and respiration rate during
vegetative growth; hybrid rice accumulates
more dry matter in the early and middle
growth stages which results in more spikelets
per panicle. The hybrids variety (KR 38) has
bigger panicles and more spikelet’s panicle-1.
These factors result in higher yields usually 15
% or more than ordinary rice Philrice et al.,
2002. Similar findings are also confirmed by
Singh and Khan 2003.
-2
-1
Crop Growth Rate (g m day ) and
Relative Growth Rate (g g-1 day-1)
-2
-1
Crop growth rate (g m day ) of hybrid rice
was recorded at different intervals 0-20, 2040, 40-60 and 60-80 DAT was found nonsignificant difference among the treatments.
Similarly Relative growth rate (g g-1 day-1) of
hybrid rice was recorded at different intervals
20-40, 40-60 and 60-80 DAT was found nonsignificant difference among the treatments.
However maximum CGR (55.82) and RGR
(0.065) were recorded in treatment T38 (KR
38) at 40-60 DAT, while minimum CGR
(35.47) and RGR (0.034) was recorded in
treatment T10 (KR 10) respectively. The
percentage decrease in CGR and RGR in
various hybrids and showing non-significant
difference among the treatment is due to
prevalence of low temperature coupled with
less humidity at the growth and reproductive
stage especially during flag leaf stage. Similar
findings are also reported by Yadav et al.,
2004.
Number of Tillers per m2
No. of tillers per m2 is technically a growth
parameter but scientifically it play an major
role yield component especially in cereal
crops but it indicates the influence of various
essential plant nutrients on plant physiology
and metabolism involved in the plant.
Significantly higher No. of tillers per m2
(381.00) was recorded in treatment T38 (KR
38) followed by (380.66) in treatment T2 (KR02), while lowest No. of tillers per m2
(222.90) was recorded in treatment T37 (KR
37). However treatment T40, T30, T9, T14, T36
and T32 were statistically at par with treatment
T38 (KR 38) as shown in (Table 1 and Fig 1)
respectively.
The number of tillers are significantly
influenced by genetic potential of the variety
and also may be due to synchronized
availability of essential plants nutrients to the
crop especially NPK for a longer period
during its growth & reproductive stages.
Increased number of effective tillers hill-1 may
have helped in increasing the photosynthetic
area for photosynthesis in plant. In several rice
cultivars, the effect on number of effective
tillers production at all the growth stages was
significant, the number increased till 77 DAT
followed by a decline to harvest due to death
of some undeveloped tillers, thus tillers
development was found to be more in hybrid
varieties apart from local variety reported by
Akram et al., 2007. Similarly significant
differences could be attributed to the fact that
high yielding hybrids have relatively high
tillering capacity has been reported by Yadav
et al., 2010.
Number of Tillers hill-1
The observations regarding No. of tillers hill-1
was found non-significant difference among
the treatments. However higher No. of tillers
hill-1 (14.33) was observed in treatment T25
(KR 25) and lower No. of tillers hill-1 (8.33)
was recorded in treatment T20 (KR 20) as
shown in (Table 1 and Fig 1) respectively.
Panicle Length (cm)
The longest panicle length (30.70 cm) was
recorded in T38 (KR 38) followed by (30.167
2973
Int.J.Curr.Microbiol.App.Sci (2019) 8(9): 2970-2982
cm) in treatment T14 (KR-14) and shortest
panicle length (24.56 cm) was recorded in
treatment T3 (KR 03). However treatment T19
and T40 are statistically at par with treatment
T38 (KR 38) as shown in (Table 2 and Fig 2)
respectively. The longer panicles obtained in
treatments might be the genetic potential of
the hybrid and also may be due to
synchronized availability of essential plants
nutrients to the crop especially NPK for a
longer period during its growth stages. The
reason also might be due to better nutrients
uptake by the cultivar during panicle growth
period Sharma et al., 2014. Similar findings
are confirmed by Rahman et al., 2013.
(Table 2 and Fig 2) respectively. Probably
heritability is a measure of extent of
phenotypic variation caused by the action of
genes Haque et al., 2015. Prevalence of low
temperature coupled with less humidity at flag
leaf stage which might be reduced in duration
and availability of ample supply of nutrients
especially nitrogen through foliar feeding may
be the reason for the better performance with
regard to number of days to maturity Yadav et
al., 2004.
Days to 50 % Flowering
Highest number of filled grains plant-1
(307.66) was observed in treatment T38 (KR
38) followed by (269.66 and 261.33) in
Treatment T6 (KR 06) and T33 (KR 33). While
lowest number of filled grains plant-1 (189.00)
was observed in Treatment T12 (KR 12) as
shown in (Table 3) and (Fig 3) respectively.
Maximum days to 50 % flowering (87.66
days) was recorded in T18 (KR 18) followed
by (86.33 and 85.66 days in Treatment T9 (KR
09) and T17 (KR 17). While minimum days to
50% flowering (54.33 days) was recorded in
treatment T6 (KR 06) as shown in (Table 2 and
Fig 2) respectively. Crop matures around 30
days of 50% flowering. However, the other
reason might be due to the inherent
characteristic of the cultivar to take minimum
days to 50 % flowering. The heritability is a
measure of extent of phenotypic variation
caused by the action of genes. In this
experimental study, high heritability was
observed for traits viz days to 50% flowering
and days to maturity Haque et al., 2015
respectively.
Yield Attributes
Number of filled grains plant-1
Number of un-filled grains plant-1
Lowest number of un-filled grains plant-1
(22.56) was observed in treatment T38 (KR 38)
followed by (23.33, 23.66, 24.33 and 25.66) in
Treatment T10 (KR 10), T4 (KR 04), T12 (KR
12) and T19 (KR 19). While highest number of
un-filled grains plant-1 (85.66) was observed in
Treatment T16 (KR 16) as shown in (Table 3)
and (Fig 3) respectively.
Grain yield plant-1
Days to Maturity
Maximum days to maturity (116.33 days) was
recorded in T17 (KR 17) followed by (108.67,
108.33 and 107.00 days) in Treatment T15 (KR
15), T18 (KR 18) and T21 (KR 21). While
minimum days to maturity (68.67 days) was
recorded in treatment T13 (KR 13) as shown in
The highest grain yield plant-1 (41g) was
observed in treatment T38 (KR 38) followed
by (40, 36 and 36 g) in Treatment T35 (KR
35), T5 (KR 05) and T29 (KR 29). While
lowest grain yield plant-1 (22 g) was observed
in Treatment T18 (KR 18) as shown in (Table
3) and (Fig 3) respectively.
2974
Int.J.Curr.Microbiol.App.Sci (2019) 8(9): 2970-2982
Table.1 Performance of Hybrid Rice Cultivar (Oryza Sativa L.) on Growth Attributes viz,
Germination (%), Plant height (cm), Number of tiller per m2 and Number of tiller hill-1.
T1
T2
T3
T4
T5
T6
T7
T8
T9
T10
T11
T12
T13
T14
T15
T16
T17
T18
T19
T20
T21
T22
T23
T24
T25
T26
T27
T28
T29
T30
T31
T32
T33
T34
T35
T36
T37
T38
T39
T40
Treatments Details
(Hybrids)
KR-01
KR-02
KR-03
KR-04
KR-05
KR-06
KR-07
KR-08
KR-09
KR-10
KR-11
KR-12
KR-13
KR-14
KR-15
KR-16
KR-17
KR-18
KR-19
KR-20
KR-21
KR-22
KR-23
KR-24
KR-25
KR-26
KR-27
KR-28
KR-29
KR-30
KR-31
KR-32
KR-33
KR-34
KR-35
KR-36
KR-37
KR-38
KR-39
KR-40
F-test
S.Ed (+)
C.D.(P=0.05)
Germination % (in
laboratory)
80
88
92
94
94
94
94
94
80
92
94
94
80
92
93
94
93
80
84
76
93
94
94
92
94
64
95
84
94
80
94
68
Plant height
(cm)
96.40
93.31
103.60
100.37
98.98
99.29
103.89
112.94
91.63
88.22
103.86
101.40
95.51
97.90
98.40
102.33
96.46
97.01
92.06
107.04
110.08
104.38
114.08
102.35
94.49
105.26
100.61
101.96
99.17
107.69
96.80
99.94
No. of tiller per
m2
321.73
380.66
353.25
352.80
353.25
325.33
337.00
293.33
372.00
281.06
285.33
334.33
246.40
369.27
337.66
258.93
367.33
258.66
320.66
289.66
340.66
338.66
277.40
267.80
276.20
306.66
248.26
283.00
248.33
374.40
290.86
360.00
No. of tiller
hill-1
11.067
9.733
9.933
10.867
10.533
9.933
10.667
9.533
9.667
11.000
10.400
10.867
9.133
11.000
9.867
13.467
10.067
10.400
10.533
8.333
10.667
12.667
9.200
14.333
9.467
10.933
9.667
9.800
10.600
10.533
12.200
11.833
94
80
95
94
88
96
68
88
----
103.16
88.97
98.70
97.74
109.27
115.14
92.62
103.41
S
5.37
10.72
316.00
306.53
242.80
362.26
222.90
381.00
273.80
377.60
S
48.01
95.76
11.667
8.733
9.400
9.467
8.533
10.133
10.933
10.267
NS
1.57
--
2975
Int.J.Curr.Microbiol.App.Sci (2019) 8(9): 2970-2982
Table.2 Performance of Hybrid Rice Cultivar (Oryza Sativa L.) on Growth Attributes viz,
Panicle length (cm), Day to 50 (%) flowering and No. of days to maturity
T1
T2
T3
T4
T5
T6
T7
T8
T9
T10
T11
T12
T13
T14
T15
T16
T17
T18
T19
T20
T21
T22
T23
T24
T25
T26
T27
T28
T29
T30
T31
T32
T33
T34
T35
T36
T37
T38
T39
T40
Treatments
Details (Hybrids)
KR-01
KR-02
KR-03
KR-04
KR-05
KR-06
KR-07
KR-08
KR-09
KR-10
KR-11
KR-12
KR-13
KR-14
KR-15
KR-16
KR-17
KR-18
KR-19
KR-20
KR-21
KR-22
KR-23
KR-24
KR-25
KR-26
KR-27
KR-28
KR-29
KR-30
KR-31
KR-32
KR-33
KR-34
KR-35
KR-36
KR-37
KR-38
KR-39
KR-40
F-test
S.Ed (+)
C.D.(P=0.05)
Panicle length
(cm)
27.533
26.333
24.567
26.200
26.567
26.967
25.467
27.333
24.867
27.433
27.533
27.000
27.533
30.167
28.367
28.400
27.667
26.133
29.033
27.033
28.333
26.933
27.400
26.133
24.733
27.900
27.867
25.533
28.000
26.400
26.533
28.200
27.467
24.667
26.600
27.600
26.800
30.700
28.000
28.767
S
1.107
2.285
Day to 50 (%)
flowering
68.00
64.66
67.33
71.33
69.33
54.33
75.00
70.00
86.33
61.00
56.66
58.66
58.66
55.66
76.33
67.33
85.66
87.66
66.33
65.00
78.00
66.66
67.66
68.33
66.00
70.33
60.00
62.00
64.33
67.00
66.66
66.66
69.33
62.66
65.66
70.00
68.00
70.00
67.66
77.00
S
0.52
1.04
2976
No. of days to
maturity
98.00
99.33
98.00
102.0
97.00
101.0
98.66
96.66
104.66
98.66
98.33
103.00
68.67
97.33
108.67
97.67
116.33
108.33
98.67
95.67
107.00
98.00
99.67
102.00
96.33
100.67
98.67
93.00
94.00
96.33
105.67
100.00
97.33
96.33
97.33
102.00
102.33
98.00
101.67
105.33
S
6.91
13.78
Int.J.Curr.Microbiol.App.Sci (2019) 8(9): 2970-2982
Table.3 Performance of Hybrid Rice (Oryza Sativa L.) on Yield Attributes viz, No. of filled
Grains panicle-1, No. of un-filled Grains panicle-1, Grain yield plant-1 (kg) and Grain yield (t ha1
).
T1
T2
T3
T4
T5
T6
T7
T8
T9
T10
T11
T12
T13
T14
T15
T16
T17
T18
T19
T20
T21
T22
T23
T24
T25
T26
T27
T28
T29
T30
T31
T32
T33
T34
T35
T36
T37
T38
T39
T40
Treatments Details
(Hybrids)
KR-01
KR-02
KR-03
KR-04
KR-05
KR-06
KR-07
KR-08
KR-09
KR-10
KR-11
KR-12
KR-13
KR-14
KR-15
KR-16
KR-17
KR-18
KR-19
KR-20
KR-21
KR-22
KR-23
KR-24
KR-25
KR-26
KR-27
KR-28
KR-29
KR-30
KR-31
KR-32
KR-33
KR-34
KR-35
KR-36
KR-37
KR-38
KR-39
KR-40
F-test
S.Ed (+)
C.D.(P=0.05)
No. of filled
Grains plant-1
227.66
200.00
194.66
206.66
208.66
269.66
237.33
194.66
234.66
192.00
260.66
189.00
237.00
199.66
213.00
244.33
219.33
198.66
214.33
208.33
240.33
215.00
199.33
208.66
260.00
221.33
223.66
235.00
258.33
237.66
243.33
193.33
261.33
204.66
252.66
254.33
248.66
307.66
216.66
257.66
S
23.861
47.596
No. of un-filled
Grains plant-1
27.33
47.11
39.66
23.66
50.33
40.00
37.33
37.66
42.66
23.33
31.00
24.33
33.66
45.66
64.66
85.66
31.66
47.33
25.66
51.00
49.66
43.33
35.33
57.30
40.67
37.33
42.00
31.00
34.33
38.33
32.33
37.00
48.33
33.33
40.00
39.33
45.00
22.56
39.33
43.00
S
4.46
8.91
2977
Grain yield
plant-1 (g)
25
26
34
23
36
25
24
24
24
24
26
23
29
27
26
30
24
22
24
27
31
26
35
34
34
34
27
24
36
30
34
25
34
26
40
31
29
41
34
25
S
2.0
5.0
Grain yield
(t ha-1)
10.02
9.130
7.947
7.333
8.180
8.737
9.113
8.503
9.400
6.667
6.397
6.873
10.12
9.293
9.147
10.52
8.360
9.883
9.470
9.440
8.197
9.187
7.890
9.897
11.43
8.850
9.183
7.227
10.82
10.29
10.67
8.177
10.06
10.16
11.96
10.77
9.183
13.96
7.743
9.250
S
1.05
2.09
Int.J.Curr.Microbiol.App.Sci (2019) 8(9): 2970-2982
Table.4 Performance of Hybrid Rice Cultivar (Oryza Sativa L.) on Yield Attributes viz,
Test weight (g) and Grain Type (Shape)
T1
T2
T3
T4
T5
T6
T7
T8
T9
T10
T11
T12
T13
T14
T15
T16
T17
T18
T19
T20
T21
T22
T23
T24
T25
T26
T27
T28
T29
T30
T31
T32
T33
T34
T35
T36
T37
T38
T39
T40
Treatments Details
(Hybrids)
KR-01
KR-02
KR-03
KR-04
KR-05
KR-06
KR-07
KR-08
KR-09
KR-10
KR-11
KR-12
KR-13
KR-14
KR-15
KR-16
KR-17
KR-18
KR-19
KR-20
KR-21
KR-22
KR-23
KR-24
KR-25
KR-26
KR-27
KR-28
KR-29
KR-30
KR-31
KR-32
KR-33
KR-34
KR-35
KR-36
KR-37
KR-38
KR-39
KR-40
F-test
S.Ed (+)
C.D.(P=0.05)
Test weight (g)
Grain type (Shape)
25.35
23.64
25.79
26.12
22.74
22.04
24.14
21.53
23.54
21.36
26.78
21.34
24.47
26.54
24.26
20.24
27.32
23.29
20.46
21.72
29.79
24.23
20.88
23.45
27.42
24.22
22.72
21.03
21.12
23.23
27.64
24.32
27.37
23.32
24.88
22.23
23.83
29.89
21.24
22.12
-
Long Slender
Long Slender
Long Slender
Long Slender
Long Slender
Long Slender
Long Slender
Long Slender
Medium Slender
Medium Slender
Long Slender
Medium Slender
Long Slender
Medium Slender
Medium Slender
Medium Slender
Long Slender
Medium Slender
Long Slender
Long Slender
Medium Slender
Long Slender
Medium Slender
Medium Slender
Long Slender
Long Slender
Long Slender
Medium Slender
Medium Slender
Long Slender
Medium Slender
Long Slender
Long Slender
Long Slender
Long Slender
Long Slender
Long Slender
Long Slender
Medium Slender
Long Slender
----
2978
Int.J.Curr.Microbiol.App.Sci (2019) 8(9): 2970-2982
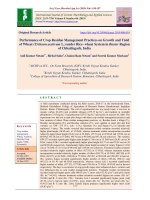
Fig.1Performance of Hybrid Rice Cultivar (Oryza Sativa L.) on Growth Attributes viz, Germination (%), Plant height (cm),
Number of tiller per m2 and Number of tiller hill-1.
450
400
350
Germination % (in
laboratory)
300
250
Plant height (cm)
200
150
No. of tiller per m2
100
No. of tiller per hill
50
0
T1
T3
T5
T7
T9 T11 T13 T15 T17 T19 T21 T23 T25 T27 T29 T31 T33 T35 T37 T39
Fig.2 Performance of Hybrid Rice Cultivar (Oryza Sativa L.) on Growth Attributes viz, Panicle length (cm), Day to 50 (%)
flowering and No. of days to maturity
2979
Int.J.Curr.Microbiol.App.Sci (2019) 8(9): 2970-2982
Fig.3 Performance of Hybrid Rice Cultivar (Oryza Sativa L.) on Yield Attributes viz, No. of filled Grains panicle-1, No. of un-filled
Grains panicle-1, Grain yield plant-1 (kg), Grain yield (t ha-1) and Test weight (g).
2980
Int.J.Curr.Microbiol.App.Sci (2019) 8(9): 2970-2982
Grain yield (t ha-1)
Highest grain yield (13.96 t ha-1) was observed
in treatment T38 (KR 38) followed by (11.96
and 11.43 t ha-1) in Treatment T35 (KR 35) and
T25 (KR 25). While lowest grain (6.39 t ha-1)
was observed in Treatment T11 (KR 11) as
shown in (Table 3) and (Fig 3) respectively.
Test weight (g) and Grain Shape
Highest test weight (29.89 g) and grain shape
(Long Slender) was recorded in treatment T38
(KR 38), while lowest test weight (20.24 g)
and grain shape (Medium Slender) was
recorded in treatment T16 (KR 16) as shown in
(Table 4) and (Fig 3) respectively. The yield
attributes are significantly influenced by
genetic potential of the plant attributed to
higher biomass accumulation coupled with
effective translocation and distribution of
photosynthates from source to sink, which in
turn resulted into elevated stature of yield
attributes, which of course was due to
favourable weather conditions such as rainfall
distribution, evaporation and relative humidity
prevailed during the crop growth period. This
result also may be due to synchronized
availability of essential plants nutrients to the
crop especially NPK for a longer period
during its growth & reproductive stages. In
several hybrid rice cultivars, the effect on
number of effective tillers, longer panicles,
more spikelets panicle-1, number of filled
grains plant-1, number of un-filled grains plant1
, Grain yield plant-1, Grain yield (t ha-1),
Stover yield (t ha-1), Test weight (g) and Grain
Shape was observed significant. Some
findings of the experiment conducted by
researchers concluded that the reason for
better yield attributes was reported by Ranjitha
et al., 2013. According to Gulzar et al., 2012
the grains panicle-1 of had maximum positive
correlation coefficient with grain yield.
According to Neelam et al., 2009 hybrid rice
have longer panicles and more spikelets
panicle-1 and thus in the study had
significantly produced the longest panicle
among the hybrid experiment.
In conclusion, from the data pertaining to the
different treatments, it may be concluded that
by using hybrid KR 38 (KR 38) higher yield
and monetary benefits can be realized over
local cultivars. Hybrid KR 38 (KR 38) was
found to be the best for obtaining highest seed
yield, stover yield, gross return, net return and
benefit cost ratio. Since the findings are based
on the research done in one season it may be
repeated for further confirmation.
Acknowledgements
The author acknowledges the department of
Agronomy, Allahabad School of Agricultural,
Sam Higginbottom University of Agriculture
Technology & Sciences, Allahabad (Uttar
Pradesh) for providing financial support to
carry out the research work.
References
Akram, M., Rehman, A., Ahmad, M. and Cheema,
A. A. (2007). Evaluation of rice (Oryza
sativa L.) hybrids for yield and yield
components in three different environments.
J.Anim. Pl. Sci. 17 :(3-4).
Anonymous (2005). The Hindu Survey of Indian
Agriculture. pp. 41- 46.
Anonymous (2006). The Hindu Survey of Indian
Agriculture. pp. 50-54.
Bouman, B.A.M (2009). How much water does
rice use? Rice Today, 8 (1): 28-29.
Carriger, S. and Vallee, D. (2007). More crop per
drop. Rice Today. 6:10–13.
Deshpande, H.H., and Devasenapathy, P. (2011).
Effect of green manuring and organic
manures on yield, quality and economics of
rice (Oryza sativa L.) under lowland
condition. Karnataka Journal of Agricultural
Sciences 23 (2): 235-238.
FAO (2011). Directorate of economics and
statistics: Ministry of Agriculture.
GOI (2017). Agricultural statistics at a glance:
Ministry of Agriculture, Govt. of India.
2981
Int.J.Curr.Microbiol.App.Sci (2019) 8(9): 2970-2982
GOI (2019). Agricultural statistics at a glance:
Ministry of Agriculture, Govt. of India.
Gulzar, S., Sanghera, Subhash and Kashyap, C.
(2012). Genetic Parameters and Selection
Indices in F3 Progenies of Hill Rice
Genotypes. Not Sci Biol, 4 (4):110-114.
Haque MD., Elora Pervin and MD., Romel
Biswash (2015). Identification of Potential
Hybrid Rice Variety in Bangladesh by
Evaluating the Yield Potential World Journal
of Agricultural Sciences 11(1): 13-18.
Kalyani, D. Lakshmi (2012). Performance of
clusterbean (Cymopsis tetragonoloba L.)
genotypes under varied time of sowing.
Legume Res., 35 (2): 154-158.
Kumar, Manoj, Patel, H.K., Patel, C.N., Umale,
A.A. and Patel, J.J. (2015) Varietal response
of
summer
clusterbean
(Cymopsis
tetragonoloba L.) to different irrigation
scheduling (IW: CPE ratios) under middle
Gujarat conditions, Eco. Env. & Cons: S159S163.
Mohanty, S. (2013). Trends in Global Rice
Consumption. Rice Today. IRRI, pp. 44–45.
Neelam, Sandhyakishore, M.S. Ramesha, T.
Dayakar Reddy and A. Siva Sankar. (2009).
Study of heterosis by utilizing male sterility
restoration system in rice (Oryza sativa L.)
Journal of Rice Research. 2: (2) 93-98.
Paramasivan, K.S. and Rangaswamy, S.R.S.
(1988). Genetic analysis of yield and its
components in rice. Oryza 25: 111-119.
Parihar, C. M., Kaushik, M. K. and Palsaniya, D.
R. (2005). Effect of varieties, plant density
and phosphorus levels on growth and yield of
clusterbean (Cyamopsis tetragonoloba. L.),
Annals of Agril. Res. 26 (1): 5-7.
PhilRice (2002). Hybrid Rice. “Q & A” Series,
PhilRice Maligaya, Muñoz, Nueva Ecija. 1,
4-6.
Rahman M.M., Islam M.T., Faruq A.N., Akhtar
N., Ora N. and Uddin M.M. (2013).
Evaluation of Some Cultivated Hybrid Boro
Rice Varieties against BLB, ShB and ALS
Diseases under Natural Epiphytic Conditions
Middle East Journal of Scientific Research
15 (1): 146-151.
Ranjitha, Sri. R., Kumar, Mahender and Jayasree,
G. (2013). Evaluation of rice (Oryza sativa
L.) varieties and hybrids in relation to
different nutrient management practices for
yield, nutrient uptake and economics in SRI
Annals of Biological Research, 4 (10):25-28.
Sharma, R., Gangwar, R.K., Yadav, V. and
Kumar, R. (2014). Response of Basmati rice
(Oryza sativa) cultivars to graded Nitrogen
levels
under
transplanted
condition.
International Journal of Research in Applied,
Natural and Social Sciences Vol. 2 (9): 3338.
Singh, R. and Khan, M. A. (2003). Response of
clusterbean (Cyamopsis tetragonoloba L.)
varieties to fertility levels and cropping
systems under arid condition. Advances in
arid legume research. 225-228.
Stoop, W.A., Adam, A and Kassam, A., (2009).
Comparing rice production systems: A
challenge for agronomic research and for the
dissemination
of
knowledge-intensive
farming practices. Agricultural Water
Management. 96:1491-1501.
Yadav S K, Suresh B G, Pandey Praveen, Kumar
Binod (2010). Assessment of genetic
variability, correlation and path association in
rice (oryza sativa L.) Journal of bioscience,
18:1-8.
Yadav, Priyanka, Rangare, N. R., John, P. Anurag
and Chaurasia, A. K. (2004). Quantitative
analysis of rice (Oryza sativa L.) in
Allahabad agro climate zone. Journal of Rice
Research 3(1):1-6.
How to cite this article:
Vikram Singh, Rachana, Prasad Mithare, Sujit Kumar, J. P. Mishra, Sachchida Nand Singh,
Dhananjay Tiwari and Lalit Kumar Sanodiya 2019. Performance of Hybrid Rice Cultivar
(Oryza sativa L.) on Growth and Yield Attributes under Agro-Climatic Conditions of
Allahabad Uttar Pradesh in Aman Season of Planting. Int.J.Curr.Microbiol.App.Sci. 8(09):
2970-2982. doi: />
2982