báo cáo khoa học: " Differential gene expression in an elite hybrid rice cultivar (Oryza sativa, L) and its parental lines based on SAGE data" doc
Bạn đang xem bản rút gọn của tài liệu. Xem và tải ngay bản đầy đủ của tài liệu tại đây (1.28 MB, 15 trang )
BioMed Central
Page 1 of 15
(page number not for citation purposes)
BMC Plant Biology
Open Access
Research article
Differential gene expression in an elite hybrid rice cultivar (Oryza
sativa, L) and its parental lines based on SAGE data
Shuhui Song
†1,2
, Hongzhu Qu
†1,2
, Chen Chen
1,2
, Songnian Hu
1
and Jun Yu*
1
Address:
1
Key Laboratory of Genome Science and Information, Beijing Institute of Genomics, Chinese Academy of Sciences, Beijing 101300, China
and
2
Department of Biology, Graduate University of the Chinese Academy of Sciences, Beijing 100094, China
Email: Shuhui Song - ; Hongzhu Qu - ; Chen Chen - ;
Songnian Hu - ; Jun Yu* -
* Corresponding author †Equal contributors
Abstract
Background: It was proposed that differentially-expressed genes, aside from genetic variations
affecting protein processing and functioning, between hybrid and its parents provide essential
candidates for studying heterosis or hybrid vigor. Based our serial analysis of gene expression
(SAGE) data from an elite Chinese super-hybrid rice (LYP9) and its parental cultivars (93-11 and
PA64s) in three major tissue types (leaves, roots and panicles) at different developmental stages, we
analyzed the transcriptome and looked for candidate genes related to rice heterosis.
Results: By using an improved strategy of tag-to-gene mapping and two recently annotated
genome assemblies (93-11 and PA64s), we identified 10,268 additional high-quality tags, reaching a
grand total of 20,595 together with our previous result. We further detected 8.5% and 5.9%
physically-mapped genes that are differentially-expressed among the triad (in at least one of the
three stages) with P-values less than 0.05 and 0.01, respectively. These genes distributed in 12 major
gene expression patterns; among them, 406 up-regulated and 469 down-regulated genes (P < 0.05)
were observed. Functional annotations on the identified genes highlighted the conclusion that up-
regulated genes (some of them are known enzymes) in hybrid are mostly related to enhancing
carbon assimilation in leaves and roots. In addition, we detected a group of up-regulated genes
related to male sterility and 442 down-regulated genes related to signal transduction and protein
processing, which may be responsible for rice heterosis.
Conclusion: We improved tag-to-gene mapping strategy by combining information from
transcript sequences and rice genome annotation, and obtained a more comprehensive view on
genes that related to rice heterosis. The candidates for heterosis-related genes among different
genotypes provided new avenue for exploring the molecular mechanism underlying heterosis.
Background
Heterosis is defined as advantageous quantitative and
qualitative traits of offspring over their parents, and the
utilization of heterosis principles has been a major prac-
tice for increasing productivity of plants and animals [1].
A considerable amount of efforts have been invested in
unraveling genetic basis of heterosis in rice (Oryza sativa,
L) and it was explained mainly by mechanisms such as
dominance [2] and epistasis [3]. Although many investi-
gators favored one hypothesis over another, biological
Published: 19 September 2007
BMC Plant Biology 2007, 7:49 doi:10.1186/1471-2229-7-49
Received: 27 March 2007
Accepted: 19 September 2007
This article is available from: />© 2007 Song et al; licensee BioMed Central Ltd.
This is an Open Access article distributed under the terms of the Creative Commons Attribution License ( />),
which permits unrestricted use, distribution, and reproduction in any medium, provided the original work is properly cited.
BMC Plant Biology 2007, 7:49 />Page 2 of 15
(page number not for citation purposes)
mechanisms of rice heterosis may not be fully character-
ized based on genetic approaches alone, especially based
on classical genetic concepts.
Recently, it has been reported that differentially-expressed
genes between hybrids and their parental inbreeds are cor-
related with heterosis [4,5]. In wheat, a variety of differen-
tially-expressed genes including transcription factors and
genes involved in metabolism, signal transduction, dis-
ease resistance, and retrotransposons were detected
responsible for heterosis by using a differential display
technique [6,7]. Even ribosomal proteins have been scru-
tinized since they are indicators of translation activities
and plastid biogenesis [8]. Various techniques have been
applied to pin down genes involved in heterosis, such as
a variety of sequence-based and hybridization-based
methods; some have yielded interesting candidates and
others proposed expression patterns of these candidates
[5,9]. For instance, a hybrid-specific expressed gene AG5
(a RNA-binding protein) in wheat was identified [10].
Another study on gene generated expression profiles of an
elite rice hybrid and its parents at three stages of young
panicle development by using a cDNA microarray consist-
ing of 9,198 ESTs and the result pointed to a significant
mid-parent heterosis [11]. Nevertheless, it is necessary to
generate more data in large-scale, taking the advantage of
the fast advancing genomic technology.
SAGE technology is a sequence-based approach for inves-
tigating gene expression in large-scale and allows much
deeper sampling than EST (expressed sequence tag)-based
approaches. It has proven to be a very powerful method
for large-scale discovery of new transcripts, acquisition of
quantitative information of expressed transcripts, and the
quantitative comparison between libraries [12-14]. The
technique has been used extensively in animal systems
including human and mouse, and more particular in can-
cer research where several hundred libraries and nearly 7
million SAGE tags have been obtained [13,15]. In plant,
several studies have employed this methodology for tran-
script profiling in Arabidopsis [16,17] and rice [18,19].
However, a bottleneck of SAGE is tag-to-gene mapping,
which refers to the unambiguous determination of the
gene represented by a SAGE tag. Other limitations include
lack of accurate genomic sequences and adequate amount
SAGE data. Therefore, encouragements should be given to
studies that generated publicly available data since heter-
osis is not simply a manifestation of a few seemingly
important genes but many.
We have been studying the rice genome with a particular
interest in the molecular mechanism of heterosis as part
of the Super-hybrid Rice Genome Project (SRGP), focus-
ing on an elite super-hybrid (Liang-You-Pei-Jiu, LYP9 [20])
and its parental lines, using gene expression technology,
including EST and SAGE techniques. The objective of our
current work was to recover more sequence tags (gene
expression information) from our previous SAGE study
[21]. In our new analysis, SAGE tags were mapped to two
newly annotated genome assemblies, paternal cultivar
(93-11) and maternal cultivar (Pei-Ai 64s, PA64s) (BGI
unpublished data) [22,23]; the latter was not available
when we carried out the first analysis. Prefect matches of
SAGE tags to their own genome sequences allowed us to
map more tags in a very significant way: twice as much
tags were mapped as compared to the previous result. We
also used three types of transcripts, including full-length
cDNA (FL-cDNA) [24], expressed sequence tags (ESTs)
[25,26], and UniGene data as well as a new strategy in the
current analysis.
Results
The dataset
We obtained a total of 465,164 SAGE tags from nine SAGE
libraries constructed in parallel from the three major rice
tissues at distinct growth stages for the super-hybrid rice
(LYP9) and its parental (93-11 and PA64s) cultivars. These
libraries were made with mRNA isolated from (1) leaves
at the milky stage of rice grain maturation, (2) panicles at
the pollen-maturing stage, and (3) roots at the first tiller-
ing stage [21]. By using more stringent sequence-analysis
criteria in a quality-improving protocol, we removed con-
taminated tags matched to cloning linkers, vectors, and
simple repeats, and obtained 68,462 unique empirical
tags; this number is 21 tags less than the previous dataset
due to more stringent filters. Of these unique tags, 30,595
(44.7%) tags were observed more than once. The distribu-
tion of the mapped tags among different libraries is sum-
marized in Table 1. We deposited all the original SAGE
data in NCBI's Gene Expression Omnibus [27] and these
data are accessible through GEO Series accession number
GSE8048.
Evaluation dataset, virtual tags, and mapped tags
To obtain an evaluation dataset, we constructed a PCUE
(P
redicted genes, FL-cDNA, UniGene, and EST) database
based on available genomic resources (see Materials and
Methods). We classified 41,072 predicted genes of 93-11
into three sets: (1) 21,676 (53%) supported by one or
more transcripts, i.e. by any of three pieces of supporting
evidence (or types of transcripts) – FL-c
DNA, UniGene,
and E
ST, (2) 19,396 without supporting evidence, and (3)
10,702 supported by all three types of transcripts. This
evaluation dataset contains 2,480 test tags from (3) and
satisfies all five quality criteria (see Materials and Meth-
ods; Table 2).
In order to define virtual tags, we need to handle two
classes of virtual transcripts based on predicted genes: (1)
supported by transcripts that have actual 3'-UTR
BMC Plant Biology 2007, 7:49 />Page 3 of 15
(page number not for citation purposes)
sequences (Figure 1A) and (2) without supporting evi-
dence but defined by adding an artificial 3'-UTRs (Figure
1B). From the first class, we categorized 13 different
groups of virtual tags based on variable 3' UTR sequence
features (in Table 2). We also found that the virtual tags
constructed from the longest UniGene (Unimax, 97.22%)
and the longest EST (ESTmax, 74.92%) had better yield in
matching the virtual tags to the test tags, largely due to
their longer 3'-UTRs. As a comparison, the virtual tags
constructed from the Uni-S and EST-S groups that possess-
ing poly (A) signals had slightly poorer but significant
yields – 95.80% and 71.60%, respectively. For the second
class, we need to choose a length range for artificial UTRs
that are to be added to the predicted genes. For 19,079
non-redundant FL-cDNAs (see Additional file 1: UTR Size
distribution), whose 3-UTRs have a distinct length distri-
bution with a mean of 422 bp and a median of 295 bp, we
decided to use a 100-bp window and an optimal length
range of 300 bp. The four sets of virtual tags, including
cDNA, Unimax, ESTmax, and predicted genes with 300 bp
3'-UTR, were used for further analyses (Table 2).
We assigned 20,595 unique tags to 19,961 predicted genes
(Table 3) in three types: (1) 16,757 (81.36%) unambigu-
ous tags, (2) 3,316 (16.10%) tags physically-mapped to
1,668 genes (two or more different tags assigned to the
same predicted genes), and (3) 698 (3.39%) tags physi-
cally-mapped to 1,536 genes (each tag assigned to multi-
ple genes). Among these mapped tags, 16,430 (80%) were
supported by transcripts and 4,341 (20%) were not sup-
ported by known evidence; the latter are largely hypothet-
ical transcripts that are either expressed at lower level or
specific to certain tissues or developmental stages (based
on microarray and EST analyses of our own data; data not
shown). This process led to a more rigorous tag-to-gene
assignment, allowing us to gain 10,268 additional tags,
compared to our previous results. In addition, we found
that 1,610 previously mapped tags were absent in the cur-
rent data, and the missing tags were filtered out by the
Table 2: Dataset for evaluating tag assignment
Dataset Subset Total w/o
Tags
a
w/Tags Hits
b
%
cDNA cDNA 2480 0 2480 2480 100
Unigene
c
Unigene 2806 3 2803 2627 93.62
Uni-S 2712 1 2711 2598 95.80
Uni-N 94 1 93 29 30.85
UniBest 2480 0 2480 2414 97.34
Max-
Length
2480 0 2480 2411 97.22
EST
c
EST 54764 3597 51167 36484 66.62
EST-S 26242 1631 24611 18788 71.60
EST-A 2749 182 2567 1665 60.57
EST-N 21169 1592 19577 12702 60.00
EST-B 4604 192 4412 3329 72.31
ESTBest 2480 19 2461 1842 74.27
Max-
Length
2480 19 2461 1858 74.92
Predicted
d
Predicted 2480 44 2436 415 16.73
P-100 2480 26 2454 787 31.73
P-200 2480 9 2471 1308 52.74
P-300 2480 4 2476 1457 58.75
P-400 2480 2 2478 1181 47.62
P-500 2480 1 2479 869 35.04
a
Numbers of cDNA sequences that do not have tags due to the
absence of NlaIII sites.
b
Numbers of virtual tags that matched to our
empirical dataset.
c
Capital letters stand for transcripts that have 3'
polyA signal (S), 3' polyA tail (A), both the signal and the tail (B), and
neither (N), respectively.
d
Predicated gene models and extended
lengths (bp) from stop codon (P-100 to P-500).
Table 1: Summary of mapped tags among nine libraries
Library
a
Total Tags Unique
Tags
Mapped
Tags
b
% Mapped Copy Number Distribution of Mapped Tags
>= 100 21–99 6–20 2–5 1
N1 69545 22887 9898 43.2 24 235 1240 3922 4477
N2 52313 15396 8102 52.6 38 197 795 2950 4122
N3 48196 18073 8299 45.9 12 154 885 3103 4145
P1 47058 11868 5531 46.6 39 158 555 1856 2923
P2 46814 13922 6352 45.6 40 176 622 2193 3321
P3 67638 19586 8392 42.8 27 257 1099 3037 3972
L1 68546 23176 10299 44.4 24 224 1178 3942 4931
L2 36209 9866 5356 54.3 40 133 552 1819 2812
L3 28845 10863 5480 50.4 6 78 468 1817 3111
Total 465164 68462 20595 250 1612 7394 24639 33814
a
P, N, and L stand for PA64s, 93-11, and LYP9, respectively. Numbers 1, 2, and 3 denote libraries made from materials of panicles at the
pollen-maturing stage, leaves at the milking stage, and roots at the first tillering stage, respectively.
b
Mapped tags refer to those that
mapped to the virtual transcripts based on predicted genes that are (a) supported by transcripts that have authentic 3'-UTR sequences
and (b) lacking supporting evidence but defined by adding an artificial 3'-UTRs).
BMC Plant Biology 2007, 7:49 />Page 4 of 15
(page number not for citation purposes)
more stringent criteria used in this study that resulted in a
removal of 1,649 FL-cDNAs as compared to the previous
data set. There were 45,025 unmapped tags that did not
satisfy our stringent criteria (see Materials and Methods
for details).
Differentially-expressed genes among twelve distribution
patterns
We defined differentially-expressed genes by calculating P
values between any two libraries using a previously
reported statistic method [28]; the process yielded 1,751
(8.5%) and 1,216 (5.9%) significant differentially-
expressed genes with P values of < 0.05 and < 0.01, respec-
tively (Table 4). In the process of summarizing overall
expression profiles, regardless the origin of tissues, we
found 781, 360, and 324 differentially-expressed genes
from pair-wise comparisons of LYP9 versus PA64s (L vs.
P), LYP9 versus 93-11 (L vs. N), and LYP9 versus both
parental cultivars (both) at a less stringent threshold (P <
0.05), respectively. There is an obvious bias – the genes
with paternal-like expression (PLE; L vs. P) are twice as
much as those with maternal-like expression (MLE; L vs.
N). This bias suggests that LYP9 possesses more differen-
tially-expressed genes from PA64s than from 93-11,
regardless whether they are up-regulated or down-regu-
lated; in other word, LYP9 is more similar to 93-11 than
to PA64s in its overall gene expression.
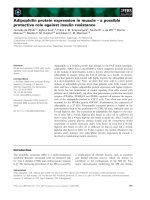
We further examined the profiles of differentially-
expressed genes by classifying them into 12 different dis-
tribution patterns, displayed separately according to dif-
ferent tissues, and plotted the intensity of gene expression
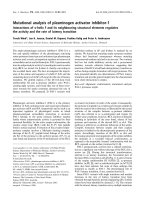
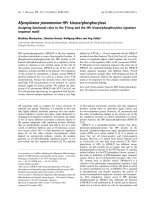
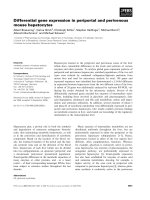
Description of the strategy used to construct the conceptual transcriptFigure 1
Description of the strategy used to construct the conceptual transcript. The high-quality genome assembly of 93-11
(Oryza sativa L. subsp. indica; [48] and a collection of transcriptome information (FL-cDNA, UniGene, and ST; see Materials and
Methods) were used for the construction of virtual transcripts. When the transcript sequences extend beyond the predicated
coding sequence were available, the UTR sequences were aligned and determined (A). When the information was not available,
the theoretical 3' UTR sequences were determined based on a stepwise (100-, 200-, 300-, 400-, and 500 bp) assessment of the
genome sequences and added after the stop codons (B). Nearly 58.7% of the assigned tags have a 3'-UTR length of 300 bp.
BMC Plant Biology 2007, 7:49 />Page 5 of 15
(page number not for citation purposes)
as fold changes (less than 16-fold) at P < 0.05 and P < 0.01
(Figure 2). There were 686, 568, and 413 genes differen-
tially-expressed in panicles (see Additional file 2), leaves
(see Additional file 3), and roots (see Additional file 4),
among the triad at P < 0.05, respectively. The correspond-
ing numbers were 599, 393, and 240 at P < 0.01. Genes
that show changes of >16-fold and genes that only
assigned to PA64s are also listed (see Additional file 5). In
order to describe the gene distribution clearly according to
their relationship between the hybrid and its parents, we
partitioned the twelve distribution patterns into three
basic categories: over-dominance (the top four slices),
under-dominance (the bottom four slices), and mid-par-
ent (the four slices divided by the horizontal line).
From the overall distribution of differentially-expressed
genes with higher P values (P < 0.01), we made several
observations among the samples. First, gene distribution
pattern in panicles is rather distinct and more biased than
that in the other two tissues, in such a way that most of the
down-regulated genes are very paternal-like (or almost
identical to 93-11, N = L < P) and the up-regulated genes
are rather dispersive (not focused along the solid line of N
= L > P). The dispersiveness suggested that most of these
genes are roughly paternal-like but their expression levels
are approximating toward either the hybrid (LYP9) or the
mid-parent in a quantitative manner. We speculate that
this obviously restricted distribution in panicles may be
either due to one or both the following possible biases.
One bias may come from thermo-sensitive male sterility
unique to the maternal cultivar, PA64s, where germline-
related genes may be crippled in their overall gene expres-
sion though epigenetic mechanisms. The other possible
bias may be resulted from incompatibility between alleles
from the parental lines, which may cause a rather major
regulatory effect for the majority of genes, such as DNA
methylation in germline tissues. Second, the distribution
of genes in leaves and roots are somewhat similar, espe-
cially among the down-regulated genes, and fold changes
of these down-regulated genes are not as apparent as those
in panicles. However, the distributions of up-regulated
genes in the two tissues are rather distinct, where the up-
regulated genes in leaves are biased toward over-domi-
nant expression albeit a minority of the genes is found
spreading toward mid-parent. In roots, the up-regulated
Table 3: Mapped tags and supporting evidence
Type
a
Mapped Tags (%) T-supported
b
P-supported
b
Total
Genes
>1 = 1 >1 = 1
1-1 16757(81.36%) 10087 2708 1921 2041 16757
n-1 3316(16.10%) 2476 796 26 18 1668
1-n 698(3.39%) 314 49 191 144 1536
Total 20595 12877 3553 2138 2203 19961
a
1-1, one tag that was mapped to a single gene; n-1, multiple tags that
were mapped to a single gene; 1-n, one tag that was mapped to
multiple genes.
b
T-supported tags are those mapped to genes with
known transcripts and P-supported tag are those mapped to
predicted gene models.
Table 4: Differentially-expressed genes with significance
a
Tag
P < 0.05 P < 0.01 Microarray-
confirmed
Tissue Total Up/Down
(>= 2)
b
Up/Down
(>1)
b
Total Up/Down
(>= 2)
b
Up/Down
(>1)
b
Total/<0.05/
<0.01
c
N vs L Panicle 371 99/80 188/167 123 33/25 52/66 1335/133/75
Leave 411 130/64 231/126 199 81/37 124/51
Root 283 80/58 148/112 113 39/29 61/44
Panicle 666 136/238 265/332 558 123/220 221/281
P vs L Leave 476 157/84 272/179 319 131/66 194/108 1209/142/35
Root 346 81/88 155/162 185 47/56 80/89
Panicle 322 91/68 175/134 91 32/16 46/42
Both Leave 286 121/39 194/77 125 76/21 97/29 232/53/8
Root 194 65/36 102/73 65 31/16 37/28
Panicle 715 144/250 278/365 590 124/229 191/305
Total Leave 601 166/109 309/228 393 136/72 221/130 2312/222/102
Root 435 96/110 201/201 233 55/69 104/105
a
We listed tags that have P-value less than 0.05 and 0.01 as significant thresholds for the dataset, and divided into three categories: PA64s vs. LYP9
(P vs. L), 93-11 vs. LYP9 (N vs. L), and the overlapped tags (Both). The statistics was based on the Audic and Claverie test statistic (IDEG6, http://
telethon.bio.unipd.it/bioinfo/IDEG6_form/).
b
Up/Down are calculated with L/[(P+N)/2] for up-regulated tags and [(P+N)/2]/L for down-regulated
tags.
c
The microarray data were extracted from experiments performed in our laboratory for a parallel analysis. Total consistent and significant
gene numbers are listed
BMC Plant Biology 2007, 7:49 />Page 6 of 15
(page number not for citation purposes)
genes, though they are rather smaller in number as com-
pared to panicles and leaves (101 genes, Table 4), are
mostly over-dominant. Finally, in the process of summa-
rizing gene distributions in the twelve patterns, we found
that a minority of the differentially-expressed genes (25 to
45%) exhibited additive expression (P > L > N and N > L
> P; genes that were plotted on the horizontal lines),
whereas the majority of the genes, 380 (55%), 408 (72%),
and 309 (75%), are non-additive in panicles, leaves, and
roots, respectively. Among the sum of these non-additive
genes in all three tissues, 552 genes showed over-domi-
nant expression, and a smaller amount, 394 genes, were
found under-dominantly expressed. In addition, 115 and
32 genes are expressed at the same level as their paternal
line (93-11) and maternal line (PA64s), respectively;
these genes are classified as dominant expression.
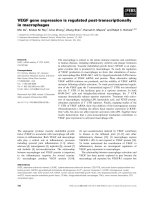
Functional analyses of differentially-expressed genes
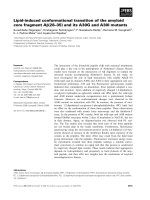
We annotated 217 (22.8%) and 850 (89.3%) differen-
tially-expressed genes on the basis of two general data-
bases, KEGG (Kyoto Encyclopedia of Genes and
Genomes)[29] and InterPro/Network [30], respectively.
The genes were further classified into 20 categories accord-
ing to KEGG Gene Ontology (KOG) classification scheme
(Figure 3); among them, genes involved in carbohydrate
metabolism are the most abundant (16%), followed by
energy metabolism (10%), and amino acid metabolism
(8%). For instance, differentially-expressed genes in the
hybrid are mostly related to enhancing carbon assimila-
tion, energy metabolism, and biosynthesis of secondary
metabolites; this effect is not due to simple distribution
bias in the overall gene distribution since other categories
were found decreased in the hybrid, such as protein sort-
ing/folding/degradation in leaves (Figure 4). Dramatic
down-regulation was also seen in metabolisms of co-fac-
tors and vitamins in panicles.
Although the overall comparison to the previous results
that were based on less number of tags led to similar con-
clusions, we feel that our current data allowed us to fur-
ther look into more pathways and molecular details,
which were not thoroughly exploited in the previous anal-
ysis. We divided carbon metabolism into three cellular
compartments: the chloroplast, the mitochondrion, and
the cytoplasm (Figure 5). The genes involved in photosyn-
thesis in chloroplast were all up-regulated both in leaves
and roots but down-regulated in panicles; this trend was
readily observed in the overall distribution (Figure 2).
Among them, 12 genes encode chlorophyll a/b binding
proteins, 17 are photosystem I/II component genes, and
ribulose bisphosphate carboxylase that is a key enzyme
mediating the initial reaction of CO
2
fixation. Details of
genes involved in light reaction are listed (see Additional
file 6). We also observed three key enzymes involved in
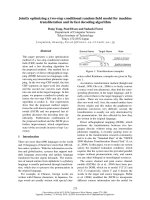
Expression patterns and fold changes of differentially-expressed genesFigure 2
Expression patterns and fold changes of differentially-expressed genes. Differentially-expressed genes in panicle, leaf,
and root, among 93-11 (N), PA64s (P), and their F1 hybrid LYP9 (L) are shown. Twelve different patterns were labeled in each
slice and their graphical indicators were displayed surrounding the three panels. The radius at which a gene is plotted repre-
sents log
2
of the fold change between the high and low values among three rice cultivars, and the angle represents the relation-
ships between LYP9 and its parents. Differential expressed genes with significance intervals of 0.01 <P < 0.05 and P < 0.01 are
shown in blue and green, respectively. Only tags that exhibited changes of <16-fold are plotted since those beyond the fold
value are very limited in numbers (listed in Additional file 5). Note (1) genes harbored by the five patterns above the horizontal
lines in each panel are up-regulated (positive heterosis) in hybrid, (2) genes in the five patterns in each panel below the hori-
zontal lines are down-regulated (negative heterosis) in hybrid, and (3) two mid-parent patterns are on the horizontal lines.
BMC Plant Biology 2007, 7:49 />Page 7 of 15
(page number not for citation purposes)
five other selected key pathways (glycolysis/gluconeogen-
esis, citrate cycle, anaerobic respiration, glycolic acid oxi-
date, and fatty acid β-oxdidation) in the mitochondrion
and cytoplasm. The first enzyme, alcohol dehydrogenates
involved in the anaerobic respiration, is the most up-reg-
ulated gene in all three tissues. The second enzyme, fruc-
tose-1,6-bisphosphatase involved in gluconeogenesis, is
up-regulated only in leaves. The last, pyruvate kinase that
catalyzes phosphoenolpyruvate to form pyruvate and ATP
(or decomposition of carbohydrate) is down-regulated
both in leaves and panicles but not in roots. In addition,
we observed that catalase, known to be involved in gly-
colic acid oxidate pathway (one of the three respiration
pathways and unique to rice for better adapting its watery
environment), is significantly up-regulated. Furthermore,
along the pathway of synthesizing sucrose and its storage
form (starch), we identified four genes, encoding beta-
phosphoglucomutase, 1,4-alpha-glucan branching
enzyme, sucrose phosphate synthase, and sucrose syn-
thase, which are also up-regulated in leaves and panicles.
These enzymes are believed to contribute to high grain
yield in the super-hybrid rice.
There were many other functionally annotated genes
found to be significantly up-regulated, including rapid
alkalinization factor, proteinase inhibitor, and MADS-box
transcription factors; all appeared to be relative to the
traits for photoperiod sensitive genic male sterility, male
fertility restoration, and pollen fertility, according to the
quantitative trait loci (QTL) database (Gramene [31]; see
Additional file 7). Among them, the MADS-box
(9311_Chr06_3092 and 9311_Chr01_4641) and rapid
alkalinization factor (9311_Chr12_1510) genes were
found highly expressed in the hybrid as compared to its
parental lines despite the fact that the expression of these
genes are already higher in its paternal line 93-11 than in
its maternal line PA64s. This result indicated that these
genes may play important roles directly or indirectly in
flower morphogenesis and fertility of hybrid LYP9.
We also identified a large number of down-regulated
genes that were not obvious in the previous analysis,
largely due to more mapped tags and subtleties in data
analysis protocols. These expression-suppressed genes
belong to different functional categories among the three
tissues; most of them are involved in energy metabolism,
lipid metabolism, and glycan biosynthesis and metabo-
lism in panicles, amino acid metabolism and protein
processing in leaves, and biosynthesis of secondary
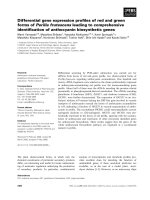
metabolites in roots (Figure 4). The top-one down-regu-
lated genes in panicles, leaves, and roots are metal-
lothionein, peptidase M48, and glutathione S-transferase
respectively. Metallothioneins are cysteine-rich proteins
that can bind to heavy metals and scavenging reactive oxy-
Functional categories of differentially-expressed genes (P < 0.05) among the three cultivarsFigure 3
Functional categories of differentially-expressed genes (P < 0.05) among the three cultivars.
BMC Plant Biology 2007, 7:49 />Page 8 of 15
(page number not for citation purposes)
gen to protect plants from oxidative damage. Although it
is the most down-regulated gene in panicle, it is up-regu-
lated in root which plays an important role in assimilat-
ing, filtrating, and concentrating metal irons especially in
screening heavy metal irons. Peptidase M48 is a family of
proteins that function in protein degradation. We also
found some other down-regulated genes related protein
degradation, such as ubiquitin and ubiquitin-conjugating
enzyme. Glutathione S-transferase is an enzyme to metab-
olize toxic exogenous compound that utilizes glutathione
in the detoxification, for chemical defense in plants. We
speculate that both of these up- and down-regulated genes
represent a significant fraction of the genes regulating
panicle development, rapid growth, stress tolerance, and
grain yield in LYP9. Obviously, further verification and
functional examination of these differentially-expressed
genes are of essence in understanding their precise roles in
heterosis.
Functional Categories of up-regulated and down-regulated genes in panicles, leaves, and rootsFigure 4
Functional Categories of up-regulated and down-regulated genes in panicles, leaves, and roots.
BMC Plant Biology 2007, 7:49 />Page 9 of 15
(page number not for citation purposes)
Cross-referencing SAGE data to Microarray-based results
We have compared our SAGE data with those from micro-
array-based experiments in a limited way where only data
from one tissue, the leaf, were eligible for legitimate com-
parison, since the mRNA sample was harvested from
leaves at the milking stage, identical to what we used for
the SAGE experiment. The microarray data were acquired
by using a custom-designed oligoarray that contains
60,727 oligonucleotide probes representing all predicted
genes from the genome assembly of 93-11 [22]. From this
grand total, we identified 3,355 informative data points
that were found in both microarray and SAGE data, and
2,312 (69%) of them showed a consistent trend between
the two types of experiments (the spearman coefficient is
Differentially-expressed genes that are involved in selected key metabolic pathways among three major cellular compartmentsFigure 5
Differentially-expressed genes that are involved in selected key metabolic pathways among three major cellu-
lar compartments. Genes involved in photosynthesis, glycolysis/gluconeogenesis, citrate cycle (TCA cycle), anaerobic respi-
ration, glycolic acid oxidation, and fatty acid β-oxdidation pathways are shown. The enzymes (
#
denotes key or rate-limiting
enzymes) are: E1
#
, fructose-1,6-bisphosphatase; E2, fructose-bisphosphate aldolase; E3, glyceraldehyde 3-phosphate dehydro-
genase; E4, phosphoglycerate kinase; E5
#
, pyruvate kinase; E6
#
, alcohol dehydrogenase; E7, catalase; E8, acyl-CoA dehydroge-
nase; E9, succinyl-CoA ligase; E10, malate dehydrogenase; E11
#
, ribulose bisphosphate carboxylase; E12, transketolase; E13,
ribulose-phosphate 3-epimerase; E14, phosphoribulokinase; E15, beta-phosphoglucomutase, 1,4-alpha-glucan branching
enzyme; E16
#
, sucrose phosphate synthase; E17
#
, sucrose synthase. Proteins and enzymes in the light reaction complex are
plastocyanin, ferredoxin [2Fe-2S], chlorophyll A-B binding protein, photosystem II protein PsbX, photosystem II protein PsbW,
photosystem II protein PsbY, photosystem II oxygen evolving complex protein PsbP, photosystem II protein PsbR, photosys-
tem II manganese-stabilizing protein PsbO, photosystem II oxygen evolving complex protein PsbQ, photosystem I reaction cen-
tre (subunit XI PsaL), photosystem I psaG/psaK protein, photosystem I reaction centre subunit N, photosystem I reaction
center protein PsaF (subunit III), NADH:flavin oxidoreductase/NADH oxidase, and cytochrome b ubiquinol oxidase. The ratios
of up- (+) or down (-) -regulated tags are indicated. Detailed information for light reaction complexes is listed in Additional file
6. Note that the key enzymes are either up- or down-regulated in three tissues; this behavior suggests active yet unique regu-
lations in the hybrid.
BMC Plant Biology 2007, 7:49 />Page 10 of 15
(page number not for citation purposes)
0.497, P < 0.0005). We found that the consistent trend
among genes with a moderate-to-high expression
between the two datasets correlated fairly well (the spear-
man coefficient is 0.743, P < 0.0005; data not shown). Of
these genes, 222 (39%) were differentially-expressed
according to the SAGE data with significance (P < 0.05).
We listed 23 genes with a fold change of greater or equal
to 2 in Table 5. These confirmation rates are not much dif-
ferent from reported comparative analyses between these
two types of experiments since the reasons for systematic
errors are multifold, including sampling time, experimen-
tal procedures, and data normalization [13].
Discussion
Tag-to-gene mapping procedures
SAGE and related sequencing-based techniques are very
effective for studying gene expression in organisms where
well-characterized genome sequences are available, and
they have been applied to a number of eukaryotic species
[17,19,32] and the merits and success have been discussed
very recently by Marco Marra and his colleagues with
ample experimental data [12], albeit pitfalls do exist [13].
In our previous SAGE study, we utilized the available FL-
cDNA sequences [24] for tag-to-gene mapping [21], as
these FL-cDNA sequences best represent the rice transcrip-
tome albeit in a rather limited amount. However, a large
proportion (83%) of the SAGE tags was not found in this
cDNA data collection that is known not covering all the
genes of the rice genome. To overcome this limit, we uti-
lized a new strategy for tag-to-gene mapping based on
newly annotated genes of the two rice genome assemblies
and other transcript sequences (FL-cDNA, UniGene, and
ESTs). This process led to a significant improvement in
gene identification, resulting in 10,268 additional tags
and 68.85% extra differentially-expressed genes at a
higher P value (P < 0.01), as compared to the previous col-
lection.
Aside from the success of mapping SAGE tags to anno-
tated genes in the genome, there are a couple of important
points that are worthy of further discussion. First, we
always have tags that are mapped to ambiguous positions,
Table 5: Differentially-expressed genes from 93-11 leaf libraries confirmed by microarray data
Gene Model Tag Tag Number Ratio
b
Microarray Signal Annotations
N
a
P
a
L
a
N
a
P
a
L
a
Up-Regulated Tags (≥2-fold)
9311_Chr08_2156 GATTTGTATA 1 0 33 66.00 251 200 275 Plastocyanin-like
9311_Chr06_1523 TCATTTCAGT 2 0 14 14.00 3706 3473 6017 Major intrinsic protein
9311_Chr06_1142 ATCTGTTGCT 0 2 8 8.00 224 246 263 EPSP synthase (3-phosphoshikimate 1-
carboxyvinyltransferase)
9311_Chr07_1712 GATCCGTCTC 13 0 47 7.23 1288 1238 2097 Thiamine biosynthesis Thi4 protein
9311_Chr06_1545 GTACTGTCTG 13 19 55 3.44 249 361 410 Ubiquitin
9311_Chr03_1401 TTCCCCCATT 11 4 22 2.93 261 150 263 Protein of unknown function DUF250
9311_Chr05_0842 CTGTATTACT 41 47 94 2.14 1030 994 1072 Calcium-binding EF-hand
Down-Regulated Tags (>2-fold)
9311_Chr11_0807 GAATATTGGA 0 43 3 7.17 854 1030 976 Sucrose synthase
9311_Chr10_2185 TATCATTACA 40 169 19 5.50 2536 3225 1968 Mitochondrial substrate carrier
9311_Chr07_1231 CACATAAATT 38 26 6 5.33 3539 1750 957 Photosystem I reaction centre subunit IV/
PsaE
9311_Chr03_0009 TACATAGACA 23 66 11 4.05 667 681 659 Unknown
9311_Chr03_3682 ATTGCGGAAT 10
3
323 55 3.87 4577 5270 3054 Glycine hydroxymethyl transferase
9311_Chr01_4972 GATCGATGGG 4 53 8 3.56 239 747 504 Cellular retinaldehyde-binding)/triple
function, C-terminal
9311_Chr03_3625 ACACTACAGT 2 36 6 3.17 203 401 245 Unknown
9311_Chr03_4144 CTTACAAGTG 25 58 14 2.96 929 947 655 Rieske [2Fe-2S] region
9311_Chr01_2088 GAGAGAGGGA 11
7
186 52 2.91 6807 7259 3098 Photosystem II manganese-stabilizing
protein PsbO
9311_Chr12_1000 GATATATGGA 69 256 58 2.80 2501 2801 1201 Photosystem I reaction centre, subunit XI
PsaL
9311_Chr04_3185 TAGTGATAAG 8 36 8 2.75 1563 1689 1217 Lipase, class 3
9311_Chr03_0940 ATCGCCGAGA 19 68 17 2.56 1520 2064 1220 Glutamine synthetase, beta-Grasp
9311_Chr01_4844 GTTAGCAAAA 11 17 6 2.33 2280 2985 1878 Calsequestrin
9311_Chr06_2649 AGGGAGGCCG 25 2 6 2.25 246 192 222 Heat shock protein DnaJ, N-terminal
a
P, N, and L stand for PA64s, 9311, and LYP9, respectively.
b
Ratios are calculated as ratio = L/[(P+N)/2] for up-regulated tags and [(P+N)/2]/L for
down-regulated tags.
BMC Plant Biology 2007, 7:49 />Page 11 of 15
(page number not for citation purposes)
and they may belong to multiple loci (such as gene fami-
lies and splicing variants) in the genome sequence, espe-
cially when the length of SAGE tags is as short as 14 bp.
There were 4,014 (20%) such tags in our case, we assigned
these tags to the genomes and used them for functional
analysis. For example, despite the fact that a tag with a
sequence of "AACAAGCTCA" was assigned to two differ-
ent loci (9311_Chr04_1718 and 9311_Chr05_1829), the
two were evidenced by two different FL-cDNA sequences
(AK0ah71547 and AK061050), allowing us to identify
them as members of the fructose-bisphosphate aldolase
gene family. These two genes were found down-regulated
in roots of the hybrid line, and they are involved in glyco-
lysis/Gluconeogenesis pathways. Therefore, it is critical to
map these seemingly ambiguous genes, especially when
they are differentially regulated in the hybrid. It is possible
to design experiments to distinguish these genes with
locus-specific primers since most of these duplicated (or
closely related) genes may be not identical in their UTR
and genomic sequence, especially when genome
sequences are readily available. As we have reported pre-
viously, the rice genome has enormous number of dupli-
cated genes [23] that some of them may actually hold
pivotal information in hybrid vigor.
The second point has to do with the fact that a fraction
(often more than 40%) of the experimental tags remains
unassigned to genes so we need to figure out the possible
reasons. When comparing unassigned tags to virtual tags
based on predicted NlaIII sites in the nuclear and organel-
lar (mitochondrial and chloroplast) genome sequences,
we found that 2,500 tags out of 47,867 (5%) were absent
in the genome sequence assembly of 93-11, and 342 tags
(0.6%) were derived from either the mitochondrial (491
kb) or chloroplast genomes (134 kb). These unassigned
tags are most likely due to sequencing errors, sequences
interrupted by introns, un-assembled sequences (includ-
ing those in the sequence gaps), and organelle-specific
sequences. In addition, we have technically implemented
an artificial 300-bp UTRs for predicted genes without tran-
script-based evidence and only extracted the 3' most
(canonical position) tags from virtual transcripts. This
procedure is certainly incapable of including all UTR
length variants, largely due to the absence of canonical
polyadenylation signal for the accurate determination of
the 3' UTR length in plant genomes [33]. To estimate the
result of such a procedure, we compared the remaining
total unassigned tags to a cumulative virtual tag dataset
constructed by varying the artificial UTR lengths in a 100-
bp interval, from 100 to 500 bp, resulting in a further
assignment of 3,119 (6.5%) additional tags. However,
these tags were considered unreliable and were not
included in this analysis. Nevertheless, the UTR-derived
anomaly seems contributing to the impaired tag assign-
ment in a similar way as the sequence anomaly. Other
obvious factors resulting in unassigned tags, such as
experimental artifacts (incomplete enzyme digestions and
ligations, as well as inefficient cloning procedures), are
not discussed here in details.
The differentially-expressed genes in multiple expression
patterns
Over the years, differential gene expression between the
hybrid and its parental cultivars has been hypothesized to
attribute to heterosis [5,34]. As having partitioned the dif-
ferentially-expressed genes into twelve patterns as conven-
tionally done, we found only 25% to 45% or minorities
of the genes were additively expressed in the rice hybrid;
this result contradicted what was reported for a similar
study in hybrid maize, where additively expressed genes
were found as a major trend, 77.7% [35]. The reason for
such a disparity may be complex as it may be related to
operational pollination strategies and differences in epi-
genetic regulations. Meyer et al. (2004) have shown that
alternative pollination methods (hand-vs. self-pollina-
tion) have significant effects on seed size and early seed-
ling growth rate in Arabidopsis. The patterns of gene
expression altered obviously in cross-fertilized kernel as
compared to self-fertilized kernel, both qualitatively and
quantitatively [36], largely due to cis-transcriptional vari-
ations in maize inbred lines that lead to additive expres-
sion patterns in the F1 hybrids [37]. For the involvement
of possible epigenetic mechanisms, we refer to the differ-
ence in transposon density between the two species as the
maize genome is more heavily bombarded by active
repeats and we speculate that a more vigorous methyla-
tion tactic might be used in gene regulation in maize.
Among non-additively expressed genes, both over-domi-
nant and under-dominant genes are rather abundant, sup-
porting in part the over-dominance hypothesis for rice
heterosis [34].
Among all differentially-expressed genes, we identified up
to 70% of them (P < 0.01) exhibiting paternal-like expres-
sion (PLE) profiles, especially in panicles, which are at
least in part attributable to two plausible mechanisms –
molecular imprinting and defective expressions of the
maternal alleles – as often observed in panicles harvested
at the pollen maturing stage, where thermo-sensitive male
sterility of the maternal line (PA64s) may be relevant [38].
For instance, two MADS-box transcription factors related
to pollen fertility have been consistently observed as up-
regulated in the hybrid, but they do not express in the
male-sterility plant [39,40]. The rapid alkalinization fac-
tor, a polypeptide hormone that was suggested to be
related to nuclear sterility and development [41], was
observed to be up-regulated and located in photoperiod-
sensitive and genic male sterility trait based on our QTL
analysis. Although we have not been able to plot plausible
functional scenarios on the precise roles of these genes,
BMC Plant Biology 2007, 7:49 />Page 12 of 15
(page number not for citation purposes)
the findings undoubtedly provide useful clues for future
molecular studies.
Putative regulation mechanisms of differentially-expressed
genes
Differential gene expression in plants is known to be
mainly regulated by two forms of mechanisms – cis- and
trans-regulations at transcription levels as well as epige-
netic and post-transcription modulations [6]. For
instance, differential methylation in CpG or CNG islands
[9,42] and allele-dependent mechanisms of gene regula-
tion [43] have been demonstrated between hybrid and its
parents in rice and maize. However, variations among cis-
regulatory elements are hard to study but trans-regulatory
factors are easier to identify based on gene expression
data. We have indeed found over 48 transcription factors,
annotated as differentially-expressed genes, including
MADS-box genes, TFIIE, bZIP, and Jumonji; these genes
have been found involved in various aspects of develop-
ment and differentiation in land plants. Some of the
MADS-box genes function in floral tissues as "molecular
architects" of flower morphogenesis. TFIIE is an essential
component of the RNA polymerase II transcription
machinery [44], playing important roles at two distinct
but sequential steps in transcription: pre-initiation com-
plex formation-activation (open complex formation) and
the transition from initiation to elongation [45].
Although the possible contributions of these transcription
factors, all-purpose or members of multiple gene families,
to hybrid vigor may not be easily demonstrated, their
presence and regulated expression are initial clues for in-
depth molecular and genetic studies.
An increasing number of studies have reported that func-
tional divergence in duplicated gene is accompanied by
gene expression change although the evolution mecha-
nism behind this process remains unclear. There was a
report that 7% of duplicated gene pairs co-express in yeast
[46], and we know that gene and chromosomal segment
duplications widely exist in the rice genome, including an
ancient whole genome duplication, recent segmental
duplications, and massive ongoing individual gene dupli-
cations that cover 65.7% of the genome [23]. We found 7
of our 698 ambiguous assigned tags are mapped to the
duplicated gene pairs, which we suspected the duplication
with a high homology may affect gene expression includ-
ing silencing and up- or down-regulation of one of the
duplicated genes after hybridization [47]. When looking
into the possible molecular assays in distinguishing the
different alleles, we found that it is actually possible to
design allele-specific primers to detect the expression level
of duplication pairs.
Conclusion
We improved the tag-to-gene mapping strategy by com-
bining information from transcript sequences and rice
genome annotation and obtained over 10,000 new tags
for a more comprehensive view of genes that related to
rice heterosis. These heterotic expression genes among dif-
ferent genotypes provided new avenues for exploring the
molecular mechanisms underlying heterosis, including
variable gene expression patterns.
Methods
PCUE database
We constructed a PCUE database for rice (Oryza sativa) on
the basis of available genomic resources that contain (1)
the improved whole genome shot-gun sequence assem-
blies of 93-11 [GenBank: AAAA02000000] and PA64s as
well as their annotations [48], (2) a collection of 19,079
non-redundant FL-cDNAs (nr-FL-cDNAs; [23] from
KOME [49], and (3) 51,336 UniGenes (UniGene Build
#59) and 1,183,931 ESTs from NCBI [50].
We aligned the collected transcript sequences to the two
genome sequences by using BLAT [51] to obtain a dataset
for tag annotations. The threshold parameters set for
aligned transcripts are (1) at least 90% identical to their
genomic sequences and (2) covering ≥ 90% transcript
sequences. When a transcript has more than one hit to
genomic sequences, the longest consensus was selected as
the best-aligned (true) locus. We further selected
sequences that span the 3' end of a predicted gene but do
not extend to the next with ≥ 100-bp overlapping
sequences. As a result, our predicted genes were parti-
tioned into two sets: supported by one or more transcripts
and without supporting data.
The evaluation dataset
In order to evaluate the accuracy of tag-to-gene mapping
methodology, we built a test dataset that contains 2,480
FL-cDNA sequences that satisfied all five criteria: (1) ORF
length > 300 bp, (2) with poly(A) signal (AATAAA/
ATTAAA) or poly(A) tails (with a minimal number of five
A) [15], (3) alignable to a unique predicated gene with
homolog (based on 50% protein sequence similarity or
100 residues) to Arabidopsis, (4) a unique CATG tag and
experimental data, and (5) alignable to a unique pre-
dicted gene and corresponding UniGenes or ESTs. We fur-
ther divided this dataset into three categories: UniGene,
EST, and predicted gene. In the Unigene and EST catego-
ries, we have twelve subsets. Eight of those were sequences
with poly(A) signal (Uni-S and EST-S), with poly(A) tails
(Uni-A and EST-A), with both poly(A) signal and tail
(Uni-B and EST-B), without poly(A) signal and tails (Uni-
N and EST-N). The other four subsets contained the long-
est and the best transcripts that were best validated by
either UniGenes or ESTs (Unibest or ESTbest). To know
BMC Plant Biology 2007, 7:49 />Page 13 of 15
(page number not for citation purposes)
the length of 3'-UTR, we used 19,079 non-redundant FL-
cDNA to determine the length distribution and found that
95% of these genes have UTR length shorter than 1280
bp, with an average size of 422 bp and a median of 295
bp. We therefore added five different lengths (100-, 200-,
300-, 400-, and 500-bp) to construct virtual UTRs for the
predicted genes. We finally built virtual tags from each of
the above-mentioned subsets by extracting a 10-bp tag
from the immediate downstream sequence of the last (3'-
most) NlaIII (CATG) site. We evaluated the success rates
of virtual tags that match the test set.
Virtual tags and tag-to-gene mapping
Since predicted genes do not have UTRs, we extracted con-
secutive exons together to form gene models from the two
genome assemblies and added to them either UTR
sequences based on information from known transcripts
or artificial UTRs in a length of 300 bp. We obtained four
groups of tag data, including those based on cDNA, Uni-
max, ESTmax, and predicted genes (P-300). We mapped
68,462 unique empirical tags from our data [21] to the
four groups of virtual tags after filtering cloning linkers,
vectors, and simple repeats. We excluded 47,867 tags from
further processing and their outcomes from our analysis
protocol were summarized (see Additional file 8). These
tags were regarded as unmapped tags although 45,025 of
them were actually mapped to the nuclear genome but in
unexpected range of correct positions of exon and UTR
sequences. Most of them were believed to fragmented
mRNAs that were co-processed during library construc-
tion procedures.
We annotated all our SAGE tags based on InterPro/Net-
work and KEGG for protein families, domains, and func-
tions. We chose the best scoring primary (sequence
similarity-based) annotations from family-type categories
first, followed by domain-type and others. If the gene had
no primary annotation then we used a network-based
annotation [52]. P values between copy numbers among
libraries were calculated based on Audic-Claverie (or AC)
statistics [28] by using IDEG6 software [53,54]. The signif-
icance of the differentially-expressed genes was defined
with P values less than 0.05 or 0.01. Ratios of up-regulated
and down-regulated genes were calculated according to
ratio = L/[(P+N)/2] (≥ 2) and [(P+N)/2]/L (<2), respec-
tively.
Microarray and QTL data
We used microarray data from the leaf tissue at the milky
stage, which were generated in our laboratory. The micro-
array contains 60,727 oligonucleotide probes represent-
ing all predicted genes from the genome sequence of 93-
11 [22]. We physically mapped the oligonucleotides to
the most up-to-date version of the genome assembly [48]
with the threshold that each oligonucleotide must match
to one unique gene with 90% or higher sequence identity.
We also used rice QTL data with physical position on
TIGR4 genome from Gramene [31]and mapped differen-
tially-expressed genes to nine QTL categories.
Abbreviations
PLE, Paternal-like expression; MLE, Maternal-like expres-
sion; SAGE, Serial analysis of gene expression; QTL,
Quantitative trait locus; nr-FL-cDNAs, non-redundant
full-length cDNAs
Competing interests
The author(s) declares that there are no competing inter-
ests.
Authors' contributions
SHS and HZQ conceived and carried out the study design,
performed the bioinformatics analysis, interpreted the
analysis results and drafted the manuscript. CC, SNH, and
JY participated in the study design and helped in revising
and editing the manuscript. All authors read and
approved the final manuscript.
Additional material
Additional file 1
Size distributions of UTR based on known FL-cDNAs for 5'-UTRs (A)
and 3'-UTRs (B). Using the known full-length cDNA sequences from
KOME database, we plotted the size distribution of UTRs to determine the
artificial UTR length.
Click here for file
[ />2229-7-49-S1.tiff]
Additional file 2
The details of differentially-expressed genes in panicle. We integrated
expression information, function annotation, and tag-mapping informa-
tion of panicle differentially-expressed genes in the excel tables.
Click here for file
[ />2229-7-49-S2.xls]
Additional file 3
The details of differentially-expressed genes in leaf. We integrated expres-
sion information, function annotation, and tag-mapping information of
leaf differentially-expressed genes in the excel tables.
Click here for file
[ />2229-7-49-S3.xls]
Additional file 4
The details of differentially-expressed genes in root. We integrated expres-
sion information, function annotation, and tag-mapping information of
root differentially-expressed genes in the excel tables.
Click here for file
[ />2229-7-49-S4.xls]
BMC Plant Biology 2007, 7:49 />Page 14 of 15
(page number not for citation purposes)
Acknowledgements
We are grateful to our microarray team members for providing the leaf
data and to Drs. Xiangjun Tian and Weihua Chen for critical reading of the
manuscript and many constructive discussions. This work received financial
support from Chinese Academy of Science (KSCX1-SW-03) and the Min-
istry of Science and Technology (2005AA235110) to JY.
References
1. Budak H: Understanding of Heterosis. KSU J Science and Engineer-
ing 2002, 5(2):69-75.
2. Xiao J, Li J, Yuan L, Tanksley SD: Dominance is the major genetic
basis of heterosis in rice as revealed by QTL analysis using
molecular markers. Genetics 1995, 140:745-754.
3. Yu SB, Li JX, Xu GC, Tan YF, Gao YJ, Li XH, Zhang QF, Maroof MAS:
Importance of epistasis as the genetic basis of heterosis in an
elite rice hybrid. Proc Natl Acad Sci USA 1997, 94:9226-9231.
4. Birchler JA, Auger DL, Riddle NC: In search of the molecular
basis of heterosis. Plant Cell 2003, 15(10):2236-2239.
5. Sun Q, Wu L, Ni Z, Meng F, Wang Z, Lin Z: Differential gene
expression patterns in leaves between hybrids and their
parental inbreds are correlated with heterosis in a wheat
diallel cross. Plant Science (Oxford) 2004, 166(3):651-657.
6. Yao Y, Ni Z, Zhang Y, Chen Y, Ding Y, Han Z, Liu Z, Sun Q: Identi-
fication of differentially expressed genes in leaf and root
between wheat hybrid and its parental inbreds using PCR-
based cDNA subtraction. Plant Mol Biol 2005, 58(3):367-384.
7. Wu LM, Ni ZF, Meng FR, Lin Z, Sun QX: Cloning and characteri-
zation of leaf cDNAs that are differentially expressed
between wheat hybrids and their parents. MGG Molecular
Genetics and Genomics 2003, 270(3):281-286.
8. Yao Y, Ni Z, Du J, Wang X, Wu H, Sun Q: Isolation and charac-
terization of 15 genes encoding ribosomal proteins in wheat
(Triticum aestivum L.). Plant Science (Oxford) 2006,
170(3):579-586.
9. Xiong LZ, Xu CG, Saghai Maroof MA, Zhang Q: Patterns of cyto-
sine methylation in an elite rice hybrid and its parental lines,
detected by a methylation-sensitive amplification polymor-
phism technique. Mol Gen Genet 1999, 261(3):439-446.
10. Ni Z, Sun Q, Liu Z, Wu L, Wang X: Identification of a hybrid-spe-
cific expressed gene encoding novel RNA-binding protein in
wheat seedling leaves using differential display of mRNA.
Mol Gen Genet 2000, 263(6):934-938.
11. Huang Y, Zhang L, Zhang J, Yuan D, Xu C, Li X, Zhou D, Wang S,
Zhang Q:
Heterosis and polymorphisms of gene expression in
an elite rice hybrid as revealed by a microarray analysis of
9198 unique ESTs. Plant Mol Biol 2006, 62(4–5):579-591.
12. Khattra J, Delaney AD, Zhao Y, Siddiqui A, Asano J, McDonald H, Pan-
doh P, Dhalla N, Prabhu AL, Ma K, Lee S, Ally A, Tam A, Sa D, Rogers
S, Charest D, Stott J, Zuyderduyn S, Varhol R, Eaves C, Jones S, Holt
R, Hirst M, Hoodless PA, Marra MA: Large-scale production of
SAGE libraries from microdissected tissues, flow-sorted
cells, and cell lines. Genome Res 2007, 17(1):108-116.
13. Wang SM: Understanding SAGE data. Trends Genet 2007,
23(1):42-50.
14. Chen J, Sun M, Lee S, Zhou G, Rowley JD, Wang SM: Identifying
novel transcripts and novel genes in the human genome by
using novel SAGE tags. Proc Natl Acad Sci USA 2002,
99(19):12257-12262.
15. Boon K, Osorio EC, Greenhut SF, Schaefer CF, Shoemaker J, Polyak
K, Morin PJ, Buetow KH, Strausberg RL, De Souza SJ, Riggins GJ: An
anatomy of normal and malignant gene expression. Proc Natl
Acad Sci USA 2002, 99(17):11287-11292.
16. Lee JY, Lee DH: Use of serial analysis of gene expression tech-
nology to reveal changes in gene expression in Arabidopsis
pollen undergoing cold stress. Plant Physiol 2003,
132(2):517-529.
17. Fizames C, Munos S, Cazettes C, Nacry P, Boucherez J, Gaymard F,
Piquemal D, Delorme V, Commes T, Doumas P, Cooke R, Marti J,
Sentenac H, Gojon A: The Arabidopsis root transcriptome by
serial analysis of gene expression. Gene identification using
the genome sequence. Plant Physiol 2004, 134(1):67-80.
18. Matsumura H, Nirasawa S, Terauchi R: Technical advance: tran-
script profiling in rice (Oryza sativa L.) seedlings using serial
analysis of gene expression (SAGE). Plant J 1999,
20(6):719-726.
19. Gibbings JG, Cook BP, Oufault MR, Madden SL, Khurie S, Tumbull CJ,
Dunwell JM: Globle transcript analysis of rice leaf and seed
using SAGE technology. Plant Biotechnology Journal 2003,
1:271-285.
20. Wang Q, Zhang QD, Jiang GM, Lu CM, Kuang TY, Wu S, Li CQ, Jiao
DM: Photosynthetic Characteristics of Two Superhigh-yield
Hybrid Rice. Acta Botanica Sinica 2000, 42(12):1285-1288.
21. Bao J, Lee S, Chen C, Zhang X, Zhang Y, Liu S, Clark T, Wang J, Cao
M, Yang H, Wang SM, Yu J: Serial analysis of gene expression
study of a hybrid rice strain (LYP9) and its parental cultivars.
Plant Physiol 2005, 138(3):1216-1231.
22. Yu J, Hu S, Wang J, Wong GK, Li S, Liu B, Deng Y, Dai L, Zhou Y,
Zhang X, Cao M, Liu J, Sun J, Tang J, Chen Y, Huang X, Lin W, Ye C,
Tong W, Cong L, Geng J, Han Y, Li L, Li W, Hu G, Huang X, Li W, Li
J, Liu Z, Li L, et al.: A draft sequence of the rice genome (Oryza
sativa L. ssp. indica). Science 2002, 296(5565):79-92.
23. Yu J, Wang J, Lin W, Li S, Li H, Zhou J, Ni P, Dong W, Hu S, Zeng C,
Zhang J, Zhang Y, Li R, Xu Z, Li S, Li X, Zheng H, Cong L, Lin L, Yin
J, Geng J, Li G, Shi J, Liu J, Lv H, Li J, Wang J, Deng Y, Ran L, Shi X, et
al.: The Genomes of Oryza sativa: a history of duplications.
PLoS Biol 2005, 3(2):e38.
24. Kikuchi S, Satoh K, Nagata T, Kawagashira N, Doi K, Kishimoto N,
Yazaki J, Ishikawa M, Yamada H, Ooka H, Hotta I, Kojima K, Namiki
T, Ohneda E, Yahagi W, Suzuki K, Li CJ, Ohtsuki K, Shishiki T, Otomo
Y, Murakami K, Iida Y, Sugano S, Fujimura T, Suzuki Y, Tsunoda Y,
Kurosaki T, Kodama T, Masuda H, Kobayashi M, et al.: Collection,
mapping, and annotation of over 28,000 cDNA clones from
japonica rice. Science 2003, 301(5631):376-379.
25. Wu J, Maehara T, Shimokawa T, Yamamoto S, Harada C, Takazaki Y,
Ono N, Mukai Y, Koike K, Yazaki J, Fujii F, Shomura A, Ando T, Kono
I, Waki K, Yamamoto K, Yano M, Matsumoto T, Sasaki T: A compre-
Additional file 5
Differentially-expressed tags (P < 0.05) that exhibit changes of >16 folds
and that were mapped to PA64s only but not plotted in Figure 3. Lists of
genes that do not reflected in Figure 2.
Click here for file
[ />2229-7-49-S5.xls]
Additional file 6
Genes involved in the light reaction. We categorized and listed the genes
involved in the light reaction.
Click here for file
[ />2229-7-49-S6.xls]
Additional file 7
Sterility and fertility-related differentially-expressed genes in panicle. By
comparing to the Gramene QTL database, the Sterility and fertility-
related differentially-expressed genes in panicle were listed.
Click here for file
[ />2229-7-49-S7.xls]
Additional file 8
The statistic result of the potential origin of SAGE tags that were not
mapped in this analysis. An example of the potential origin of SAGE tags
that were not mapped in this analysis was got by directly mapping tags to
genome sequences.
Click here for file
[ />2229-7-49-S8.xls]
Publish with Bio Med Central and every
scientist can read your work free of charge
"BioMed Central will be the most significant development for
disseminating the results of biomedical research in our lifetime."
Sir Paul Nurse, Cancer Research UK
Your research papers will be:
available free of charge to the entire biomedical community
peer reviewed and published immediately upon acceptance
cited in PubMed and archived on PubMed Central
yours — you keep the copyright
Submit your manuscript here:
/>BioMedcentral
BMC Plant Biology 2007, 7:49 />Page 15 of 15
(page number not for citation purposes)
hensive rice transcript map containing 6591 expressed
sequence tag sites. Plant Cell 2002, 14(3):525-535.
26. Tang J, Xia H, Li D, Cao M, Tao Y, Tong W, Zhang X, Hu S, Wang J,
Yu J, Yang H, Zhu L: Gene expression profiling in rice young
panicle and vegetative organs and identification of panicle-
specific genes through known gene functions. Mol Genet
Genomics 2005, 274(5):467-476.
27. Gene Expression Omnibus [ />]
28. Audic S, Claverie JM: The significance of digital gene expression
profiles. Genome Res 1997, 7(10):986-995.
29. Kyoto Encyclopedia of Genes and Genomes [http://
www.genome.jp/kegg/]
30. InterPro [ />]
31. Gramene [
]
32. Pleasance ED, Marra MA, Jones SJ: Assessment of SAGE in tran-
script identification. Genome Res 2003, 13(6A):1203-1215.
33. Graber JH, Cantor CR, Mohr SC, Smith TF: In silico detection of
control signals: mRNA 3'-end-processing sequences in
diverse species. Proc Natl Acad Sci USA 1999, 96(24):14055-14060.
34. Tsaftaris SA: Molecular aspects of heterosis in plants. Plant Phys-
iol 1995, 94:362-370.
35. Swanson-Wagner RA, Jia Y, DeCook R, Borsuk LA, Nettleton D,
Schnable PS: All possible modes of gene action are observed in
a global comparison of gene expression in a maize F1 hybrid
and its inbred parents. Proc Natl Acad Sci USA 2006,
103(18):6805-6810.
36. Meng F, Ni Z, Wu L, Sun Q: Differential gene expression
between cross-fertilized and self-fertilized kernels during the
early stages of seed development in maize. Plant Science 2005,
168:23-28.
37. Stupar RM, Springer NM: Cis-transcriptional variation in maize
inbred lines B73 and Mo17 leads to additive expression pat-
terns in the F1 hybrid. Genetics 2006, 173(4):2199-2210.
38. Song LQ, Fu TD, Tu JX, Ma CZ, Yang GS: Molecular validation of
multiple allele inheritance for dominant genic male sterility
gene in Brassica napus L. Theor Appl Genet 2006, 113(1):55-62.
39. Nagasawa N, Miyoshi M, Sano Y, Satoh H, Hirano H, Sakai H, Nagato
Y: SUPERWOMAN1 and DROOPING LEAF genes control
floral organ identity in rice. Development 2003, 130(4):705-718.
40. Kang HG, Jeon JS, Lee S, An G: Identification of class B and class
C floral organ identity genes from rice plants. Plant Mol Biol
1998, 38(6):1021-1029.
41. Haruta M, Constabel CP: Rapid alkalinization factors in poplar
cell cultures. Peptide isolation, cDNA cloning, and differen-
tial expression in leaves and methyl jasmonate-treated cells.
Plant Physiol 2003, 131(2):814-823.
42. Dai Y, Ni Z, Dai J, Zhao T, Sun Q: Isolation and expression anal-
ysis of genes encoding DNA methyltransferase in wheat
(Triticum aestivum L.).
Biochimica et Biophysica Acta 2005,
1729(2):118-125.
43. Hollick JB, Patterson GI, Asmundsson IM, Chandler VL: Paramuta-
tion alters regulatory control of the maize pl locus. Genetics
2000, 154(4):1827-1838.
44. Maxon ME, Goodrich JA, Tjian R: Transcription factor IIE binds
preferentially to RNA polymerase IIa and recruits TFIIH: a
model for promoter clearance. Genes Dev 1994, 8(5):515-524.
45. Okamoto T, Yamamoto S, Watanabe Y, Ohta T, Hanaoka F, Roeder
RG, Ohkuma Y: Analysis of the role of TFIIE in transcriptional
regulation through structure-function studies of the TFIIE-
beta subunit. J Biol Chem 1998, 273(31):19866-19876.
46. Zhang Z, Gu J, Gu X: How much expression divergence after
yeast gene duplication could be explained by regulatory
motif evolution? Trends Genet 2004, 20(9):403-407.
47. Adams KL, Wendel JF: Novel patterns of gene expression in
polyploid plants. Trends Genet 2005, 21(10):539-543.
48. Rice Information System [ />index2.jsp]
49. Knowledge-based Oryza Molecular biological Encyclopedia
[ />]
50. National Center for Biotechnology Information [http://
www.ncbi.nih.gov/]
51. Kent WJ: BLAT – the BLAST-like alignment tool. Genome Res
2002, 12(4):656-664.
52. McDermott J, Bumgarner R, Samudrala R: Functional annotation
from predicted protein interaction networks. Bioinformatics
2005, 21(15):3217-3226.
53. IDEG6 [ />]
54. Romualdi C, Bortoluzzi S, Danieli GA: Detecting differentially
expressed genes in multiple tag sampling experiments: com-
parative evaluation of statistical tests. Hum Mol Genet 2001,
10(19):2133-2141.