Conservation tillage impact on topsoil and deep soil aggregation and aggregate associated carbon fractions and microbial community composition in subtropical India: A review
Bạn đang xem bản rút gọn của tài liệu. Xem và tải ngay bản đầy đủ của tài liệu tại đây (1.62 MB, 20 trang )
Int.J.Curr.Microbiol.App.Sci (2019) 8(10): 283-302
International Journal of Current Microbiology and Applied Sciences
ISSN: 2319-7706 Volume 8 Number 10 (2019)
Journal homepage:
Review Article
/>
Conservation Tillage Impact on Topsoil and Deep Soil Aggregation and
Aggregate Associated Carbon Fractions and Microbial Community
Composition in Subtropical India: A Review
Rajendra Kumar1*, R. K. Naresh1, Robin Kumar2, S. K. Tomar3, Amit Kumar4,
M. Sharath Chandra1, Omkar Singh1, N. C. Mahajan5 and Reenu Kumar1
1
Department of Agronomy, Sardar Vallabhbhai Patel University of Agriculture & Technology,
Meerut, U.P., India
2
Department of Soil Science & Agriculture Chemistry, Narendra Dev University of
Agriculture & Technology, Kumarganj, Ayodhya, U.P., India
3
K.V.K.Belipur, Gorakhpur, Narendra Dev University of Agriculture & Technology,
Kumarganj, Ayodhya, U.P., India
4
Department of Agronomy, Chaudhary Charan Singh Haryana Agricultural University-Hisar,
Haryana, India
5
Department of Agronomy, Institute of Agricultural Science, Banaras Hindu University,
Varanasi, U. P., India
*Corresponding author
ABSTRACT
Keywords
Tillage system, Soil
organic carbon,
Microbial biomass,
Soil aggregation
Article Info
Accepted:
04 September 2019
Available Online:
10 October 2019
Soil macro-aggregate turnover and micro-aggregate formation: A mechanism for C sequestration under notillage agriculture had its genesis in attempts to identify and isolate soil organic matter (SOM) fractions
that reflect the impacts of climate, soil physiochemical properties and physical disturbance on the soil
organic carbon balance. Soil tillage can affect the formation and stability of soil aggregates. The disruption
of soil structure weakens soil aggregates to be susceptible to the external forces of water, wind, and traffic
instantaneously, and over time. The application of chemical fertilizers (NP) alone did not alter labile C
fractions, soil microbial communities and SOC mineralization rate from those observed in the CK
treatment. Whereas the use of straw in conjunction with chemical fertilizers (NPS) became an additional
labile substrate supply that decreased C limitation, stimulated growth of all PLFA-related microbial
communities, and resulted in 53% higher cumulative mineralization of C compared to that of CK. The
SOC and its labile fractions explained 78.7% of the variance of microbial community structure. The degree
of soil disturbance and the use of crop residues influence the availability of organic compounds and
minerals for the soil biota. This conglomerate of elements can affect population, diversity and activity of
the different soil organisms. Besides, soil communities also have an impact on soil physical and chemical
conditions. From macro-fauna to micro-fauna, all parts interact and therefore play a role in nutrient cycling
and organic matter decomposition. Soil microbial community compositions were changed with straw
return. Crop straw return significantly increased total phospholipid fatty acid (PLFA), bacterial biomass
and actinomycete biomass by 52, 75 and 56% but had no significant effects on PLFAs as compared to N
treatment. MBC and TOC were the two main factors affecting microbial communities under short-term
crop straw return. The labile part of organic carbon has been suggested as a sensitive indicator of changes
in soil organic matter. Conservation tillage (NT and S) increased microbial metabolic activities and
microbial index in >0.25 and <0.25 mm aggregates in the 0−5 cm soil layer.
283
Int.J.Curr.Microbiol.App.Sci (2019) 8(10): 283-302
Introduction
Soil is considered the `skin' of the earth
(Oades, 1984) with soil organic carbon (SOC)
as the protein that protects the `skin' (Dou et
al., 2011). SOC is a key indicator of soil
quality (Bronick and Lal, 2005) is the basis of
soil fertility and function (Huang et al., 2012)
and is important for cementing substances as
part of the formation of soil aggregates. SOC
affects the number and distribution of
differently sized soil aggregates (Zheng et al.,
2011). Soil aggregates are the basic `cells' of
the soil structure and play an important role in
improving soil carbon sequestration and
fertility (Zhou et al., 2009). Stable soil
aggregates not only reduce soil erosion
induced SOC loss, but also inhibit microbial
and enzymatic decomposition of SOC through
coating and isolation effects Humberto and
Rattan, 2004; Six et al., 2000). Physical
fraction is widely used to study the storage
and turnover of soil organic matter (SOC),
because it incorporates three levels of analysis
by examining three sizes of aggregate.
Previous studies have demonstrated that the
interaction between soil structure and
aggregates determines the quality of the SOC
pool. SOC is primarily distributed in waterstable aggregates of larger sizes (> 1mm) and
SOC content increases with aggregate
diameter (Six et al., 1998; Liu et al., 2009).
The combined application of chemical
fertilizer and straw greatly improves SOC
accumulation in water-stable aggregates of
this size (Zhou and Pan, 2007).
Intensive soil tillage initiates a cascade of
events that has been shown to both benefit and
impair agricultural productivity.Net losses in
soil fertility and soil integrity have led to the
development of alternative management
strategies that control problems associated
with intensive tillage while affording
acceptable conditions of seedbed preparation,
fertility, and weed control. No-tillage with a
large addition of plant biomass to the soil
enhances SOC storage. This constitutes an
effective way to restore SOC over time (Hok
et al., 2015). The SOC may be vertically
distributed in deeper soil layers in long-term
conservation agriculture in response to high
biomass-C inputs from deep-rooting cover
crops. Tilling can play an important role in
increasing crop yield, thereby improving food
security worldwide by making crop growth
more successful and controlling competition
by weeds (Lal, 2009). However, many studies
have demonstrated that intensive tillage
deteriorates soil structure and enhance soil
erosion
(Kladivko,
2001).
Specially,
mouldboard ploughing may damage the pore
continuity and aggregate stability resulting in
sediment mobilization, erosion, and surface
hardening (Hamza and Anderson, 2005). This
effect frequently exposes aggregates to
physical disruption (Al-Kaisi et al., 2014).
The resulting breaking of aggregates enhances
the accessibility of organic matter (OM) to
microorganisms, stimulating oxidation and
loss of organic matter (Liang et al., 2009).
Declines in organic matter are thus usually
accompanied by a decrease in the number of
water-stable aggregates (Six et al., 1999).
Under no tillage, crop residue decomposes at a
slower rate, leading to a gradual build-up and
increase in soil organic carbon (SOC).
Soil organic matter fractions are the most
sensitive way to detect changes in soil tillage
over time (Rosset et al., 2016). No-tillage
leads to greater carbon stability with a
predominance of the humin fraction. Soil
tillage and residue management affect the
input of organic residues into the soil and,
thus, its physicochemical properties, above all
aggregate stability (Guimarães et al., 2013).
Compared to NT, CT negatively affects soil
aggregate stability, which leads to an
increased susceptibility to slaking (Paul et al.,
2013) and soil erosion (Bertol et al., 2014).
The adoption of an NT system improves soil
284
Int.J.Curr.Microbiol.App.Sci (2019) 8(10): 283-302
aggregation and aggregate stability (Seben
Junior et al., 2014). Stable aggregation has
frequently been shown to reduce susceptibility
to formation of runoff and water erosion
(Bertol et al., 2014), depending on clay
mineralogy. In addition, fresh residue inputs
and active root growth led to more and
stronger organic cementing in 2:1 than in 1:1
clay minerals in soils (Denef and Six, 2005).
Soil
management
influences
soil
microorganisms and soil microbial processes
through changes in the quantity and quality of
plant residues entering the soil, their seasonal
and spatial distribution, the ratio between
above-and below-ground inputs, and changes
in nutrient inputs (Kandeler et al., 1999).
Changes in tillage, residue, and rotation
practices induce major shifts in the number
and composition of soil fauna and flora,
including both pests and beneficial organisms
(Andersen, 1999). Microbial communities
play an important role in nutrient cycling by
mineralizing and decomposing organic
material, which are released into the soil as
nutrients that are essential for plant growth.
These communities can influence nutrient
availability by solubilisation, chelation, and
oxidation/ reduction processes. In addition,
soil microorganisms may affect nutrient
uptake and plant growth by the release of
growth stimulating or inhibiting substances
that influence root physiology and root
architecture. It has been suggested that
microbial
inoculants
are
promising
components for integrated solutions to agroenvironmental problems because inoculants
possess the capacity to promote plant growth
(Compant et al., 2010) enhance nutrient
availability and uptake (Adesemoye and
Kloepper, 2009) and improve plant health. No
single agricultural practice is sufficient to
guarantee the quality of soils. However,
changes in microbial communities could be
used to predict the effects of soil quality by
different environmental and anthropogenic
factors. In addition, knowledge on soil
microbial processes will provide insight into
how agricultural practices such as tillage
systems can be better managed to increase soil
quality. In this review, we describe and
discuss the effects of different tillage practices
on microbial metabolic activities, organic C
fractions, and SOC to elucidate the
relationship better between soil microbial
metabolic diversity and SOC within
aggregates in subtropical India.
Soil aggregates are groups of soil particles that
bind to each other more strongly than to
adjacent particles. The spaces between
the aggregates provide pore space for retention
and exchange of air and water.
Soil microorganisms excrete substances that
act as cementing agents and bind soil particles
together. Fungi have filaments, called hyphae,
which extend into the soil and tie soil particles
together.
Roots
also
excrete
sugars into the soil that help bind minerals.
Oxides also act as glue and join particles
together.
Topsoil is composed of mineral particles,
organic matter, water, and air. Organic matter
varies in quantity on different soils. The
strength of soil structure decreases with the
presence of organic matter, creating weak
bearing capacities
Only 300 to 1,000 years are required to build
an inch of topsoil. The average depth of
topsoil is about eight inches, indicating an
earth less than about 8,000 years old.
Soil microorganisms exist in large numbers in
the soil as long as there is a carbon source for
energy.... Soils contain about 8 to 15 tons of
bacteria,
fungi,
protozoa,
nematodes,
earthworms, and arthropods. See fact sheets
on Roles of Soil Bacteria, Fungus, Protozoa,
and Nematodes
285
Int.J.Curr.Microbiol.App.Sci (2019) 8(10): 283-302
Microbial
communities are
groups
of
microorganisms that share a common living
space. The microbial populations that form
the community can interact in different ways,
for example as predators and prey or as
symbionts.
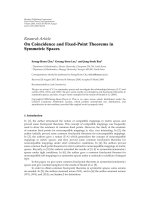
Fraction scheme to isolate aggregate and
aggregate-associated soil organic carbon
(SOC) fractions LF = light fraction; HF
=heavy fraction; MOM = mineral-associated
organic matter; cPOM = coarse particulate
organic matter (POM); fPOM = fine POM;
HMP = hexa-meta-phosphate; imMPOM =
intra-micro-aggregate POM within macroaggregate;
imMMOM
=
intra-microaggregates MOM within macro-aggregate;
imPOM = intra-micro-aggregate POM;
imMOM = intra-micro-aggregate MOM
[Source: Cheng-Hua et al., 2014]
Song et al., (2016) reported that as compared
to conventional tillage, the percentages of >2
mm macroaggregates and water-stable
macroaggregates
in
rice-wheat
doubleconservation tillage (zero-tillage and
straw incorporation) were increased 17.22%
and 36.38% in the 0–15 cm soil layer and
28.93% and 66.34% in the 15–30 cm soil
layer, respectively. Zero tillage and straw
incorporation also increased the mean weight
diameter and stability of the soil aggregates
[Fig. 1 a & 1b]. In surface soil (0–15 cm), the
maximum proportion of total aggregated
carbon was retained with 0.25–0.106 mm
aggregates,
and
rice-wheat
doubleconservation tillage had the greatest ability to
hold the organic carbon (33.64 g kg−1).
However, different forms occurred at higher
levels in the 15–30 cm soil layer under the
conventional tillage [Fig.1c].
Fang et al., (2015) revealed that the
cumulative carbon mineralization (Cmin,
mgCO2-C kg-1 soil) varied with aggregate size
in BF and CF top-soils, and in deep soil, it was
higher in larger aggregates than in smaller
aggregates in BF, but not CF [Fig.2a]. The
percentage of soil OC mineralized (SOCmin, %
SOC) was in general higher in larger
aggregates than in smaller aggregates.
Meanwhile, SOCmin was greater in CF than in
BF at topsoil and deep soil aggregates. In
comparison to topsoil, deep soil aggregates
generally exhibited a lower Cmin, and higher
SOCmin [Fig.2b]. However, deep soil may be
more readily decomposed in CF than in BF,
potentially as a result of a higher dead fine
root biomass, since fresh carbon may
accelerate soil OC decomposition (Fontaine et
al., 2007). To sum up, organic matter
decomposition and OC transportation from
topsoil to deep soil might be the dominant
processes influencing deep soil OC in these
soils. von Lützow et al., (2007) reported that
the turnover time of OC in macro-aggregates
and micro-aggregates were 15–50 years and as
long as 100–300 years using 13C natural
abundance method, respectively, which
indicates that micro-aggregates are more
effective for decreasing OC mineralization
relative to macro-aggregates. Moreover, acid
hydrolysis process in soil was considered to
remove easily decomposable protein and
polysaccharide material leaving behind
chemical recalcitrant structures which may be
able to isolate deeper soil C with long-term
stability due to the evidence that the C isolated
by acid hydrolysis from deeper soil was
several hundred or thousand years older than
bulk soil. The reforestation tree species
appeared to be an important determinant of
OC stability through the influence on soil
nutrient and its stoichiometric ratio [30] and
BF might be more efficient in OC
conservation than CF at the sites we studied
[Fig.2c] and deep soils may have lower OC
stability than topsoil.
Zhang-liu et al., (2013) showed that NT and
RT treatments significantly increased the
proportion of macro-aggregate fractions
286
Int.J.Curr.Microbiol.App.Sci (2019) 8(10): 283-302
(>2000 µm and 250-2000 µm) compared with
the MP-R and MP+R treatments [Fig.3a]. For
the 0-5cm depth, the total amount of macroaggregate fractions (>250µm) was increased
by 65% in NT and 32% in RT relative to the
MP+R. Averaged across all depths, the macroaggregate fraction followed the order of NT
(0.39) > RT (0.30) > MP+R (0.25)=MP–R
(0.24). Accordingly, the proportion of microaggregate fraction (53-250 µm) was increased
with the intensity of soil disturbance [Fig.3a].
In the 0-5 and 5-10cm depths, NT and RT had
significantly higher total soil C concentration
than that of MP−Rand MP+R in all aggregate
size fractions [Fig.3b].However, in the 1020cm depth, conservation tillage system
reduced total C concentration in the macroaggregate fraction (>250µm) but not in the
micro-aggregate and silt plus clay fractions.
The greatest change in aggregate C appeared
in the large macro-aggregate fractions where
aggregate-associated
C
concentration
decreased with depth [Fig.3b]. In the 0-5cm
depth, the >2000µm fraction had the largest C
concentration under NT, whereas the <53µm
fraction had the lowest C concentration under
the MP−R treatment. Similar trend was also
observed in the > 2000µm and 25-2000µm
fractions (23 vs. 24 g C kg-1aggregates) in the
5-10cm depth. The large macro-aggregate
(>2000µm)
had
relatively lower
C
concentration than that in the >250-2000µm
fraction in the 10-20cm depth. Averaged
across soil depths, all aggregate size fractions
had 6-9% higher total soil C concentration in
NT and RT than in MP−R and MP+R, except
for the 53-250 µm fraction. Again mouldboard plough showed slightly higher soil C
concentration than the conservation tillage
systems in the 53-250µm fraction [Fig.3b].
Tillage systems also affected the distribution
of total C stocks across the aggregate fractions
[Fig.3c]. In the 0-5 and 5-10cm depths, total
soil C stocks within the >2000 and 250-2000
µm fractions followed the order of NT > RT >
MP+R=MP-R. Considering the >2000µm
fraction in the 0-5 cm depth, soil C stocks
were 155%and 79%higher in NT and RT than
that in the MP treatments. Across the
aggregate fractions, in the 0-5cm depth, the
small macro-aggregate under NT had 21% and
171%moretotal C than RT and MP,
respectively. Similar results were observed in
the 5-10cm depth. Total C stored in macroaggregates (>250 µm) was 73% higher in RT
and 33% higher in NT compared to the
average across both MP treatments. In the 1020cm depth, soil C stored in the >2000, and
250-2000µm fractions did not differ among
the RT, NT and MP+R treatments [Fig.3c].
The largest C stock occurred in the 53-250µm
fraction, following the order of MP+R > RT >
MP-R > NT [Fig.3c].
Ravindran and Yang, (2015) also found that
the Cmic and Nmic were highest in the surface
soil and declined with the soil depth. These
were also highest in spruce soils, followed by
in hemlock soils, and were lowest in grassland
soils. The organic layer had the highest Cmic
and Nmic, and the values decreased
significantly with soil depth. The maximal
Cmic and Nmic were obtained in the spring
season and the minimal values in the winter
season. The Cmic/Corg, Nmic/Ntot, and Cmic/Nmic
ratios increased with soil depth [Fig.4a]. The
higher Cmic and Nmic in the surface soil than in
the deeper layers were due to their positive
correlations with organic matter content and
oxygen availability (Idol et al., 2002). Cmic
and Nmic had significantly positive correlations
with total organic carbon (Corg) and Ntot.
Contributions of Cmic and Nmic, respectively, to
Corg and Ntot indicated that the microbial
biomass was immobilized more in spruce and
hemlock soils than in grassland soils [Fig.4b].
Microbial populations of the tested vegetation
types decreased with increasing soil depth.
Bacterial population was highest among the
microbial populations. The ratios of
cellulolytic microbes to totalmicrobial
287
Int.J.Curr.Microbiol.App.Sci (2019) 8(10): 283-302
populations in organic layers were high due to
the roles of carbon cycle. A high Cmic/Nmic
ratio indicates that the microbial biomass
contains a high proportion of fungi, whereas a
low value suggests that bacteria predominate
in the microbial populations (Joergensen et al.,
1995). Paul and Clark, (1996) reported that
bacterial dominant soil had a C/N ratio
between 3 and 5, whereas a C/N ratio between
10 and 15 indicated the dominancy of fungi.
In the present study, the Cmic/Nmic ratios of
spruce, hemlock, and grassland soils were
5.2e6.5, 4.8e6.6, and 4.1e5.6, respectively,
showing the dominancy of bacteria.
Al-Kaisi and Yin, (2005) revealed that macroaggregate stability as a function of time shows
a different trend for the same tillage systems
over time [Fig.4c]. However, stable micro and
macro-aggregate ranged as follows: greater in
NT, ST, and CP compared with MP and DR.
The percentage of stable microaggregates
observed between 12 and 240 minutes for
tillage treatments was in the following order:
NT > ST > CP > DR > MP. The higher
percentage of stable micro-aggregates
observed in the NT and ST treatments
compared with CP and DP is consistent with
the findings of Ouattara et al., (2008), where
macro-aggregate stability with reduced tillage
was 87% and 26% higher in sandy loam soils.
Meenakshi (2016) revealed that under
conventional tillage, the organic carbon
content in the surface 0-15 cm soil depth was
0.44, 0.51 and 0.60 % which was increased to
0.60, 0.62 and 0.70 % under zero tillage
practice in sandy loam, loam and clay loam
soil [Fig.5a]. In all the three soils, the organic
carbon decreased significantly with depth
under both the tillage practices. Under
conventional tillage, the amount of organic
carbon observed in 0-15 cm found to decrease
abruptly in 15-30 cm soil depth as compared
to the decrease under zero tillage practice in
all the soils. Long term ZT practice in wheat
increased the organic carbon content
significantly as compared to CT in different
depths of all the soils. As expected, the higher
amount of organic carbon was observed in
relatively heavier textured soil viz. clay loam
> loam > sandy loam at both the depths
[Fig.5a].
Moreover, under conventional tillage, the light
fraction carbon, in the surface 0-15 cm soil
depth was 0.29, 0.49 and 0.58 g/kg which
increased to 0.43, 0.62 and 1.01 g/kg under
zero tillage practice
in sandy loam, loam and clay loam soil
[Fig.5b]. The heavy fraction carbon in the
surface 0-15 cm soil layer was 3.8, 4.2 and 4.9
g/kg which decreased to 2.0, 2.2 and 2.6 g/kg
in 15-30 cm soil layer in sandy loam, loam
and clay loam, respectively. The heavy
fraction carbon was highest in the surface
layer in all the three soils and decreased with
depth under both tillage treatments. The zero
tillage resulted in an increase in heavy fraction
carbon at both the depth. In the surface 0-15
cm, it increased the heavy fraction carbon
significantly from 3.8 to 4.9, 4.2 to 4.9 and 4.9
to 5.1 g/kg and in 15-30 cm soil depth from
2.0 to 2.9, 2.2 to 3.4 and 2.6 to 3.9 g/kg in
sandy loam, loam and clay loam [Fig.5b].
Relatively higher amount of heavy fraction
carbon was observed in heavier textured soil
at both the depths. Liang et al., (1998)
reported that ratios of LF of C and SOC were
greater in light-textured soils than in finetextured soils. LF of C is directly proportional
to sand content. The lower disturbance in ZT
systems can promote the interaction between
clays and slower decomposing C inputs to
form soil aggregates. But the DOC content
was lowest among all fractions followed by
MBC and LFC, and highest amount was of
HFC in case of all the three texturally different
soils at both 0-15 and 15-30 cm soil depths
[Fig.5b]. The higher amounts of different
fractions were observed in relatively heavier
288
Int.J.Curr.Microbiol.App.Sci (2019) 8(10): 283-302
textured soil, and under ZT treatment as
compared to CT.
Al-Kaisi and Yin, (2005) reported that the
continuous decline in SOC content with
increase tillage intensity at the top 15 cm (6
in) depth ranked as follows with NT showing
the highest SOC content followed by CP, ST,
DR, and MP [Fig.5c]. SOC content, especially
in conventionally tilled soils, resulted in less
stable aggregates compared with that for NT
soils. However, the only significant increase in
SOC content at the top 15 cm (6 in) was
observed with NT as compared to the baseline,
but STN content was significantly greater than
that for the baseline for all tillage systems
[Fig.5c]. Soil tillage manipulates soil nutrient
storage and release with rapid mineralization
of SOM and the potential loss of SOC and
STN from the soil (Chivenge, 2007). These
changes in the short term can be insignificant,
yet SOC content for NT soil aggregates
increased over time, consistent with the
findings of Sainju et al., (2008). Stable macroaggregates are enriched in new SOC compared
with unstable macro-aggregates (Gale et al.,
2000), especially in relatively undisturbed
systems like NT, where new root-derived
intra-aggregate particulate organic matter is
important in stabilizing small macroaggregates.
Xin et al., (2015) revealed that the tillage
treatments significantly influenced soil
aggregate stability and OC distribution.
Higher MWD and GMD were observed in
2TS, 4TS and NTS as compared to T. With
increasing soil depth, the amount of macroaggregates and MWD and GMD values were
increased, while the proportions of microaggregates and the silt + clay fraction were
declined [Fig. 6 a & 6b].
Accordingly, the average proportions of
micro-aggregates and the silt + clay fraction
were reduced by 15 and 23%, respectively. In
the 5–10 cm depth, the mass proportions of
macro-aggregates of 2TS, 4TS and NTS were
increased by 12, 11 and 13%, respectively, but
there were no significant differences between
T and TS. In the 10–20 cm depth, the
proportions of macro-aggregates in 4TS and
NTS were increased by 8% compared to 4T
and NT. Across all soil depths, 2TS, 4TS and
NTS had greater proportions of macroaggregates than T, and this trend was declined
with soil depth [Fig.6a]. In the 0–5 cm layer,
compared with T, values of MWD under 4T
and NT were increased by 41 and 68%,
respectively. Values of MWD under NT in the
5–10 and 10–20 cm depths were increased by
41 and 28% as compared to that under T. The
highest GMD value appeared in NTS, while
the lowest appeared in T across all soil depths.
Additionally,
residue
retention
had
pronounced positive effects on MWD and
GMD. The average MWD values among crop
residue treatments were 30, 15 and 14%
higher than the corresponding treatments
without crop residues in the 0–5, 5–10, and
10–20 cm depths [Fig.6b].
The OC concentrations in different aggregate
fractions at all soil depths followed the order
of macro-aggregates>micro-aggregates>silt +
clay fraction. In the 0–5 cm soil layer,
concentrations of macro-aggregate associated
OC in 2TS, 4TS and NTS were 14, 56 and
83% higher than for T, whereas T had the
greatest concentration of OC associated with
the silt + clay fraction in the 10–20 cm layer.
Soil OC concentrations under 4TS and NTS
were significantly higher than that of T in the
0–10 cm layer. Residue retention promoted
formation of macro-aggregates, increased
macro-aggregate-associated
OC
concentrations and thus increased total soil
OC stock [Fig.6c]. In the 0–5, 5–10 and 10–20
cm depths, treatments with crop residues had
higher
macro-aggregate-associated
OC
concentrations compared to treatments without
residues. In the 0–5 cm depth, comparing with
289
Int.J.Curr.Microbiol.App.Sci (2019) 8(10): 283-302
that of T, macro-aggregate- associated OC
concentrations under 2TS, 4TS and NTS were
increased by 14, 56 and 83%, respectively.
The greatest increase of micro-aggregateassociated
OC
concentration
among
treatments with residue retention was in the 0–
5 cm, where OC under 4TS and NTS were 34
and 11% higher compared to that of 4T and
NT, respectively. However, in the 10–20 cm,
residue retention reduced OC concentration by
42% in the silt + clay fraction [Fig.6c].
Wang et al., (2018) reported that straw
amendments at 1–5% increased the relative
abundance of Firmicutes from 41% in control
to 54–77%, while decreased the abundances of
other bacterial communities. For example,
relative abundance of Proteobacteria at day 15
decreased from 18% to 7.2–13% in soil.
Similarly, straw amendments at 1–5%
increased the abundance of Firmicutes from
28% to 60–71%, while decreased the
abundances of other bacterial communities
(e.g., Proteobacteria, 18% to 11–13%). The
increases in the abundance of Firmicutes in
both soils with straw amendments were also
observed at days 30 and 60. However, at day
60, the difference in the abundance of
Firmicutes between straw application rates 1–
5% was insignificant [Fig.7a].
Six and Paustian, (2014) reported that the
better assessments of aggregate stability must
rely on the measurement of different aggregate
distributions due to different levels of energy
imposed on the soil and can be related to
different soil processes [Fig.7b]. Nonetheless,
with the “viewing” techniques, we can focus
on the soil morphology and moreover, it is the
ideal method to study the small-scale
biogeography of microorganisms, e.g., what
does the local microhabitat for bacteria and
fungi look like? And the inherent small-scale
soil variability can be assessed [Fig.7b]. The
micro-aggregate-withinmacro-aggregate
fraction as a diagnostic for SOM changes
induced by management across many soil
types and climate regimes. However, there are
still many soil types and environments that
need to be considered before we can state with
full confidence that the micro-aggregate
within- macro-aggregate fraction is a highly
accurate and broadly applicable diagnostic
measure for total SOC changes in response to
changes in management practices in terrestrial
ecosystems. However, if the micro-aggregatewithin-macro-aggregate fraction is found to be
truly diagnostic across most soil types and
environments, it would be of enormous
significance and lead to a rapid and better
understanding of how management impacts
SOM dynamics and C sequestration in the
terrestrial biosphere.
Li et al., (2018) observed that the effects of
fertilization on soil labile organic C showed a
similar trend to total SOC. The contents of
DOC, LFOC, and MBC were respectively
264%, 108%, and 102% higher after NPSM
application, and respectively 57%, 82% and
38% higher after NPS application than
compared with those of CK [Fig.7c]. The C/N
ratio of bulk soil was constant across all
fertilization treatments, but C/N ratio of labile
organic C factions had differential responses
to the different treatments [Fig.7c].Ratios of
DOC/DON and LFOC/LFN were lower in
treatments with additions of exogenous
organic amendment and chemical fertilizers
than in the control.
Li et al., (2018) also found that the NPSM and
NPS fertilization treatments had significantly
greater abundances of all microbial groups
considered (i.e. G+, G-, actinomycetes,
saprophytic fungi and AMF), however, we
found no further increases from NPS to NPSM
[Fig.8a]. Compared with CK, NPSM and NPS
treatments caused greater measures of G+ and
G- biomarkers by 107±160% and 106-110%,
and greater measures of actinomycetes by 6686%. The NPSM and NPS treatments were
290
Int.J.Curr.Microbiol.App.Sci (2019) 8(10): 283-302
also greater in abundances of fungal
communities, the saprophytic fungi were
greater by 123-135% and AMF was greater by
88-96%. The G+/G- ratio was higher under
NPSM treatment compared to other
treatments, indicating that NPSM fertilization
had changed soil microbial communities.
Kushwaha et al., (2000) revealed that the
amount of MBC ranged widely: CT-R 214264, CT+R 299-401, MT-R 241-295, MT‡R
368-503, ZT-R 243-317, and ZT‡R 283-343
µgg-1 dry soil [Fig.8b] suggesting significant
role of residue retention and tillage practices
on the levels of MBC in agro-ecosystems.
However, treatments, MBN ranged: CT-R
20.3-27.1, CT‡R 32.8-44.0, MT-R 23.7-31.2,
MT+R 38.2-59.7, ZT-R 24.1- 29.6, and ZT‡R
27.0-35.2 µgg-1 dry soil [Fig.8c]. The amount
of MBN increased significantly in the residue
retained plots compared to the residue
removed plots.
Residue retention increased (60% over
control) the level of MBN in conventional
tillage treatment (CT+R). The combined effect
of residue retention and minimum tillage
(MT+R) considerably increased (104% over
control) the level of soil MBN. However, the
surface application of retained residue with
zero tillage (ZT+R) increased the level of
MBN only by 29% over control. The effect of
tillage reduction alone (MT-R, ZT-R) on the
level of MBN was less marked (11-16%
increase over control). Singh and Singh (1993)
reported 77 and 84% increase in the levels of
MBN under straw + fertilizer and straw
treatments, respectively, in a rice based agroecosystems
Zang et al., (2017) observed that the
Miscanthus cultivation and the input of C4derived C strongly increased б13C values at all
depths relative to the reference grassland. The
б13C values increased with depth from -28.4 to
-24.8% in the grassland soil, but decreased
from -23 to -24% (9 years) and from -18 to 24% (21 years) under Miscanthus. The б13C
values increased strongly from 9 to 21 years
after Miscanthus planting, especially in the top
50 cm of soil [Fig.9a]. However, SOM
significantly increased by 30–80% from 9 to
21 years under Miscanthus at 0–10 and 30–60
cm depths [Fig.9a].
Down the soil profile, the SOM contents
declined gradually from the top 10 to 90–100
cm depth [Fig.9a]. The C stock is mainly
determined by the balance between new C
input and incorporation into SOM and the
decomposition of old C. This has been related
to the duration of land use change and to soil
depth (Felten & Emmerling, 2012; Ferrarini et
al., 2017a).
The variation of total SOM rates of change in
the first 5 years after planting Miscanthus was
very high, ranging from -4 to 7 mg C ha-1 yr-1
[Fig.9b]. A similar finding was reached
elsewhere for the first 2–3 years after
Miscanthus planting: -6.9 to 7.7 mg C ha-1 Yr-1
(Zimmerman et al., 2011).
The variation of annual SOM change
decreased with time and was negligible after
15 years [Fig.9b]. Miscanthus establishment in
the first few years is strongly affected by soil
properties and environmental conditions.
This causes changing patterns of C
partitioning within the plant and soil, and
influences the SOM content after land-use
conversion. Based on the contribution of
Miscanthus derived C to SOM at different
depths 9 and 21 years after land-use change,
we simulated the changes in C4- C proportions
with depth and time as a 3D figure [Fig.9c].
The proportion of C4-C in SOM reached about
80% in topsoil 20 years after the C3–C4
vegetation change. The incorporation of C4-C
in the topsoil was 16 times higher than in the
subsoil.
291
Int.J.Curr.Microbiol.App.Sci (2019) 8(10): 283-302
Zhang et al., (2019) showed that the
percentages of the remaining GM C in the soil
after one year of decomposition averaged 26%
and 33% for the above-ground and belowground residues [Fig.10a]. Thus, the 5-yr
growth of GM legumes continuously
significantly improved the SOC and easily
oxidized
organic
carbon
(EOOC)
concentrations, as well as the corresponding
stocks compared with the original soil at the
0–20 cm depth [Fig.10b].
The cumulative dry matter decomposition
rates for the roots of the summer legumes
followed the same order with the highest for
mung bean (69%), the lowest for soybean
(58%) and intermediate for Huai bean (68%).
The power model fitted well with the
cumulative dry matter decomposition patterns
of the GM legumes. The cumulative C
decomposition rates of the GM legumes were
the highest in the mung bean followed by the
Huai bean and finally the soybean, similar to
the pattern of dry matter decomposition.
The per-cent of the mass remaining in the
shoots and roots decreased to 23–29% (on
average 26%) and 28–43% (on average 33%)
of the original value in 374 days [Fig.10a].The
mean SOC contents under the SW, MW, and
HW systems were 10.5%, 12%, and 15.6%
greater (on average 12.7%) than those in the
FW system. As with the SOC, the mean
EOOC contents under the MW, SW, and HW
systems were 7.8%, 9.3%, and 15.3% greater
than those in the FW system. Compared with
the initial SOC and EOOC contents at the 0 to
20 cm depth in 2008, the continuous
application of the GM approach for 5-yr
significantly increased the corresponding
concentrations by 9.0% and 11.4% [Fig.10b].
The SOC stocks in the FW system ranged
from 14.6 to 21.6 Mg C/ha with an average of
19.1 Mg C/ha and a CV of 8.2%, while in the
GM systems, it ranged from 14.8 to 24.1 Mg
C/ha, with an average of 20.1 Mg C/ha and a
CV of 8.3%. The mean EOOC stock in the
GM systems (10.8 Mg C/ ha) was 3.5%
greater than that in the FW (10.5 Mg C/ha)
with a wider range (9.0- 4.0 Mg C/ha) and a
higher variability (9.5%) [Fig.10b]. The
growth of the GM legumes not only efficiently
affected the SOC fractions due primarily to
the increased C supply but also increased the
C concentration in the easily oxidized organic
matter (EOOM) residues or the EOOM-C as a
proportion of the total C in the soil
(Thomazini et al., 2015).
The higher EOOC in the GM systems was
probably related to the greater inputs of
legume residue and consequently the higher
proportion of readily metabolized organic
materials, such as sugars, amino acids, and
organic acid molecules (Tian et al., 2011).
The SOC stocks measured ranged from 16.9 to
24.1 Mg C/ha under the GM and FW systems
in the 0 to 20 cm soil depth in 2013 and were
significantly correlated with the mean annual
C input by the crops [Fig.10c].
The mean turnover time of the SOC at
equilibrium was estimated to be 22 years,
indicating that the loess soil was not C
saturated and still had the potential for C
sequestration. In general, Huai bean
performed better on biomass production, C
accumulation, and soil C sequestration than
mung bean and soybean during the 5-yr period
[Fig.10c].
Soil microbial biomass, the active fraction of
soil organic matter which plays a central role
in the flow of C and N in ecosystems responds
rapidly to management practices, and serves
as an index of soil fertility.
Adoption
of
conservation
agriculture
ultimately resulted in increased soil microbial
diversity and activity in the various cropping
292
Int.J.Curr.Microbiol.App.Sci (2019) 8(10): 283-302
systems more under no-till, than under
conventional tillage. However, micro-
aggregates are less influenced by type of
tillage system.
Fig.1(a) Mean weight diameter (MWD) of soil aggregates [Source: Song et al., 2016]
Fig.1(b) Soil aggregate stability (AS) [Source: Song et al., 2016]
Fig.1(c) Influence of treatments on the carbon preservation capacity of different soil aggregates
(0-15 and 15–30 cm) [Source: Song et al., 2016]
(a)
(b)
(c)
293
Int.J.Curr.Microbiol.App.Sci (2019) 8(10): 283-302
Fig.2(a) The organic carbon concentration and mineralization of aggregate soil within 71 days
at various soil depths in two restored plantations [Source: Fang et al., 2015]
Fig.2(b) The weighted mean of soil organic carbon mineralized percentage in various aggregates
vary with incubation days in two soil depths under two restored plantations [Source: Fang et al.,
2015]
Fig.2(c) OC stability influenced by nutrient concentration and aggregate composition in two
restored plantations [Source: Fang et al., 2015]
(a)
(b)
(c)
Fig.3(a) Waterstable aggregatesize distributionin 0-5, 5-10, and 10-20cm soil depths as 1
influenced by tillage treatments(MP−R, moldboard plow without corn residue; MP+R,
moldboard plow with corn residue; RT, rotary tillage with corn residue; NT, no-till with corn
residue) [Source: Zhang-liu et al., 2013]
Fig.3(b) Sand-free aggregate total C concentrationin0-5, 5-10, and 10-20 cmsoil depthsas 9
influenced by tillage treatments [Source: Zhang-liu et al., 2013]
Fig.3(c) Total soil C stock within aggregate size fractions as influenced by tillage treatments
[Source: Zhang-liu et al., 2013]
(a)
(b)
(c)
294
Int.J.Curr.Microbiol.App.Sci (2019) 8(10): 283-302
Fig.4(a) Values of Cmic and Nmic of spruce, hemlock, and grassland soils: (A) Cmic, (B) Nmic, (C)
Cmic/Corg (D) Nmic/Ntot, and (E) Cmic/Nmic [Source: Ravindran and Yang, 2015]
Fig.4(b) Microbial populations (CFU/g dry soil) of spruce, hemlock, and grassland soils: (A)
bacteria, (B) actinomycetes, (C) fungi, (D) cellulolytic microbes, (E) phosphate-solubilizing
microbes, and (F) nitrogen-fixing microbes [Source: Ravindran and Yang, 2015]
Fig.4(c) Kinetics of wet soil (a) micro-aggregate and (b) macro-aggregates stability decay over
time at the top 15 cm of five tillage systems of a 10 year long-term tillage and crop rotation study
[Source: Al-Kaisi and Yin, 2005]
(a)
(b)
(c)
Fig.5(a) Soil organic carbon stock (Mg C ha-1) in 0-30 cm soil depth in different textured soil
under conventional (CT) and zero tillage (ZT) practices [Source: Meenakshi, 2016]; Fig. 5(b)
Different fractions of organic carbon (g/kg) at 0-15 and 15-30 cm soil depths under conventional
(CT) and zero (ZT) tillage practice in different textured soils [Source: Meenakshi, 2016]; Fig.
5(c) (a) Soil organic carbon and (b) soil total nitrogen at the top 15 cm with five tillage systems
of a 10 year long-term tillage and corn–soybean rotation. [Source: Al-Kaisi and Yin, 2005].
(a)
(b)
295
(c)
Int.J.Curr.Microbiol.App.Sci (2019) 8(10): 283-302
Fig. 6(a) Soil aggregate distribution in the 0-5 cm (A), 5-10 cm (B) and 10-20 cm (C) depths
under different tillage systems. TS, plowing once every year with residue; 2TS, plowing once
every two years with residue; 4TS, plowing once every four years with residue; NTS, no plowing
all years with residue; T, plowing once every year without residue; 2T, plowing once every two
years without residue; 4T, plowing once every four years without residue; NT, no plowing all
years without residue [Source: Xin et al., 2015]; Fig. 6(b) The values of MWD (A) and GMD
(B) of soil aggregates in the 0-5, 5-10 and 10-20 cm soil depths under different tillage systems.
MWD, mean weight diameter; GMD, geometric mean diameter [Source: Xin et al., 2015]; Fig.
6(c) OC (organic carbon) concentrations in aggregates of 0-5 (A), 5-10 (B) and 10-20 cm (C)
soil layers under different tillage systems [Source: Xin et al., 2015]
(a)
(b)
(c)
Fig.7(a) Class distribution of bacterial community compositions in soil samples collected at
0,15, 30 and 60 d during flooded incubation of two paddy soil [Source: Wang et al., 2018];
Fig.7(b) The relationship between different aggregate stability measures and soil functions
[Source: Six and Paustian, 2014]; Fig.7(c) Organic C contents and C/N ratios of bulk soil and
labile fractions under different fertilization regimes [Source: Li et al., 2018]
(a)
(b)
296
(c)
Int.J.Curr.Microbiol.App.Sci (2019) 8(10): 283-302
Fig.8(a) Abundance of microbial biomarker groups under different fertilization regimes [Source:
Li et al., 2018]; Fig.8(b) Responses of soil microbial biomass carbon (µgg-1) to different tillage
and residue manipulation treatments [Source: Kushwaha et al., 2000]; Fig.8(c) Responses of soil
microbial biomass nitrogen (µgg-1) to different tillage and residue manipulation treatments
[Source: Kushwaha et al., 2000]
(a)
(b)
(c)
Fig.9(a) Soil organic matter б13C values down the soil profile after 9 and 21 years of Miscanthus
cultivation [Source: Zang et al., 2017]
Fig.9(b) Total soil organic C and C4-C changes in topsoil [Source: Zang et al., 2017]
Fig.9(c) The contribution of Miscanthus (C4) derived C within 100 cm soil depth over 21 years
[Source: Zang et al., 2017]
(a)
(b)
297
(c)
Int.J.Curr.Microbiol.App.Sci (2019) 8(10): 283-302
Fig.10(a) The cumulative dry matter decomposition rates and carbon release rates of the three
GM legumes [Source: Zhang et al., 2019]
Fig.10(b) The SOC (a) and EOOC (b) concentrations, SOC (c) and EOOC (d) stocks in the 0 to
20 cm depth under the FW and GM systems [Source: Zhang et al., 2019]
Fig.10(c) Relationship between annual C inputs by the crops and the SOC stocks in the 0 to 20
cm depth under the GM and FW systems [Source: Zhang et al., 2019]
(a)
(b)
The increase in SOC content did not only
contribute to the increase in aggregate
stability, but it caused an increase in soil
moisture storage capacity. The value of these
findings is highly significant in documenting
the long-term stability of aggregate fractions
under continuous wet condition and the value
of adopting NT to mitigate weather changes
and volatility of rain intensities and durations.
The findings also demonstrate the negative
effect of conventional tillage not only on SOC
decline, but also the weakening of soil
aggregate formation and strength under
continuous wet conditions, which can lead to
other negative effects such as sediment loss
and water quality concerns.
The logical consequence is that the microaggregate-within-macro-aggregate
fraction
shows promising potential for early detection
of changes in soil C arising from changes in
management.
A greater percentage of C was found in all
aggregate size classes with the conservation
tillage treatments than CT at the 0- to 5-cm
(c)
depth.
At the 10– 15-cm depth, however, the highest
C percentages were found in aggregates from
the CT and RT treatments, again reflecting a
probable lower deposition of C due to the NT
treatment at the lower depth.
Highest levels of soil MBC and MBN (368503 and 38.2-59.7 µg g-1, respectively) were
obtained in minimum tillage residue retained
(MT‡R) treatment and lowest levels (214-264
and 20.3-27.1 µg g-1, respectively) in
conventional tillage residue removed (CT-R,
control) treatment. Along with residue
retention tillage reduction from conventional
to zero increased the levels of MBC and MBN
(36-82
and
29-104%
over
control,
respectively). The proportion of MBC and
MBN in soil organic C and total N contents
increased significantly in all treatments
compared to control.
This increase (28% in case of C and 33% N)
was maximum in MT‡R and minimum (10%
for C and N both) in minimum tillage residue
removed (MT-R) treatment. Tillage reduction
298
Int.J.Curr.Microbiol.App.Sci (2019) 8(10): 283-302
and residue retention both increased the
proportion of organic C and total N present in
soil organic matter as microbial biomass.
Microbial immobilization of available-N
during the early phase of crops and its pulsed
release later during the period of greater N
demand of crops enhanced the degree of
synchronization between crop demand and N
supply. The maximum enhancement effects
were recorded in the minimum tillage along
with residue retained treatment. Organic N
percentages in the aggregates were uniformly
greater in all aggregate size classes with the
conservation tillage treatments at the 0- to 5cm depth.
The effects of CA significantly increased
abundances of all PLFA-related microbial
communities including G+ bacteria, Gbacteria, actinomycetes, saprophytic fungi and
AMF. CA also slightly altered the
composition of microbial communities.
Furthermore, the application of CA resulted in
53%-85% greater cumulative mineralization
of C. Soil labile C fractions and soil microbial
communities predominantly determined the
variance in C mineralization in the current
agricultural system. This has to be carefully
taken into account when setting realistic and
effective goals for long-term soil C
stabilization.
References
Adesemoye, A.O.; and Kloepper, J.W.
2009.Plant–microbes interactions in
enhanced fertilizer-use efficiency.
Appl. Microbiol. Biotechnol. 85: 1–12.
Al-Kaisi MM, Douelle A, and Kwaw-Mensah
D. 2014. Soil micro-aggregate and
macro-aggegate decay over time and
soil carbon change as influenced by
different tillage systems. J Soil Water
Cons. 69(6):574-580.
Bertol I, Barbosa FT, Mafra AL, and Flores
MC. 2014. Soil water erosion under
different cultivation systems and
different fertilization rates and forms
over 10 years. Rev Bras Cienc Solo.
38:1918-28.
Bronick CJ, and Lal R. 2005. Soil structure
and management: a review. Geodema.
124:3-22.
Cheng-Hua, L., Yan, Y., and Qi, C. 2014.
Dynamics of Soil Organic Carbon
Fractions and Aggregates in Vegetable
Cropping Systems. Pedosphere 24(5):
605-612.
Chivenge, P.P., H.K. Murwira, K.E. Giller, P.
Mapfumo, and J. Six. 2007. Long-term
tillage and residue management on soil
carbon stabilization: Implications for
conservation agriculture on contrasting
soils. Soil Tillage Res. 94:328-337.
Compant, S.; Clément, C.; and Sessitsch, A.
2010. Plant growth-promoting bacteria
in the rhizo- and endosphere of plants:
Their role, colonization, mechanisms
involved and prospects for utilization.
Soil Biol. Biochem. 42:669–678.
Denef K, and Six J. 2005. Clay mineralogy
determines
the
importance
of
biological versus abiotic processes for
macro-aggregate
formation
and
stabilization. Eur J Soil Sci. 56: 469479.
Dou S, Li K, and Guan S. 2011. A review on
organic matter in soil aggregates. Acta
Pedologica Sinica. 48 (2):412-418
Fang X-M, Chen F-S, Wan S-Z, Yang Q-P,
Shi J-M. 2015. Topsoil and Deep Soil
Organic Carbon Concentration and
Stability Vary with Aggregate Size and
Vegetation Type in Subtropical China.
PLoS
ONE
10(9):
e0139380.
doi:10.1371/journal.pone.0139380
Felten D, and Emmerling C. 2012.
Accumulation of Miscanthus-derived
carbon in soils in relation to soil depth
and duration of land use under
299
Int.J.Curr.Microbiol.App.Sci (2019) 8(10): 283-302
commercial farming conditions. J.
Plant Nutri Soil Sci, 175: 661–670.
Ferrarini A, Fornasier F, Serra P, Ferrari F,
Trevisan M, and Amaducci S. 2017a.
Impacts of willow and miscanthus
bioenergy buffers on biogeochemical
N removal processes along the soilgroundwater
continuum.
GCB
Bioenergy, 9: 246–261.
Fontaine S, Barot S, Barre P, Bdioui N, Mary
B, Rumpel C. 2007.Stability of organic
carbon in deep soil layers controlled by
fresh carbon supply. Nature 450: 277–
281.
Gale, W.J., C.A. Cambardella, and T.B.
Bailey. 2000. Root derived carbon and
formation
and
stabilization
of
aggregates. Soil Sci Soc Am J. 64:201207.
Guimarães DV, Gonzaga MIS, Silva TO,
Silva TL, Dias NS, and Matias MIS.
2013. Soil organic matter pools and
carbon fractions in soil under different
land uses. Soil Tillage Res. 126:17782.
Hamza MA, and Anderson WK. 2005.Soil
compaction in cropping systems: a
review of the nature, causes, and
possible solutions. Soil Tillage Res
82:121-145.
Hok L, Sá JCM, Boulakia S, Reyes M, Leng
V, Kong R, Tivet FE, Briedis C,
Hartman D, Ferreira LA, Magno T,
and Pheav S. 2015. Short-term
conservation agriculture and biomassC input impacts on soil C dynamics in
a savanna ecosystem in Cambodia. Agr
Ecosyst Environ. 214:54-6
Huang DD, Liu SX, Zhang XP, Xu JP, Wu LJ,
and Lou YJ. 2012. Constitute and
organic carbon distribution of soil
aggregates under conservation tillage.
J Agro-Environ Sci. 31(8):1560-1565.
Humberto BC, and Rattan L. 2004.
Mechanism of carbon sequestration in
soil aggregates. Plant Sci 23(6):481-
504.
Idol TW, Pope PE, and Ponder F. 2002.
Changes in microbial nitrogen across a
100-year chronosequence of upland
hardwood forests. Soil Sci Soc Am J
66:1662-1668.
Joergensen RG, Anderson TH, and Wolters
T.1995.
Carbon
and
nitrogen
relationships in the microbial biomass
of soils in beech (Fagus sylvatica)
forests. Biol Fertil Soils19:141-147.
Kladivko EJ. 2001. Tillage systems and soil
ecology. Soil Tillage Res 61:61-76.
Kushwaha,C.P., Tripathi,S.K., and Singh, K.P.
2000. Variations in soil microbial
biomass and N availability due to
residue and tillage management in a
dry-land rice agro-ecosystem. Soil
Tillage Res. 56:153-166.
Lal L. 2009. Soil and world food security. Soil
Tillage Res 102:1-4.
Li J, Wu X, Gebremikael MT, Wu H, Cai D,
Wang B, et al., (2018) Response of
soil organic carbon fractions, microbial
community composition and carbon
mineralization to high- input fertilizer
practices
under
an
intensive
agricultural system. PLoS ONE 13(4):
e0195144.
Liang, B.C.; MacKenzie, A.F.; Schnitzer, M.;
Monreal, C.M.; Voroney, R.P. and
Beyaert, R.P. 1998. Managementinduced change in labile soil organic
matter under continuous corn in
eastern Canadian soils. Biol. Fertil.
Soils 26:88–94.
Liang AZ, Yang XM, Zhang XP, Shen Y, Shi
XH, Fan RQ, et al., 2009. Short-term
impacts of no-tillage on soil organic
carbon associated with water-stable
aggregates in Black Soil of Northeast
China. Scientia Agricultura Sinica.
42(8):2801-2808.
Liu XL, He YQ, Li CL, Jang CL, and Chen
PB. 2009. Distribution of soil waterstable aggregates and soil organic C, N
300
Int.J.Curr.Microbiol.App.Sci (2019) 8(10): 283-302
and P in upland red soil. Acta
Ecologica Sinica 46(2):255-262.
Oades JM. 1984. Soil organic matter and
structural stability: mechanisms and
implications for management. Plant
Soil.76:319±337.
Paul EA, Clark FE. Soil microbiology and
biochemistry.
2nd
ed.
London:
Academic; 1996. pp. 129-155.
Paul BK, Vanlauwe B, Ayuke F, Gassner A,
Hoogmoed M, Hurisso TT, Koala S,
Lelei D, Ndabamenye T, Six J,
Pulleman MM. 2013. Medium-term
impact of tillage and residue
management on soil aggregate
stability, soil carbon and crop
productivity. Agr Ecosyst Environ.
164:14-22.
Ouattara, K., B. Ouattara, G. Nyberg, M.P.
Sédogo, and A. Malmer. 2008. Effects
of ploughing frequency and compost
on soil aggregate stability in a cotton–
maize (Gossypium hirsutum-Zea mays)
rotation in Burkina Faso. Soil Use
Manag 24:19-28,
Ravindran, A., Yang, S.S. 2015. Effects of
vegetation type on microbial biomass
carbon and nitrogen in subalpine
mountain forest soils. J Microbiol
Immunol Infe. 48: 362-369
Sainju, U.M., J.D. Jabro, and W.B. Stevens.
2008. Soil carbon dioxide emission
and carbon sequestration as influenced
by irrigation, tillage, cropping system
and nitrogen fertilization. J Environ
Quality 37:98-106.
Seben Junior GF, Corá JE, and Lal R. 2014.
The effects of land use and soil
management on the physical properties
of an Oxisol in Southeast Brazil. Rev
Bras Cienc Solo. 38:1245-55.
Singh, H., and Singh, K.P. 1993. Effect of
residue placement and chemical
fertilizer on soil microbial biomass
under tropical dryland cultivation.
Biol. Fertil. Soils 16: 275-281.
Six J, Elliott ET, and Paustian K. 2000. Soil
macro-aggregate turnover and microaggregate formation: a mechanism for
C sequestration under no-tillage
agriculture. Soil Biol Biochem.
32:2099-2103.
Six J, Elliott EF, Paustian K, and Doran W.
1998. Aggregation and soil organic
matter accumulation in cultivated and
native grassland soils. Soil Sci. Soc.
Am. J. 62:1367-1377.
Six J, Elliot ET, and Paustian K. 1999.
Aggregate and soil organic matter
dynamics under conventional and notillage systems. Soil Sci. Soc. Am. J.
63:1350-1358.
Johan Six, J., and Paustian, K. 2014.
Aggregate-associated soil organic
matter as an ecosystem property and a
measurement tool. Soil Biol Biochem.
68:A4-A9.
Song, Ke., Yang, J., Xue, Y., Lv, W., Zheng,
X., and Pan, J. 2016. Influence of
tillage
practices
and
straw
incorporation on soil aggregates,
organic carbon, and crop yields in a
rice-wheat rotation system. Sci Rep.,
6:36602. DOI: 10.1038/srep36602
Thomazini, A., Mendonca, E.S., Souza, J.L.,
et al., 2015. Impact of organic no-till
vegetables systems on soil organic
matter in the Atlantic Forest biome.
Sci. Hortic. 182:145–155.
Tian, Y., Liu, J., Wang, X., et al., 2011.
Carbon mineralization in the soils
under different cover crops and residue
management in an intensive protected
vegetable cultivation. Sci. Hortic. 127:
198–206.
von Lützow M, Kögel-Knabner I, Ekschmitt
K, Flessa H, Guggenberger G, Matzner
E, et al., 2007. SOM fractionation
methods: relevance to functional pools
and to stabilization mechanisms. Soil
Biol Biochem 39: 2183–2207.
Wang, N., Yu, J.G., Zhao, Y.H., Chang, Z.Z.,
301
Int.J.Curr.Microbiol.App.Sci (2019) 8(10): 283-302
Shi, X.X., Lena Q. Ma, L.Q., and Li,
H.B. 2018. Straw enhanced CO2 and
CH4 but decreased N2O emissions
from flooded paddy soils: Changes in
microbial community compositions.
Atmos Environ. 174:171–179.
Wolschick, N.H., Barbosa,F.T., Bertol, I.B.,
Bagio, B., and Kaufmann, D.S. 2018.
Long-Term Effect of Soil Use and
Management on Organic Carbon and
Aggregate Stability. Rev Bras Cienc
Solo, 42:e0170393.
Xin, S., An-ning, Z., Jia-bao, Z., Wen-liang,
Y., Xiu-li, X., and Xian-feng, Z. 2015.
Changes in soil organic carbon and
aggregate stability after conversion to
conservation tillage for seven years in
the Huang-Huai-Hai Plain of China. J
Integr Agri. 14(6): 1202–1211.
Zang, H., Balgodatskaya, E., Wen, Y., Xu, X.,
Dyckmans, J., and Kuzyakov, Y. 2017.
Carbon sequestration and turnover in
soil under the energy crop Miscanthus:
repeated 13C natural abundance
approach and literature synthesis. GCB
Bioenergy doi: 10.1111/gcbb.12485
Zimmerman AR, Gao B, and Ahn MY. 2011.
Positive
and
negative
carbon
mineralization priming effects among a
variety of biochar-amended soils. Soil
Biol Biochem, 43: 1169–1179.
Zhang-liu, D.U., Tu-sheng,R., Chun-sheng,
H.U., Qing-zhong, Z., and Humberto,
B.C. 2013.
Soil Aggregate Stability and AggregateAssociated Carbon under Different
Tillage Systems in the North China
Plain.
J
Integ
Agri.
doi:
10.1016/S2095-3119(13)60428-1
Zhang, D., Yao, P., Zhao, Na., Cao, W.,
Zhang, S., Li, Y., Huang, D., Zhai, B.,
Wang, Z., and Gao, Y. 2019. Building
up the soil carbon pool via the
cultivation of green manure crops in
the Loess Plateau of China. Geoderma
337: 425–433.
Zheng ZC, Wang YD, Li TX, and Yang YM.
2011. Effect of abandoned cropland on
stability and distributions of organic
carbon in soil aggregates. J Nat
Resour. 26(1):119-127.
Zhou H, Lu YZ, and Li BG.2009.
Advancement in the study on
quantification of soil structure. Acta
Ecologica Sinica. 46(3): 501-506.
Zhou P, and Pan GX. 2007. Effect of different
long-term fertilization treatments on
particulate organic carbon in waterstable aggregates of Paddy Soil.
Chinese J Soil Sci. 38(2):256-261.
How to cite this article:
Rajendra Kumar, R. K. Naresh, Robin Kumar, S. K. Tomar, Amit Kumar, M. Sharath Chandra,
Omkar Singh, N. C. Mahajan and Reenu Kumar. 2019. Conservation Tillage Impact on Topsoil
and Deep Soil Aggregation and Aggregate Associated Carbon Fractions and Microbial
Community Composition in Subtropical India: A Review. Int.J.Curr.Microbiol.App.Sci. 8(10):
283-302. doi: />
302