Water requirement of sugarcane using CROPWAT 8.0 model: A case study of north India
Bạn đang xem bản rút gọn của tài liệu. Xem và tải ngay bản đầy đủ của tài liệu tại đây (263.68 KB, 8 trang )
Int.J.Curr.Microbiol.App.Sci (2019) 8(10): 1452-1459
International Journal of Current Microbiology and Applied Sciences
ISSN: 2319-7706 Volume 8 Number 10 (2019)
Journal homepage:
Original Research Article
/>
Water Requirement of Sugarcane Using CROPWAT 8.0 Model: A Case
Study of North India
Ramesh Verma* and R. M. Singh
Department of Farm Engg. I.Ag.Sc., Banaras Hindu University, Varanasi-221005, U.P, India
*Corresponding author
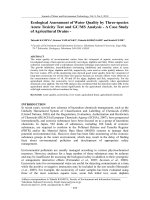
ABSTRACT
Keywords
CROPWAT model,
Crop water
requirement,
Effective rainfall
Article Info
Accepted:
12 September 2019
Available Online:
10 October 2019
The global consumption of water is doubling every 20 years, more than twice the rate
of human population growth. As per one of the estimate of Food and Agriculture
organization (FAO), 70-80 per cent of the increase in food demand between 2000 and
2030 will have to be met by irrigation. Efficient water use can increase crop diversity,
produce higher yields, enhance employment and lower food prices. Understanding
crop water requirements (CWR) is essential for better irrigation practices, scheduling
and efficient use of water, since the water supply through rainfall is limited and erratic
in nature. So it has become very important to define appropriate strategies for planning
and management of irrigated farm land. One of the major practices adopted by the
researchers for estimating water requirement of the crop is modelling. In this paper,
Sugarcane crop water requirement in Lakhimpur Kheri district of Uttar Pradesh are
forecasted, based on the meteorological data. For determination of crop evapotranspiration and yield responses to water in the agro-climatic district, CROPWAT 8.0
model is used, which was developed by the Land and Water Development Division of
Food Agricultural Organization (FAO). It includes a simple water balance model that
allows the simulation of crop water stress conditions and estimation of yield
reductions based on well-established methodologies.
Introduction
Severe water shortages are developing in
many countries particularly in India and water
for agriculture is becoming increasingly
scarce, in the light of growing water demands
from different sectors (IWMI 2010).
Agriculture is the largest (81%) consumer of
water in India and hence more efficient use of
water in agriculture needs to be top most
priority (Surendran et al., 2013). Water is an
essential input for crop production. Even
though the mean annual rainfall in the
Lakhimpur Kheri (UP, India) district is
1068.7mm, available water for crop is
becoming increasingly scarce throughout the
district. Lakhimpur Kheri (UP, India) district
is located in the state of Uttar Pradesh and lies
between 27.57N latitude and 80.46E
longitude. Aridity and drought are natural
1452
Int.J.Curr.Microbiol.App.Sci (2019) 8(10): 1452-1459
causes of scarcity. More recently however
man-made desertification and water shortages
have aggravated natural scarcity while at the
same time population is increasing and there is
increased competition for water among water
user sectors and regions. In addition, the
quality of water is often degraded, so that
water resource has become less and less
available. Thus, improved management and
planning of the water resources are needed to
ensure proper use and distribution of the water
among competing users. The accurate
planning and delivery of the necessary amount
of the water in the time and space can
conserve water. A scarce water resources and
growing competitions for water will reduce its
availability for irrigation. Achieving greater
efficiency of water use will be a primary
challenge for the near future and will include
the employment of techniques and practices
that deliver a more accurate supply of water to
crops. Prediction of the crop water
requirement is of vital importance in water
resources
management.
Crop
water
requirements are normally expressed by the
rate of evapotranspiration (ET) in mm day-1.
One of the major practices adopted by the
researchers for water requirement of crops is
modelling. For determination of crop
evapotranspiration and yield responses to
water, CROPWAT 8.0 model is used which
was developed by the FAO Land and Water
Development Division (FAO 1992). It also
includes a simple water balance model that
allows the simulation of crop water stress
conditions and estimation of yield reductions
based on well-established methodologies.
Several researchers have used the CROPWAT
8.0 model for analyzing crop water and
requirements in different parts of the world
(Kar and Verma, 2005; Martyniak et al., 2006;
Dechmi et al., 2003). The irrigation schedule
recommendations for various crops should be
location-specific, considering the soil types
and agro-ecological conditions. The scientific
crop water requirements are required for
efficient irrigation scheduling, water balance,
canal design capacities, regional drainage,
water resources planning, reservoir operation
studies, and to assess the potential for crop
production.
Materials and Methods
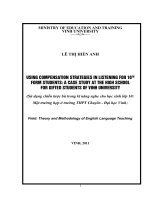
Study location
Lakhimpur Kheri district is located in the state
of Uttar Pradesh and lies between 27.57N
latitude and 80.46E longitude. The district has
an area of 7,680 km2. The normal rainfall of
this area is about1068.7 mm annually.
Whereas maximum temperature goes up to
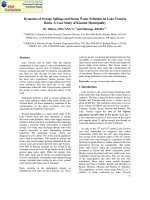
38.5 0C during summer. The location map of
Lakhimpur Kheri (UP,India) is also shown in
Figure 1 (Table 1 and 2)
Crop data
The major cultivated crops in study area are
Sugar cane is the main crop. The salient
details (i.e. crop coefficient, length of growing
stages, yield response factor and crop height
etc.) of crops considered for the study are as
per guidelines for estimating irrigation water
requirement, Ministry of Irrigation, Govt, of
India and FAO - Irrigation and Drainage
paper, 24 & 56.
CROPWAT 8.0 Model
CROPWAT for Windows is a decision
support system developed by the Land and
Water Development Division of FAO, Italy
with the assistance of theInstitute of Irrigation
and Development Studies of Southampton,
UK and National Water Research Center,
Egypt. The model carries out calculations for
reference evapotranspiration, crop water
requirements and irrigation requirements in
order to develop irrigation schedules under
various management conditions. It allows the
development
of
recommendations
for
1453
Int.J.Curr.Microbiol.App.Sci (2019) 8(10): 1452-1459
improved irrigation practices, the planning of
irrigation schedules and the assessment of
production under rain fed conditions or deficit
irrigation (Adriana and Cuculeanu, 1999).
different crops have been estimated by
summing up the crop evapotranspiration in all
growth stages.
ETcrop = Kc × ETo
Reference evapotranspiration
This
parameter
was
calculated
inCROPWAT8.0 Model which uses the FAO
Penman-Monteith method (Allen et al., 1998).
In this model, most of the equation parameters
are directly measured or can be readily
calculated from weather data.
Where,
ETc
represents
crop
evapotranspiration, Kc represents crop
coefficient and ETo represents reference
evapotranspiration.
Results and Discussion
Reference evapotranspiration
Where, ETo is reference evapotranspiration
(mm day-1), Rn is net radiation at the crop
surface (MJ m-2 day-1),G is soil heat flux
density (MJ m-2 day-1),T is air temperature at 2
m height (°C),u2is wind speed at 2 m height
(m s-1), es is saturation vapour pressure (kPa),
ea is actual vapour pressure (kPa), es - ea is
saturation vapour pressure deficit (kPa), Δ is
slope vapour pressure curve (kPa °C-1),Υ is
psychometric constant (kPa °C-1).
Effective rainfall
It is the part of rainfall which is stored in the
soil profile and helps in the growing of crops.
Rainfall of Lakhimpur Kheri (UP, India)
district of Uttar Pradesh in Table 4.To
calculate the effective rainfall the USDA Soil
Conservation Service method was used
(Smith, 1991). Where, Peff represents effective
rainfall (mm) and Ptot represents total rainfall
(mm)
Crop evapotranspiration
For calculation of crop evapotranspiration
CROPWAT 8.0 model uses crop coefficient
approach and Crop water requirements of
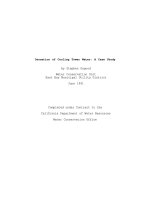
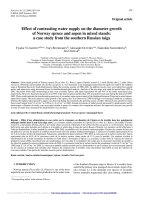
The
simulated
values
of
reference
evapotranspiration (ETo) through CROPWAT
8.0 model using Penman-Monteith equation,
for the Lakhimpur Kheri district along with
the meteorological parameters is presented in
the Table 3 and monthly distribution of
reference evapotranspiration is shown in the
Figure 2. From the result, it is revealed that
the maximum ET0 was found in May month
(6.53 mm/day), which was mainly due to high
temperature and wind velocity, whereas it was
minimum in December (1.85 mm/day).
The reference evapotranspiration is the
function of temperature & also affected by
relative humidity (RH).
Effective rainfall
The effective rainfall was calculated for the
study area with the help of USDA SCS
method which is presented in Table 4 and
Figure 3. This will help for the estimation of
irrigation water requirement of Sugarcane
crops for the same area.
From the analysis, it was found that the
effective rainfall was maximum in August
month (158.6 mm) followed by July month
(156 mm), although it was minimum in
November (1.0 mm).
1454
Int.J.Curr.Microbiol.App.Sci (2019) 8(10): 1452-1459
Table.1 Soil data
S.No.
1.
2.
3.
Area (‘000 ha)
157.0
183.7
94.5
Major Soils
Deep loamy soil
Deep, silty soils
Deep, silty soils associated with
loamy soils slightly eroded
Percent (%) of total
30 %
35%
18%
Source – Agriculture Contingency Plan for District: Lakhimpur kheri
Table.2 Rainfall pattern of Lakhimpur Kheri (UP,India) District of Uttar Pradesh
Average Rainfall (mm)
SW monsoon
Post monsoon
Winter
(June-sep)
(Oct-Dec)
(Jan-March)
District
921.8
Lakhimpur Kheri
55.5
57.4
Pre
(Apr-May)
Annual
34.0
1068.7
mm
P eff = Ptot×(125-0.2Ptot)/125
P eff = 125 + 0.1 × Ptot
for Ptot< 250
for Ptot> 250mm
Table.3 Reference evapotranspiration along with meteorological parameters of the study area
Month
Jan
Feb
Mar
April
May
Jun
Jul
Aug
Sept
Oct
Nov
Dec
Average
Min Temp Max Temp Humidity
°C
°C
%
9.1
22.3
74
10.5
25.6
70
15.3
31.6
63
20.6
37.5
49
23.8
38.5
51
25.2
36.4
72
25.1
32.7
88
25
32.5
88
23.7
32.2
88
20.7
31
74
13.6
26.8
75
9.3
22.7
75
18.5
30.8
72
Wind
km/day
86
104
112
147
147
130
112
104
95
86
69
69
105
Sun
hours
6.9
7.7
8.4
9.3
9.4
6.6
6.7
5.9
5.7
7.1
7.5
7.2
7.4
Rad
MJ/m²/day
13.1
16
19.5
22.9
24
20
20
18.1
16.4
16
14.1
12.7
17.7
ETo
mm/day
1.93
2.69
3.98
5.97
6.53
5.18
4.44
4.01
3.58
3.44
2.49
1.85
3.84
Source: New_Loc Clim 1.10 Software
Table.4 District-wise effective rainfall of Lakhimpur Kheri (UP,India) district
Month
Jan
Feb
Mar
April
May
Jun
Jul
Aug
Sept
Oct
Nov
Dec
Total
Rain (mm)
33
13
16
5
21
121
310
336
185
72
1
4
1117
Eff rain (mm)
31.3
12.7
15.6
5
20.3
97.6
156
158.6
130.2
63.7
1
4
695.9
Source: New_Loc Clim 1.10 Software
1455
Int.J.Curr.Microbiol.App.Sci (2019) 8(10): 1452-1459
Table.5 Crop water requirement of Sugarcane crop in Lakhimpur Kheri (UP,India) District
Crop
Jan
Feb
Mar
Apr
May
Jun
Jul
Aug
Sep
Oct
Nov
Dec
Sugarcane
29.3
50.6
44.9
85.6
156.9
85.1
8.8
0
4.1
57.2
87.3
62.5
Table.6 Net Scheme Irrigation Required
Net scheme irr.req.
Jan
Feb
Mar
Apr
May
Jun
Jul
Aug
Sep
Oct
Nov
Dec
in mm/day
in mm/month
in l/s/h
0.9
29.3
0.11
1.8
50.6
0.21
1.4
44.9
0.17
2.9
85.6
0.33
5.1
156.9
0.59
2.8
85.1
0.33
0.3
8.8
0.03
0
0
0
0.1
4.1
0.02
1.8
57.2
0.21
2.9
87.3
0.34
2
62.5
0.23
Aug
35.08
82.08
0.00
Sep
35.08
82.08
3.37
Oct
35.08
82.08
46.95
Nov
35.08
82.08
71.66
Dec
35.08
82.08
51.30
Table.7 Net Scheme Irrigation Required
Month
Irrigated Area (%)
Actual Area (000Ha)
MCM
Jan
35.08
82.08
24.05
Feb
35.08
82.08
41.53
Mar
35.08
82.08
36.85
Apr
35.08
82.08
70.26
May
35.08
82.08
128.78
Jun
35.08
82.08
69.85
Jul
35.08
82.08
7.22
Fig.1 Location map of District Lakhimpur Kheri
Fig.2 Reference evapotranspiration along with meteorological parameters of the study area
1456
Int.J.Curr.Microbiol.App.Sci (2019) 8(10): 1452-1459
Fig.3 District-wise effective rainfall of Lakhimpur Kheri (UP, India) district
Fig.4 crop water requirement of sugarcane crop in Lakhimpur Kheri (UP,India) District
Fig.5 Net scheme irrigation required
Fig.6 Net scheme irrigation required
1457
Int.J.Curr.Microbiol.App.Sci (2019) 8(10): 1452-1459
efficiency of available water.
Acknowledgment
Crop water requirement
The difference in the evapotranspiration and
evaporation was considered as the water
consumed by the Sugarcane and termed as
crop water requirement. Estimated Crop water
requirement of Sugarcane crops for
Lakhimpur Kheri district has been presented
in Table 5 and the water demand of crops
presented in the Figure 4.
The results show that the crop water
requirement of Sugarcane crop is more in the
month of May followed by April month within
the study area. This was happened due to
nearly high reference evapotranspiration in the
same months. Also, during the growing and
developing period crops also need large
quantity of water for various physiological
functions.
The water requirement was calculated for
Lakhimpur Kheri district of Uttar Pradesh
State and it was found in the Sugarcane crop
(672.3mm). Apart from sunshine and
temperature, other climatic factors like wind
velocity and humidity also influence the crop
water need. By using the crop water
requirement of Sugarcane crop, water demand
has been calculated for Sugarcane Lakhimpur
Kheri district of Uttar Pradesh State, which is
shown in Table 5 and 6 and Figure 4 and 5.
The water demand for Sugarcane crop will
help in water management as well as in the
irrigation scheduling in the study area.
This study will help in the calculation of net
irrigation
water
requirement
and
understanding the behaviour of weather
parameter on reference evapotranspiration
(Fig. 6 and Table 7). The results clearly show
that the crop water requirement during the
summer period is very high as compared to the
other periods. The results of this study may
help in planning of efficient water
management and ultimately in increasing the
The authors wish to acknowledge the technical
and data support by the staff of the ICARIndian Institute of Soil & Water Conservation,
Dehradun (Uttarakhand), India. Authors also
put into record the deep appreciation to Dr.
Parmanand Kumar, Scientist, FRI, Dehradun
and Dr. Anand Gupta, Scientist, ICARIISWC, Dehradun for their immense support
during the preparation of the present
manuscript.
References
Adriana, M.V. and Cuculeanu. 1999. Uses of a
decision
support
system
for
agricultural
management
under
different climate conditions, Abstracts
Volume of the 4th European
Conference on Applications of
Meteorology (ECAM 99), Norrkoping,
Sweden, 13-17 September. p. 135.
Allen, R.G., Pereira, L.A. and Raes, D. 1998.
Crop evapotranspiration. In: FAO
Irrigation and Drainage Paper 56.
Rome: FAO, 293.
Dechmi, F., Playan, E., Faci, J. M. 2003.
Analysis of an irrigation district in
north
eastern
Spain.
Irrigation
evaluation, simulation and scheduling.
Agricultural Water Management, 61:
93–109.
FAO Irrigation and Drainage Paper No. 24.
Rome.
FAO, 1992. CROPWAT: A computer
program for irrigation planning and
management. FAO Irrigation and
Drainage Paper 46. Rome: FAO, 126.
Kar, G. and Verma, H.N. 2005. Climatic water
balance, probable rainfall, rice crop
water requirements and cold periods in
AER 12.0 in India. Agricultural Water
Management. 72: 15–32.
Martyniak, L., Dabrowska, Z. K. and
1458
Int.J.Curr.Microbiol.App.Sci (2019) 8(10): 1452-1459
Szymczyk, R. 2006. Validation of
satellite-derived soil vegetation indices
for prognosis of spring cereals yield
reduction under drought conditions Case study from central-western
Poland. Advances in Space Research,
8: 1–6.
Smith, M. 1991. “CROPWAT: Manual and
Guidelines”. FAO of UN, Rome.
How to cite this article:
Ramesh Verma and Singh, R. M. 2019. Water Requirement of Sugarcane Using CROPWAT
8.0 Model: A Case Study of North India. Int.J.Curr.Microbiol.App.Sci. 8(10): 1452-1459.
doi: />
1459